


Abstract
Background: Electrical impedance spectroscopy is a technique which evaluates differences in dielectric properties of tissues for cancer identification. Methods: Murine hepatic cancer model was developed by intraperitoneal administration of N-nitrosodiethylamine to male BALB/c mice. Tumors obtained were evaluated for their conductivity in frequency range of (4 Hz–5 MHz). All tumors were subjected to histopathological grading and parameters such as free spacing, necrosis, and cell density were estimated on histological slides. The status of gap junctions and gap junction intercellular communication (GJIC) were studied using enzyme-linked immunosorbent assay, immunohistochemistry, dye transfer assay, and electron microscopy. Results: Histopathological investigation revealed the presence of moderately to poorly-differentiated hepatocellular carcinoma (HCC) in mice. All types of tumors showed higher electrical conductivity than normal liver tissue in frequency range (4 Hz–1 kHz). However, in frequency range (10 kHz–5 MHz) only poorly-differentiated tumors showed higher conductivity compared to normal tissue. The most prominent findings in moderately-differentiated and poorly-differentiated HCC were increased visible free spaces and necrosis respectively. The status of cell gap junctions were significantly deteriorated in tumors and a corresponding significant reduction in GJIC was also observed. These biological indicators were correlated with electrical conductivity of hepatic tumors. Conclusion: Variations in electrical conductivity spectra of hepatic tumors reflect progression of HCC. General significance: Future studies can be planned to perform hierarchical clustering of dielectric parameters with more number of tumor samples to establish dielectric spectroscopy-based classification or staging of hepatic tumors.
Export citation and abstract BibTeX RIS
1. Introduction
Hepatocellular carcinoma (HCC) is one of the most common cancer which has a very high mortality to incidence ratio [1, 2]. An early and correct diagnosis of HCC is the key factor for successful and effective treatment [3]. For around 30% of patients who are diagnosed at an early stage, curative options like surgical resection, ablation etc can lead to a 5-year survival of 70% [4]. However, in the majority of cases, disease usually remains silent and is detected at an advanced stage, where few treatment options exist [5]. The delay in diagnosis is usually due to a lack of patient awareness and high cost of sophisticated imaging equipment involved [6]. Therefore, there is a dire need to explore alternative cost-effective strategies for early detection of HCC.
Electrical impedance spectroscopy (EIS) is a widely studied cost-effective and promising tool for cancer detection [7]. EIS utilizes non-ionizing electromagnetic radiations to investigate tissue dielectric parameters and thus tissue examination is harmless and is looked as a future tool for the mass survey of cancerous tissues [8, 9]. Tissue dielectric spectroscopy indicates the movement of charge within the tissue. This movement of charge in a tissue is dependent on several biological indicators like tissue architecture, cell spacing, and free cellular space, status of gap junctions, extracellular fluid content and membrane biophysical properties [10]. The contribution of these biological indicators to the flow of charge can be further resolved at different current frequencies [11]. Cancer is an evolutionary process and in course of its development tissue/cells undergo several changes that can be resolved and analysed using dielectric spectroscopy.
EIS was successfully applied to differentiate normal and neoplastic tissues of skin [12], breast [13], lungs [14], bladder [15] and prostate [16] etc. These malignant tissues either show increase or decrease in conductivity compared to normal tissue depending upon the type of tissue involved [13, 16]. The reports regarding dielectric properties of hepatocellular carcinoma were equivocal and investigators had shown both increase and decrease in dielectric parameters compared to the normal hepatic tissue [17, 18]. The discrepancies in observations can be jointly attributed to the lack of attempt to correlation to the histological staging and other biological indicators. In order to address these discrepancies, we have designed the present study to investigate tumor dielectric properties at different histological stages of HCC and its correlation with biological indicators.
2. Materials and methods
2.1. Chemicals and reagents
N-Nitrosodiethylamine (NDEA), lucifer yellow and glutaraldehyde were purchased from Sigma Aldrich Co. (St. Louis, USA). Primary antibodies; rabbit connexion (Cx) polyclonal antibodies (Cx43, 71–0700; Cx32, 71–0600; Cx26, 512800) and secondary antibody: goat anti-rabbit IgG secondary antibody (65–6120) were procured from Thermo Fisher Scientific (Rockford, USA). Rest of the chemicals used in the study were purchased from Sisco Research Laboratories Pvt. Ltd (Mumbai, India).
2.2. Development of hepatic cancer model using NDEA as a carcinogen
All animal experiments were carried out after getting approval from institutional animal ethics committee (IAEC/KMC/41/2017). Healthy male BALB/c mice (6–8 weeks old) were obtained from institutional central animal facility and kept in polypropylene cages under controlled environmental condition [temperature (25 ± 1 °C), humidity (65%–80%) and 12 h light/dark cycle]. All animals were given standard animal pellet diet and water ad libitum. Prior to the start of the experiment all animals were acclimatized for a period of one week. The last day of acclimatization was considered as day 0 of the experiment. General physiological parameters (such as body weight, diet and water intake) were monitored till the termination of the experiment.
For the development of hepatocarcinogenesis model, animals were randomly divided into Control and NDEA groups. The details of dosing protocol can be found elsewhere [19]. Briefly, NDEA group animals received N-nitrosodiethylamine dissolved in saline through intraperitoneal route once every week for a period of 8 weeks (Cumulative dose 200 mg kg−1 bw). No special treatment was given to animals in CONTROL group.
2.3. Development and calibration of two-pin electrode probe
Silver electrode probe was designed in-house with following dimensions for measurement of tumor dielectric parameters. The width, internal diameter and external diameter of outer electrode were 1.1, 2.2 and 4.4 mm respectively. The diameter of inner electrode and the distance between inner and outer electrode were 0.8 mm and 0.7 mm respectively. The probe was prepared in such a way that only one surface of the probe was exposed to air and remaining part was embedded in the plastic (figures 1(A), (B))
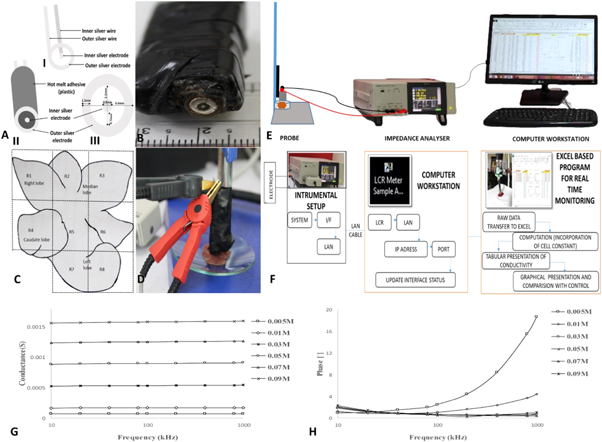
Figure 1. (A) Probe assembly and dimensions; AI and AII) Probe design and assembly; AIII) Physical dimensions of probe; (B) Two pin silver probe for tissue conductivity measurement; (C) Liver regions for dielectric measurements (R1–R8); (D) Probe setup; (E) and (F) Instrumental setup and schematic representation of tissue data collection system respectively; (G) Conductance of sodium chloride solution (aq) using two-pin silver electrode probe in frequency range 10 kHz–1 MHz; (H) admittance phase of sodium chloride solution (aq) using two-pin silver electrode probe in frequency range 10 kHz–1 MHz.
Download figure:
Standard image High-resolution image2.4. Assessment of probe errors and calibration
Impedance analyzer was interfaced to probe through impedance matched 50 Ω co-axial cables of length 1 m. The stray conductance, series lead inductance, resistance and shunt conductance arising within the instrumental setup was compensated with open-circuit compensation followed by short-circuit compensation. Following this, probe was assessed for errors and calibrated using NaCl (aq) solution.
The tissue dielectric data is usually presented in the form of conductivity, σ and relative permittivity εr. Conductivity and permittivity are related to each other as

where Y is the admittance, G and C are conductance and capacitance respectively.

εo is the permittivity of free space (8.85 × 10⁻¹² F m−1). The value of cell constant, K was estimated according to the method described by Gabriel et al 2009 [20]. NaCl solutions of different molar concentrations ranging from (0.005–0.09) M were measured for conductance in frequency range 10 kHz–1 MHz. The concentration of these solutions was selected considering the range of conductance exhibited by different tissues under investigation. The temperature (24 °C) of the NaCl (aq) solution was noted and kept constant during all measurements. The cell constant was calculated using conductance values of these solutions and their literature conductivity values for a given concentration and temperature [21]. Theoretically, no dielectric dispersion is observed in ionic solutions like NaCl at frequencies below 1 MHz which means that value of conductance will not change with frequency and the conductivity of these solutions are known in the literature [20]. Any deviation from this ideal behaviour is the result of equipment noise or probe artefact like electrode polarization. In accordance with Laufer et al 2010 we also evaluated phase of these solutions in order to get an idea of electrode polarization [22]. We observed that error is lowest in frequency range ranging from (10 kHz–1 MHz) as in this region conductance of these solutions were fairly independent of the frequency. Therefore, frequency region 10 kHz–1 MHz was chosen for the calculation of cell constant. The data was shown in the figures 1(G), (H) and summarized in tables 1 and 2. As can be seen from the data, errors in the measurements of conductance were below (10%) in frequency region 10 kHz–1 MHz and measured phase of NaCl solutions was roughly around 2° which ideally should be zero and regarded as error in the measurements. The major problem arises in the frequency region less than 10 kHz where degree of error was much higher (phase angle around 6°), which indicated the higher contribution of electrode polarization in this region. The data obtained was similar to reported values by Laufer et al 2010 [22]. Compared to the other solutions, 0.005 M concentration solution has a higher phase in frequencies above 100 kHz. However, this had not affected our tissue readings as the conductance of this solution was far below the tissue and tumor conductance.
Table 1. Average conductance(S) of NaCl (aq) solution (10 kHz–1 MHz). The conductivity is calculated from the conductance and cell constant. The conductivity percentage difference is calculated from literature values [21].
| NaCl concentration (mol l−1) | G(S) average | G(S) SD | G(S) CV (%) | Cell constant (K) | σ(S m−1) average | σ(S m−1) (literature) | σ(S m−1) % difference |
|---|---|---|---|---|---|---|---|
| 0.005 | 7.4 × 10⁻⁵ | 1.54 × 10⁻⁶ | 2.09 | 1.55 × 10⁻³ | 0.04 | 0.04 | 6.26 |
| 0.01 | 1.72 × 10⁻⁴ | 1.85 × 10⁻⁵ | 1.08 | 1.69 × 10⁻³ | 0.10 | 0.10 | −1.83 |
| 0.03 | 5.36 × 10⁻⁴ | 5.96 × 10⁻⁵ | 1.11 | 1.69 × 10⁻³ | 0.32 | 0.32 | −1.74 |
| 0.05 | 9.01 × 10⁻⁴ | 8.07 × 10⁻⁵ | 0.90 | 1.69 × 10⁻³ | 0.54 | 0.54 | −1.53 |
| 0.07 | 1.25 × 10⁻³ | 1.00 × 10⁻⁵ | 0.80 | 1.68 × 10⁻³ | 0.75 | 0.75 | −0.88 |
| 0.09 | 1.58 × 10⁻³ | 1.21 × 10⁻⁴ | 0.76 | 1.73 × 10⁻³ | 0.98 | 0.95 | −4.52 |
Table 2. Average phase accuracy of NaCl (aq) solution (10 kHz–1 MHz).
| NaCl (M) | Phase (°) | Phase(°) SD |
|---|---|---|
| 0.005 | 6.12 | 6.33 |
| 0.01 | 1.92 | 1.24 |
| 0.03 | 0.84 | 0.40 |
| 0.05 | 0.81 | 0.48 |
| 0.07 | 0.82 | 0.53 |
| 0.09 | 1.04 | 0.51 |
2.5. Biological data acquisition and presentation
For the assessment of tissue/tumor dielectric parameters, liver was divided into 8 regions (R1–R8) as shown in figure 1(C) and the conductance values of each region was measured using impedance analyser (IM3570, Hioki, Japan) in the frequency range (4 Hz–5 MHz) (figures 1(D), (E)). Probe was positioned on a vertical holder and allowed to stand under its own weight to ensure similar contact pressure during all readings. Prior to the experiment, instrument normalization was carried out for fringing capacitance and conductance effects.
Microsoft excel spreadsheet was used as an interface between impedance instrument and observer (figure 1(F)). A program was developed to simultaneously apply cell constant to the incoming data and a final output reading in terms of tissue conductivity and permittivity could be generated. It also allowed graphical representation of data on a single screen. This configuration helped us to carry-out real-time monitoring of the final data during experiments and helped to reduce errors caused by misplacement of electrodes on the tissue/tumor surface.
2.6. Histopathological assessment
Following dielectric measurements, each region was processed for histopathological assessment as per standard laboratory protocol. Briefly, liver regions under probes were fixed and stored in 10% buffered formaldehyde and embedded in paraffin wax. The tissue sections of 5 μm tissue were cut using microtome and stained with haematoxylin and eosin (H&E). These sections were viewed under a light microscope (Lx 300, Labomed, USA) and tumors were classified into histopathological grades.
2.7. Necrosis
Necrotic percentage of tissue/tumor was calculated on histological slides. Necrotic regions were viewed as light sections with no living cells having pale cytoplasm and possessing no nuclei. Extent of necrotic tissue was estimated as percentage of necrotic cells to the total number of cells.
2.8. Cell density and Percentage of free area in hepatic parenchyma
Cell density and free area in the hepatic parenchyma were estimated on histological slides. Each histological image was divided into smaller square segments of 1mm each using an image editing software (Image J; National Institute of Health). Cells were counted in each of the segment and cell density was calculated as
Free area in the hepatic parenchyma of hepatic tumors was estimated on histological slides using Image J software (Image J; National Institutes of Health) and expressed as
2.9. Status of gap junctions
2.9.1. Enzyme immunosorbent assay (ELISA)
Antigen was extracted from liver tissue in a similar manner as described previously [23]. Concisely, 50 μl of extracted antigens were coated to flat bottomed polystyrene microtitre plates (Himedia, India) and kept at 4 °C overnight. Plates were then blocked with 1% Bovine serum albumin (BSA) in PBS for about 2 h. After a wash with PBSTw (Phosphate buffer saline having 0.05% (v/v) of tween), each well was incubated with 100 μl of primary antibody (diluted to1:1000); Cx26, Cx32, Cx43 at room temperature for 2 h. Wells were washed with PBSTw and 100 μl of horseradish peroxidase (HRP)-labelled goat anti-rabbit IgG secondary antibody (1:3000 dilution). The 100 μl of substrate, 3,3',5,5'-tetramethylbenzidine was added to each well. Reaction was stopped by 2 M sulphuric acid followed by measurement of optical density at 450 nm on ELISA plate reader (Lisa Plus, Rapid diagnostics, India).
2.9.2. Immunohistochemistry (IHC)
IHC was performed on paraffin embedded histological slide as described earlier [23]. Briefly, 5 μm deparaffinised sections were submerged in antigen retrieval buffer (Sodium citrate buffer 10 mM, pH 6.0) with subsequent boiling for 15 min. After antigen retrieval, slides were submerged in 1% H2O2 solution at room temperature in order to block the activity of endogenous peroxidase. Non-specific sites blocking was achieved by incubation in 10% BSA. Tissue sections were then incubated with primary antibody Cx32 (dilution of 1:1000), Cx43 (dilution of 1:1000) or Cx26 dilution of 1:100) respectively. After washing sections were incubated with HRP-labelled goat anti- rabbit IgG secondary antibody (dilution of 1:3000) followed by incubation with 3, 3'-diaminobenzidine solution (1%) for 5 min for colour development. Sections were then dehydrated and viewed under the light microscope (Lx 300, Labomed, USA).
2.9.3. Lucifer yellow dye transfer assay
Lucifer yellow dye transfer assay was carried out as described earlier for the assessment of gap junctional intercellular communication [24]. Briefly, three incisions were made in the excised liver tissue/tumor and 0.5% of lucifer dye solution (in PBS) was dropped on the incision and incubated at room temperature for 3 min. Tissues were then washed with PBS to remove non-absorbed dye, followed by fixation in formalin and paraffin embedding as per standard protocol. For GJIC measurements, 5 μm sections of paraffin-embedded tissues/tumors were cut perpendicular to incision line and viewed under a fluorescent microscope (1x-51 inverted fluorescence microscope, Olympus, Japan). GJIC is calculated as the ratio of dye diffusion area to total length of the incision.
2.10. Electron microscopic studies of liver tissues/tumors
For transmission electron microscopy studies, liver tissue/tumor were fixed in 4% glutaraldehyde (prepared in phosphate buffer (0.2 M, pH 7.2)) for 2 h. After fixation, graded dehydration was carried with ascending grade of ethanol, keeping tissue in each for at least 30 min. For the purpose of embedding and proper infiltration of embedding resin into the tissue, propylene oxide was used. Following this, tissue was treated with 1:1 mixture of epoxy resin and propylene oxide. The tissue was then kept in epoxy resin overnight in vials with caps removed (evaporate propylene oxide). The embedding was carried out in freshly prepared epoxy resin and polymerization at 60 °C for 48 h. Leica Ultracut (UCT) ultramicrotome was used to obtain ultrathin tissue sections and then mounted on collodion-carbon coated grids for visualization under transmission electron microscope (Tecnai G2 Spirit Bio-TWIN).
2.11. Statistical analysis
Data were expressed in the form of Mean ± SD and evaluated by one-way ANOVA which was followed by post-hoc analysis (Fisher's LSD). Normality of data was assessed using Shapiro-Wilk test and homogeneity of variance by Levene's test. P value ≤0.05 was considered to be statistically significant. Pearson correlation was carried out to study the correlation of conductivity with the percentage of necrosis, free area in hepatic parenchyma and GJIC.
3. Results
The hepatic cancer model was developed using chemical carcinogen NDEA. During the developmental stage of HCC, body weight, diet and water intake of animals showed expected changes (data not shown). Post 12 weeks of NDEA treatment, gross morphological analysis of animals showed altered liver morphology with indistinguishable and swollen liver lobes. Several small to large lesions/tumors were noticed in the liver of NDEA group animals in comparison to no lesions/tumors in CONTROL group animals (figure 2(A)). Histopathological investigations revealed the presence of HCC in samples with stages ranging from moderately-differentiated HCC to poorly-differentiated HCC. Moderately-differentiated HCCs were further segregated as with bile accumulation and other without bile accumulation (figure 2(B)). A total of sixteen animals (n = 16) including normal were evaluated for dielectric properties and each histological type has four animals (n = 4).

Figure 2. (A) Gross morphology of liver/liver tumors (Arrows showing HCC nodules); (B) Haematoxylin & Eosin stained section of liver/liver tumours (n = 16, each group has 4 animals) (Magnification: 100X); (I) Histology of CONTROL group showing normal pattern of hepatocytes arrangement; (II–III) Histology of NDEA group showing moderately-differentiated HCC without bile; (IV–V) Histology of NDEA group showing moderately-differentiated tumor showing bile; (VI) Histology of NDEA group showing poorly-differentiated HCC; (C) Free area in hepatic parenchyma expressed in percentage; (D) Necrosis in hepatic tissues/tumors expressed in percentage; (E) Cell density. (Data were expressed as mean ± SD and analysed using one-way ANOVA followed by post hoc test (Fisher's LSD). *: represents p ≤ 0.05).
Download figure:
Standard image High-resolution imageModerately-differentiated and poorly-differentiated tumors showed significant structural and physiological differences compared to normal tissue and thus these changes were reflected in their conductivity spectrum. The most prominent finding in moderately-differentiated HCC was increased visible free spaces in hepatic parenchyma which could be due to decreased size of hepatocytes (figure 2(C)). In contrast, no significant increase in visible free space was observed in poorly-differentiated HCC however, a significant increase in necrosis was observed compared to CONTROL and moderately-differentiated HCC (figure 2(D)). A decrease in the size of hepatocytes and increase in cell density were observed in all tumor groups (figure 2(E)).
During early stages of hepatocarcinogenesis (i.e. till 8 weeks of the process) dielectric spectroscopy was not able to detect any significant changes in hepatic tissue. Significant changes in dielectric parameters started appearing post 12 weeks of hepatocarcinogenesis. Figures 3(A) and (C) showed conductivity and relative permittivity of tumors in low frequency region (4 Hz–1 kHz) where moderately-differentiated HCC tumors with or without bile accumulation in hepatic parenchyma showed increased conductivity and relative permittivity compared to CONTROL hepatic tissue. The increase was significantly higher for moderately-differentiated tumors with bile accumulation compared to without bile accumulation type. However, as frequency is increased to mid-frequency region (10 kHz–5 MHz) no significant change in tumor conductivity and relative permittivity was noted for moderately-differentiated tumors compared to CONTROL hepatic tissue (figures 3(B) and (D)). Unlike moderately-differentiated HCC, poorly-differentiated HCC showed increased conductivity and relative permittivity in whole frequency region (4 Hz–5 MHz). The increase was significant with respect to CONTROL hepatic tissue and moderately-differentiated HCC (figures 3(A)–(D)).
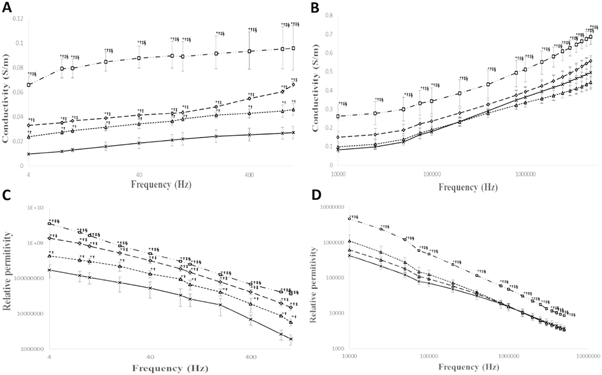
Figure 3. Change in the conductivity of hepatic tissue/tumors in frequency region (n = 16, each group has 4 animals). (A) Change in the conductivity of hepatic tissues/tumors in frequency range (4 Hz–1 kHz); (B) Change in the conductivity of hepatic tissues/tumors in frequency range (10 kHz–5 MHz); Change in the relative permitivity of hepatic tissue/tumors in frequency region (n = 16, each group has 4 animals). (C) Change in the relative permittivity of hepatic tissues/tumors in frequency range (4 Hz–1 kHz); (D) Change in the relative permitivity of hepatic tissues/tumors in frequency range (10 kHz–5 MHz). (Data were expressed as mean ± SD and analysed using one-way ANOVA followed by post hoc test (Fisher's LSD). *: represents p ≤ 0.05; †: when compared with the CONTROL; ‡: when compared with the moderately-differentiated HCC without bile; §: when compared with the moderately-differentiated HCC with bile).
Download figure:
Standard image High-resolution imageThe status of cell to cell gap junctions was significantly deteriorated in all type of tumors compared to CONTROL hepatic tissue. A significant reduction was observed in the expression of gap junction proteins Cx26 and Cx32 in all type of HCC tumors; whereas, Cx43 significantly decreased in poorly-differentiated HCC (table 3).
Table 3. Cx26, Cx32 and Cx43 protein expressions in liver tissue/tumor. (Data were expressed as mean ± SD and analysed using one-way ANOVA followed by post hoc test (Fisher's LSD). *: represents p ≤ 0.05; †: when compared with the CONTROL; ‡: when compared with the moderately-differentiated HCC without bile; §: when compared with the moderately-differentiated HCC with bile).
| Parameters | CONTROL | Moderately-differentiated HCC without bile | Moderately-differentiated HCC with bile | Poorly-differentiated HCC |
|---|---|---|---|---|
| Connexin 26 protein (pg ml−1) | 23.40 ± 2.428 | 17.29 ± 1.037*† | 16.89 ± 0.982*† | 12.71 ± 1.034*†‡§ |
| Connexin 32 protein (ng ml−1) | 0.135 ± 0.009 | 0.101 ± 0.002*† | 0.094 ± 0.007*† | 0.074 ± 0.015*†‡§ |
| Connexin 43 protein (ng ml−1) | 0.133 ± 0.007 | 0.118 ± 0.005 | 0.117 ± 0.003 | 0.107 ± 0.004*† |
| GJIC (relative distance of dye transfer) | 195.6 ± 7.300 | 167.3 ± 6.188*† | 146.6 ± 5.89*†‡ | 84.66 ± 10.94*†‡§ |
Immunohistochemistry showed localisation of connexion proteins in liver tissue/tumors (figure 4). Cx proteins were uniformly distributed on the hepatocyte membranes in normal tissue (figures 4(A)–(C)) whereas internalization of Cx proteins into the cytoplasm was evident in moderately and poorly-differentiated tumors. The degree of internalization increased from moderately to poorly-differentiated HCC (figures 4(D)–(I)).

Figure 4. Immunohistochemical analyses of Cx26, Cx32 and Cx43 in liver/liver tumors. (A)–(C) CONTROL group normal liver showing extensive membranous staining for each Cx proteins; (D)–(F) Moderately-differentiated tumors without bile and with bile showing membranous as well as less cytoplasmic staining for Cx proteins; (G)–(I) Poorly-differentiated tumors showing decreased membranous staining and increased cytoplasmic staining. The increased cytoplasmic staining might represent 'internalization'; (Magnification: 100X).
Download figure:
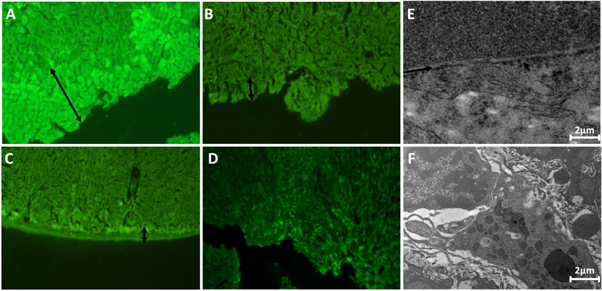
Standard image High-resolution imageThe effect of altered distribution of connexion proteins could be clearly observed on gap junction intracellular communication. Figure 5(A) showed the movement of Lucifer yellow dye across cell junctions in CONTROL hepatic tissue. The clear reduction in dye transfer was observed in all types of HCC tumors compared to CONTROL liver tissue (figures 5(A)–(E)). A significant reduction in GJIC (as measured from Lucifer yellow dye movement) was observed in all types of HCC tumors compared to normal liver tissue. The decrease was also significant among different histological stages (table 3). The impairment of cell to cell gap junctions was also evident in transmission electron microscopy (figures 5(E) and (F)).
Figure 5. In vivo GJIC assessment of liver/liver tumors (arrow showing dye transfer across hepatic parenchyma). (A) CONTROL group showing dye transfer across liver parenchyma (Magnification: 100X); (B) Moderately-differentiated tumors without bile accumulation showing decreased dye transfer (Magnification: 100X); (C) Moderately-differentiated tumors with bile accumulation showing some degree of dye transfer (Magnification: 100X); (D) Poorly-differentiated tumor showing no dye transfer (Magnification: 100X); (E) Transmission electron micrograph of Co group liver tissue, arrow shows presence of gap junctions; (F) Transmission electron micrograph of hepatic tumors showing absence of gap junctions on cell membranes.
Download figure:
Standard image High-resolution image
GJIC showed negative correlation with conductivity of tumors in whole frequency spectrum, whereas a strong positive correlation of conductivity was established with necrosis in the tumors. No correlation of conductivity was noted with visible free spaces in tumors (table 4).
Table 4. Correlation of tumor conductivity with necrosis, free area in hepatic parenchyma and GJIC. (*. represents p ≤ 0.05).
| Conductivity at different frequency intervals | Necrosis (%) | Free area in hepatic parenchyma (%) | GJIC |
|---|---|---|---|
| 4 Hz–1 kHz | 0.971–0.942* | (−0.154)–(−0.001) | (−0.990)–(−0.957)* |
| 10 kHz–1 MHz | 0.876–0.831* | (−0.189)–(−0.158) | (−0.915)–(−0.864)* |
| 1.5 MHz–5 MHz | 0.831–0.823* | (−0.250)–(−0.251) | (−0.864)–(−0.862)* |
4. Discussion
Dielectric spectroscopy which measures conductivity and relative permittivity of tissues as a function of frequency is an upcoming technique for cancer detection [22]. It offers several advantages over conventional techniques such as non-invasiveness, ease of implementation, and use of non-ionizing radiations. These advantages make it a preferable technique and encouraged researcher to explore the dielectric characteristics of tumors [25].
In the present study, a comprehensive approach that included assessment of biological and biophysical parameters affecting conductivity was adopted to study tissue electrical conductivity at different development stages of HCC. During the evolution of HCC, hepatocytes undergo massive transformation to attain neoplastic characteristics. In this process there is complete remodelling of hepatic architecture. These biological changes in tumors are often stage-dependent and their overall effect is reflected in the dielectric spectra of tumors [17, 26].
Here, in this study animals at different histopathological stages of HCC were obtained using NDEA-induced HCC model. In the current cancer model all animals did not reach to same stage in same time interval therefore, it was easy to obtain tumors of different histological grades. Based on the histopathological classification, tumors were segregated as moderately-differentiated HCC without bile accumulation, moderately-differentiated HCC with bile accumulation and poorly-differentiated HCC. We had observed that each histological stage represented its distinct dielectric pattern which was significantly different from others. This observation was in corroboration with our previous findings where we had studied the conductivity behaviour of liver tumors at high-grade dysplasia. The conductivities of dysplastic nodules were significantly decreased compared to normal liver tissue [27]. Infact, tumors of different tissues also exhibit different conductivity pattern. For example, prostate tumors are known to show decreased conductivity compared to normal prostate tissue [28] whereas, breast tumors are reported to have higher conductivity compared to normal breast tissue [29]. The difference in conductivity behaviour of these tumors could be due to structural differences of these tissues. In the case of prostate tumors, cancer cell's proliferation results in reduction of stromal and extracellular spaces and thus decreases conductivity whereas, normal breast tissue has abundant adipose tissue that contributes to a remarkable lower conductivity of breast tissue. As breast cancer grows fat content was reduced and spaces are taken up by neoplastic cells which increase overall conductivity of breast tumors [30].
Since, hepatic tumor appearance, biochemical and biophysical properties differ for different histopathological stages therefore, influence of these parameters on dielectric properties were evaluated. The factors like free visible spaces, necrosis and gap junctions affect conductivity positively, whereas the mitotic activity of cells affects conductivity negatively [31, 32]. The most prominent finding in moderately-differentiated HCC was increased visible free spaces in hepatic parenchyma which could be due to decreased size of hepatocytes and overall restructuring of hepatic parenchyma. In contrast, no significant increase in visible free space was observed in poorly differentiated HCC however, a significant increase in necrosis was observed compared to normal and moderately-differentiated HCC. Necrosis contributes positively towards the conductivity of the tissue as it results in an increased extracellular fluid. Previous studies have speculated that increased conductivity of tumors is due to an increase in the necrosis [33].
Another factor which is supposed to affect tissue conductivity and relative permittivity is cell to cell intercellular communication [34]. The status of gap junction communication was observed to deteriorate significantly with the advancement in histopathological stages of HCC. The effect of altered distribution of connexion proteins can be observed on gap junction intercellular communication. Reduction in GJIC and impairment of gap junctions should contribute negatively towards conductivity of tumors [35] however, we had observed an increase in conductivity of all type of tumors which suggested higher contribution of free spacing and necrosis than GJIC for determining electric conductivity of these tumors.
The poorly differentiated tumors dielectric spectra is significantly different from the normal liver tissue. Although differences were also observed in case of other histological grades too but these changes were statistically significant only in lower frequency region where error in the measurement due to electrode polarization was much higher. Therefore, data should be read cautiously. Nevertheless, one important point of consideration from the present study is that poorly differentiated liver tumors demonstrated significantly different dielectric spectra compared to normal tissue even in the frequency regions which were having very little contribution of electrode polarization (10 kHz–1 MHz). Previous studies which report no change in conductivity or relative permittivity of liver tumors have not assessed the histological stages of these tumors [36]. Therefore, it appeared that consideration of histological grade was important while investigating dielectric properties of liver tumors.
5. Conclusion
The present study reported changes in dielectric spectra of hepatocellular carcinoma with respect to their histological grading and other biological indicators. Poorly-differentiated tumors had significantly increased electrical conductivity and relative permittivity compared to other histological types. The major limitation of the study was electrode polarization in low-frequency region less than 10 kHz. Hepatocarcinogensis induces several subtle changes not only in the structure of hepatic tissue but also in physiological state of the cells. These changes should be more prominent in low-frequency dielectric spectra. Therefore, future studies should be planned to minimize errors in low-frequency region. Nevertheless, in the present study frequency region above 10 kHz till 1 MHz was free from such errors and demonstrated significant changes in dielectric spectra of poorly-differentiated hepatic tumors which correlated well with biological changes during hepatocarcinogenesis. Study also showed that the changes in dielectric properties of hepatic tumors were sensitive to carcinogenesis-mediated alterations of hepatic parenchyma.
Acknowledgments
The authors gratefully acknowledge the financial assistance provided by Science and Engineering Research Board, DST, INDIA under ECR grant (Grant Number: ECR/2016/000140) for carrying out research work. We sincerely thank Prof. Santhosh Chidangil and Dr Aseefhali Bankapur, Department of Atomic and Molecular Physics, Manipal Academy of Higher Education Manipal for their help and support during this work.
Conflicts of interest
Authors declare that no conflicts of interest exist.