
Abstract
A nanomaterial, a copper-based metal organic framework (Cu-BTC MOF), was prepared by a one-step solvothermal synthesis method and applied for the removal of Pb(II) ions from an aqueous solution via adsorption. The Cu-BTC MOF nanomaterial was characterized via x-ray diffraction, Fourier transform infrared, scanning electron microscopy (SEM), transmission electron microscopy (TEM), energy-dispersive x-ray spectroscopy (EDX), and Brunauer–Emmett–Teller method. TEM and SEM images of the prepared Cu-BTC MOF presented octahedral crystals. Furthermore, EDX spectroscopy showed that the synthesized porous nanomaterial consisted of Cu, O, and C elements. The prepared Cu-BTC MOF was employed as an adsorbent for the removal of Pb(II) ions from an aqueous solution. Adsorption kinetics and adsorption isotherm modeling were conducted in detail. The maximum adsorption capacity values of the Cu-BTC MOF for Pb(II) ions at temperature conditions of 10, 25, and 40 °C were 890.94, 896.04, and 958.37 mg g−1, respectively. The synthesized Cu-BTC MOF showed high distribution coefficient (Kd) values, and it was very effective in extracting Pb(II) ions. In the Pb adsorption process, the molar ratio of Pb adsorption/Cu desorption was found to be close to 1 indicating that ion exchange with Cu ions in the Cu-BTC MOF material occurs and the cation exchange between Pb ions and Cu ions can be considered as a dominant mechanism of the adsorption.
Export citation and abstract BibTeX RIS

Original content from this work may be used under the terms of the Creative Commons Attribution 4.0 licence. Any further distribution of this work must maintain attribution to the author(s) and the title of the work, journal citation and DOI.
1. Introduction
Several pollutants emitted from human industrial and agricultural activities are causing various side effects in the global environment. In particularly, heavy metals are considered one of the most threatening sources of water pollution, and typical heavy metals that cause water pollution such as lead, mercury, cadmium, nickel, and copper are reported to have a density exceeding 5 g cm−3 [1, 2]. The stability, recalcitrance, and bioaccumulation properties of these heavy metals cause serious environmental pollution and ultimately pose a great threat to the ecosystem including humans.
Among them, lead is one of the most toxic elements and has devastating effects on human health, and is known to cause environmental problems by being present almost everywhere, including water, air, soil, and vegetables [2, 3]. The maximum contaminant levels of lead pollutants allowed in drinking water by the World Health Organization (WHO) and the United States Environmental Protection Agency (US EPA) are 50 μg l−1 and 15 μg l−1, respectively [3]. Previous studies have shown that lead attacks the brain and nervous systems, causes intellectual disability and hyperactivity disorder, and may damage multiple organ systems, including kidneys and liver [3–5]. Common symptoms of lead poisoning can result in dizziness, insomnia, anemia, headache, weakness, and death, in severe cases. In industrial activities, lead is commonly used in fields such as printing, photographic materials, explosive production, ceramic and glass manufacturing, metal plating, and finishing, and thus, the management of lead is highly complex. Considering the toxicity and frequency of occurrence of lead, it is necessary to accurately detect its presence and concentration in water to mitigate its adverse effects. Accordingly, considering achieving effective and accurate lead measurements using sensors as an urgent issue, technology development is crucial.
Various processing systems can remove heavy metals from aqueous solutions such as ion exchange, reverse osmosis, electrocoagulation, precipitation, membrane filtration, and electrochemical methods. Compared to these, the adsorption method is still considered to be superior due to its simplicity, efficiency, economy, and environmental friendliness. Several adsorbents such as zeolites, activated carbon, and silica gel have lower efficiencies than metal organic frameworks (MOFs) owing to their low adsorption capacity and small specific surface areas. Thus, it is difficult to remove heavy metals from aqueous systems. Recently, excellent porous nanomaterials have been studied, and their potential for improving the adsorption efficiency for heavy metals while exhibiting superior properties compared to existing adsorbents has been demonstrated [6].
MOFs, which are types of porous polymeric materials, are a new class of materials composed of organic linkers connecting metal ions/clusters. Their crystal structures are more stable and have larger specific surface areas than zeolites, compared with which MOFs have an adjustable matrix and can be simply synthesized. The specific surface areas of MOFs range between 1,000 and 10,000 m2 g−1, values which are larger than those of the traditional porous materials, such as zeolites and activated carbon. Zeolite frameworks and MOF structures produce a flexible and unique breathing phenomenon or a gate-opening effect. Among the various forms of MOFs, Cu3(BTC)2 (also known as HKUST-1), a well-known copper-based MOF, is being intensively studied. HKUST-1 has a three-dimensional square-shaped channel system (1.0 nm × 1.0 nm) and accessible nanocavities [7]. Recently, Kassem et al have reported a two-dimensional Cu-based MOF using a simple surfactant-assisted solvothermal method, confirmed its high potential for reduction of nitro compounds as catalyst [8, 9]. An interesting aspect is that in the Cu-BTC MOF, the coordination unsaturated Cu2+ sites are uniformly distributed. The pore structure of the above Cu-BTC MOF consists of small octahedral cages connected to form two types of large cavities having a cubic–octahedral symmetry. Although it has the disadvantage of being hydrolytically unstable due to the open structure of Cu-based MOF [10], HKUST-1 is known as an attractive material for the removal of various heavy metals [11, 12].
In this study, a porous Cu-BTC MOF was fabricated as an effective adsorbent for the separation of heavy metal ions, and the adsorption capacity and adsorption/desorption characteristics were investigated by applying it to the adsorption of Pb(II) ions in water. The Cu-BTC MOF was synthesized on a laboratory-scale, and its properties were analyzed. The function of the prepared Cu-BTC MOF as an adsorbent was investigated through the adsorption test of Pb(II) ions under various experimental conditions. The adsorption experiment results were applied to adsorption kinetic and adsorption isotherm models to evaluate the adsorption patterns and characteristics, and the maximum adsorption amount was calculated to evaluate the Pb(II) adsorption capacity of the synthesized Cu-BTC MOF. Furthermore, by analyzing desorption amount of Cu ions from the Cu-BTC MOF and physicochemical properties of the material after the Pb(II) adsorption, the changes in it caused by adsorption were examined and its adsorption mechanism was also explored.
2. Materials and methods
2.1. Synthesis of Cu-BTC MOF crystals
A solvothermal synthesis method was used for the synthesis of a Cu-BTC MOF for Pb(II) adsorption. High-purity reagents and solvents were utilized without additional purification. First, 37.5 ml N, N-dimethylformamide (DMF) was placed in a 100-milliliter-capacity Teflon vessel, to which subsequently 1.5 g copper(II) nitrate trihydrate (Cu(NO3)2·3H2O) and 0.75 g benzene-1,3,5-tricarboxylic acid (H3BTC) were added. After they were completely dissolved by stirring for 5 min at room temperature and then, additionally, ultrasonication was performed for 3 min in the previous step of Cu-BTC MOF synthesis to make a homogeneous mixture. The vessel was placed in a stainless-steel autoclave place in a drying oven and heat-treated at a temperature of 75 °C for 24 h. After the heat treatment, the vessel was cooled at room temperature, and the precipitate was washed thrice with DMF using a centrifuge. Subsequently, the washed contents were placed into 50 ml DMF and aged at room temperature for 8 h. Thereafter, the supernatant and the precipitate were separated using a centrifuge and dried in a vacuum oven at 150 °C for 12 h to obtain the Cu-BTC MOF powder, which is a copper-based MOF.
2.2. Analysis of physicochemical properties of synthesized Cu-BTC MOF
X-ray diffraction (XRD, Rigaku D/Max-2500) analysis was performed to investigate the physicochemical properties of the synthesized Cu-BTC MOF, and Fourier transform infrared spectroscopy (FTIR, PerkinElmer) was conducted for analyzing the molecular structure of the components of the synthesized material. Moreover, to investigate the morphological characteristics, size, and components of the material, field emission scanning electron microscopy (FE-SEM, HITACHI S-4300), energy dispersive x-ray spectroscopy (EDS, HITACHI), and transmission electron microscopy (TEM, HITACH HT7700) analyses were conducted. Moreover, the specific surface area of the material was measured using a Brunauer–Emmett–Teller (BET) specific surface area analyzer (Micrometrics ASAP 2020). Furthermore, XRD, FT-IR, and TEM analyses were performed to identify the changes in the physical properties of the Cu-BTC MOF after Pb(II) ion adsorption from water, and the results were compared with those before adsorption, and subsequently evaluated.
2.3. Pb adsorption experiments
To evaluate the performance of the synthesized Cu-BTC MOF as an adsorbent, batch adsorption tests using aqueous Pb(II) ions were conducted. The Pb(II) ion standard solution used in adsorption rate and isothermal adsorption experiments was produced by dissolving lead(II) chloride (PbCl2, 99%, Acros Organics, USA) in deionized water followed by dilution to a concentration of 1,000 mg l−1. Moreover, the standard solution was diluted at a constant concentration and utilized based on the experimental conditions. In the adsorption rate experiments, the initial concentration of Pb(II) ions was set as 200 mg L−1, whereas in the isothermal adsorption experiments, the initial concentration was varied as 5–500 mg l−1. For the batch adsorption experiments, 50 ml Pb(II) ion solution at a constant concentration and 0.01 g adsorbent (synthesized Cu-BTC MOF) were placed in a 50-milliliter-capacity conical centrifuge tube (Falcon, 352070) and subsequently stirred at 180 rpm in a horizontal shaker (versus-8480SF, Vision Scientific Co., Ltd., Korea). In the adsorption rate experiments for determining the adsorption equilibrium time, samples were collected at regular intervals at the internal temperature of the horizontal shaker of 25 °C. In the isothermal adsorption experiments, the adsorption capacity variation with temperature was examined under temperatures of 10 °C, 25 °C, and 40 °C. The collected samples were centrifuged at 3,500 rpm for 5 min using a centrifuge (versus-5500i, Vision Scientific Co., Ltd., Korea), subsequently the supernatant was filtered (0.20-micrometer-polytetrafluoroethylene syringe filter, Advantec, Japan), and the concentration of Pb(II) ions was measured. The Pb(II) concentration was measured by inductively coupled plasma mass spectrometry (ICP-MS 7900, Agilent), and the pH values of the solution before and after the adsorption reaction were measured using a pH meter (Model 420A, Orion).
The adsorbed amount of Pb(II) ions after the adsorption reaction was calculated as follows:

where qt represents the adsorbed amount at time t (mg g−1), C0 is the initial concentration (mg l−1), Ct is the concentration in the solution at time t (mg l−1), V is the volume of the solution (L), and m represents the amount of the adsorbent (g).
2.4. Adsorption kinetics and adsorption isotherm models
For the analysis of the adsorption rate, the adsorbed amount of Pb(II) ions over time was evaluated by employing pseudo-first-order and pseudo-second-order kinetic models. The employed pseudo-first-order kinetic model is as follows [13].

where qe is the adsorbed amount in the equilibrium state (mg g−1), qt is the adsorbed amount at time t (mg g−1), and k1 is the pseudo-first-order rate constant (min−1). Integrating equation (2) under a boundary condition from t = 0 to t and from qt = 0 to qt, the following can be expressed as:

The employed pseudo-second-order kinetic model is as follows [14]:

where k2 is the pseudo-second-order rate constant (g mg−1 min−1). Integrating equation (4) under the boundary condition from t = 0 to t and from qt = 0 to qt is expressed as follows:

Isothermal adsorption experiments were conducted to investigate the maximum adsorption amount and adsorption characteristics of Pb(II) ions, and the results were used in the Langmuir and Freundlich adsorption isotherm models.
The Langmuir model is an adsorption isotherm assuming that monomolecular adsorption occurs at a finite and uniform adsorption point, the same affinity remains unchanged for different adsorbates. Moreover there no interactions between the desorption molecules, and the model is expressed as follows [15]:

where Q° is the maximum adsorption capacity (mg g−1) and bL is the Langmuir constant associated with adsorption energy (L mg−1). Ce represents the equilibrium concentration (mg l−1) in the adsorption equilibrium state and qe represents the equilibrium adsorption amount (mg g−1).
The Freundlich model is an equation that assumes a multimolecular layer adsorption between an adsorbent and an adsorbate, and it is expressed as follows [16]:

where KF is the Freundlich constant (L mg−1) and 1/n is a constant indicating the adsorption strength.
3. Results and discussion
3.1. Physicochemical properties of synthesized Cu-BTC MOF
Figure 1 shows the analysis results obtained by XRD to investigate the crystalline and crystalline diffraction pattern of the synthesized Cu-BTC MOF. In this study, during the XRD analysis, the range of 2θ was set as 5–40°. In the XRD pattern of the Cu-BTC MOF, strong diffraction peaks were shown at 2θ = 6.6, 9.5, 11.6, 13.8, 17.5, 19.2, and 20.4°, which correspond to crystal-plane diffractions of 200, 220, 222, 440, 511, 440, and 600. The XRD pattern of the prepared Cu-BTC MOF was also found to be almost consistent with that of the commercial C300 (BASF, Germany). Therefore, in this study, a Cu-BTC MOF was successfully prepared using the solvothermal synthesis method.

Figure 1. XRD pattern of prepared Cu-BTC MOF.
Download figure:
Standard image High-resolution imageFigure 2 presents the FT-IR results for the molecular structure analysis of the constituent components for the pure Cu-BTC MOF material before the adsorption performance test. A characteristic peak at 727 cm−1 representing the Cu–O vibration mode is observed, indicating that the Cu-based MOF is successfully synthesized. The additional sharp peaks observed at approximately 767 cm−1 and 1370–1600 cm−1 are associated with C–H bending vibration and C=C stretching vibration of benzene rings, respectively. This suggests that the H3BTC linker (organic ligand) is present in the synthesized MOF material. Furthermore, a broad peak occurs at >3000 cm−1, which may be due to the acidic OH of the carboxyl (-COOH) group or crystalline water [17]. These results were found to be almost similar to the FT-IR results for the commercial C300, confirming that the Cu-based MOF material was successfully synthesized.

Figure 2. FT-IR spectrum of prepared Cu-BTC MOF.
Download figure:
Standard image High-resolution imageFigure 3 shows the XPS analysis results, to investigate the chemical state and surface elemental composition of the synthesized Cu-BTC MOF material. Three major peaks were identified for the Cu-BTC MOF material at Cu 2P (932.3 eV), O1s (531.8 eV), and C1s (284.9 eV), respectively [18].

Figure 3. XPS results of prepared Cu-BTC MOF.
Download figure:
Standard image High-resolution imageFigure 4 shows the FE-SEM and FE-TEM analysis results obtained to identify the shape and crystalline size of the synthesized Cu-BTC MOF material. The synthesized material was confirmed to be a crystal with a size distribution in the range of approximately 0.5–5 μm, presenting a single-crystal phase size without an agglomeration effect. Moreover, although the shapes of the particles were irregular, crystals similar to octahedral shapes were synthesized. Figure 5 presents the mapping results for each component element determined by EDX analysis, confirming the composition of the material. The components of the synthesized material consist of C, Cu, and O. The analysis of the physical properties suggests that the MOF material connected with the H3BTC organic ligands based on Cu-based metal clusters are successfully synthesized.

Figure 4. (a) FE-SEM and (b) FE-TEM images of prepared Cu-BTC MOF.
Download figure:
Standard image High-resolution image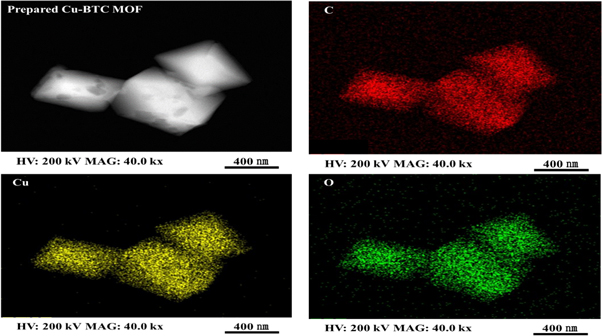
Figure 5. FE-TEM and elemental mapping images of prepared Cu-BTC MOF.
Download figure:
Standard image High-resolution imageTable 1 summarizes the analysis results for the specific surface area, total pore volume, and average pore diameter of the synthesized Cu-BTC MOF material. The specific surface area, total pore volume, and average pore diameter were analyzed to be 1,127 m2 g−1, 0.51 cm3 g−1, and 1.80 nm, respectively.
Table 1. Specific surface area, total pore volume, and average pore size of prepared Cu-BTC MOF.
| Material | Surface Area (m2 g−1) | Total Pore Volume (cm3 g−1) | Average Pore Diameter (nm) |
|---|---|---|---|
| Prepared Cu-BTC MOF | 1,127 | 0.51 | 1.80 |
3.2. Effects of contact and adsorption kinetics
The initial concentration (C0) of the Pb(II) ion solution was set as 200 mg l−1, and the injection amount of the adsorbent (synthesized Cu-BTC MOF) was set as 0.2 g L−1. After conducting the adsorption test at 25 °C, the adsorption amount of Pb(II) ions over time was calculated, and the results are shown in figure 6. In terms of adsorption, the Pb(II) adsorbed amount (q) rapidly increased during the initial 30 min, removing 62.5% Pb(II) compared to the initial concentration at an adsorbed amount of approximately 665 mg g−1. Subsequently, there was a gradual increase in the adsorbed amount, and after 120 min, the adsorption equilibrium was almost reached. Therefore, in the subsequent isothermal adsorption experiment, 120 min was set as the adsorption equilibrium time. In a study by Wang et al [19], the adsorption rate of an NH2-functionalized Zr-MOF rapidly increased in the initial 30 min of Pb(II) adsorption, and the adsorption equilibrium was reached after approximately 120 min [19]. Lin et al explained that this was caused by the rapid movements of heavy metal ions to the MOF owing to the MOF structure being bound with an amino-functional group (NH2 −) at the beginning of adsorption [20]. Following this, the adsorption amount gradually increased over time owing to the slow intra-particular diffusion. In contrast, in this study, the adsorption of Pb(II) ions in Cu-BTC MOF seems to be a result of the fast ion exchange between Cu2+ and Pb2+ or the atomic bonding between the components of the MOF material and Pb2+, instead of the influence of the functional groups [11, 18].

Figure 6. Effects of contact time and kinetic models on adsorption of Pb(II) ions using synthesized Cu-BTC MOF (Initial Pb(II) concentration = 200 mg l−1; Adsorbent dosage = 0.2 g L−1; Adsorption temperature = 25 °C).
Download figure:
Standard image High-resolution imageThe results of using the obtained adsorbed amounts of Pb(II) ions over time in the pseudo-first-order and second-order kinetic models are shown in figure 6 and listed in table 2. The adsorption of Pb(II) by the synthesized Cu-BTC MOF was evaluated to be better suited to the pseudo-second-order kinetic model formula showing a correlation coefficient (R2) of 0.9996 than to the pseudo-first-order kinetic model showing an R2 of 0.5990. The equilibrium adsorbed amount (qe,cal) of 800.49 mg g−1 based on the pseudo-second-order kinetic model was similar to the corresponding experimental value (qe,exp) of 789.88 mg g−1. The adsorption rate constant (k2) based on the pseudo-second-order kinetic model was calculated to be 0.0002 g mg−1 min−1 (table 2). From the comparison of the adsorption experimental and predicted values shown in figure 6, for the pseudo-first-order kinetic model, there is a large difference between the adsorption experimental and predicted values of Pb(II) until the middle of the adsorption reaction. In contrast, the pseudo-second-order kinetic model shows that the experimental and predicted values almost coincide with each other in the entire section.
Table 2. Calculated kinetic model parameters of adsorption of Pb(II) ions using synthesized Cu-BTC MOF.
| Ion | C0 (mg l−1) | qe,exp (mg g−1) | Pseudo-second-order | |||||
|---|---|---|---|---|---|---|---|---|
| qe,cal (mg g−1) | k1 (min−1) | R2 | qe,cal (mg g−1) | k2 (g mg−1 min−1) | R2 | |||
| Pb(II) | 212.78 | 789.88 | 252.67 | 0.0160 | 0.5990 | 800.49 | 0.0002 | 0.9996 |
Figure 7 presents the pH change of the solution after a long-duration adsorption progress. In the case of the Pb(II) solution without the adsorbent (control), the pH was maintained in the range of 5.28–5.31, and when the Cu-BTC MOF material was injected as the adsorbent, the pH tended to decrease after adsorption, showing the pH values of 4.72 at 120 min and 4.56 at 300 min. In this experiment, in the range of pH 4–6, Pb2+ and Pb4(OH)4 4+, ionic species are dominantly present [21], and Pb(OH)2, which is an insoluble species, is not generated at pH 6 and below [19]. Thus, the removal of lead by precipitate formation can be ignored. Furthermore, in the previous study [18] in which Ce3+ was adsorbed using HKUST-1, as the pH of the solution increased from 2 to 6, the removal efficiency and adsorption capacity of Ce3+ increased. Moreover, and as the pH increased, the concentration of Cu2+ in the solution decreased. Thus, HKUST-1 was more stable in a solution at in a neutral pH range (pH = 6). Therefore, the pH range of the Pb(II) solution in this study is a suitable pH range for achieving adsorption performances and stability of Cu-BTC MOF in aqueous systems.

Figure 7. pH of solution after adsorption of Pb(II) ions using synthesized Cu-BTC MOF (Initial Pb(II) concentration = 200 mg l−1; Adsorbent dosage = 0.2 g L−1; Adsorption temperature = 25 °C).
Download figure:
Standard image High-resolution image3.3. Isothermal adsorption versus temperature changes
The isothermal adsorption experiments on Pb(II) ions of the synthesized Cu-BTC MOFs were conducted at temperature conditions of 10 °C, 25 °C, and 40 °C, respectively, and the results were applied to the Langmuir and Freundlich adsorption isotherm models. The isothermal adsorption results of Pb(II) ions for each adsorption temperature condition agree with the model fitted using equations (6) and (7), which are shown in figure 8. The calculated Langmuir and Freundlich isotherm model parameters are summarized in table 3. Based on the comparison results of the adsorbed amount of Pb(II) ions according to the adsorption temperature, the adsorbed amount tended to increase with the temperature. In particular, the increase in the adsorbed amount was large under a temperature condition of 40 °C. From the adsorption isotherm model fitting results, the correlation coefficient (R2) values for Pb(II) ion adsorption versus the temperature condition were 0.9871–0.9915 and 0.4789–0.6509 in the Langmuir and Freundlich models, respectively. These suggest that these data are suited well for the Langmuir adsorption isotherm model. The maximum adsorption capacity (Q°) of Pb(II) ions based on the Langmuir model was calculated to 890.94, 896.04, and 958.37 mg g−1 under temperature conditions of 10, 25, and 40 °C, respectively, and the maximum adsorption capacity (Q°) showed a tendency to increase as the adsorption temperature increased. It has been reported that the adsorption amount increases with increasing temperature, which explains that the adsorption process due to the chemical interaction between metal ions and MOFs is an endothermic reaction [19, 22]. Various MOFs were tested for Pb(II) ion adsorption, and the maximum adsorption capacities for Pb(II) ions reported in previous studies are listed in table 4. The presented MOF material showed a sufficiently applicable level of the performance for the adsorption removal of Pb(II), and in particular, it showed significantly high maximum adsorption capacities (890.94–958.37 mg g−1) in the temperature range of 10 °C–40 °C.

Figure 8. Adsorption isotherm model fitting to adsorption of Pb(II) ions using synthesized Cu-BTC MOF under various temperature conditions of (a) 10 °C, (b) 25 °C, and (c) 40 °C.
Download figure:
Standard image High-resolution imageTable 3. Isotherm model parameters of adsorption of Pb(II) ions using synthesized Cu-BTC MOF.
| Ion | Temp. (°C) | Langmuir model | Freundlich model | ||||
|---|---|---|---|---|---|---|---|
| Q° (mg g−1) | bL (L mg−1) | R2 | KF (L mg−1) | 1/n | R2 | ||
| Pb(II) | 10 | 890.9446 | 0.0538 | 0.9876 | 144.7745 | 0.3216 | 0.4789 |
| 25 | 896.0415 | 0.0559 | 0.9915 | 121.7240 | 0.3701 | 0.5692 | |
| 40 | 958.3700 | 0.0402 | 0.9871 | 82.7345 | 0.4657 | 0.6509 | |
Table 4. Comparison of maximum adsorption capacities of various MOFs for Pb(II) ions using literature data.
| Adsorbents (MOFs) | Metal ion | qmax (Q°, mg g−1) | References |
|---|---|---|---|
| Tb-MOFs | Pb(II) | 547 | [2] |
| Fe doped HKUST-1 MOFs | 565 | [10] | |
| NH2-functionalized Zr-MOFs | 166.74 | [19] | |
| TMU-56 | 1130 | [23] | |
| UiO-66-EDA | 243.90 | [24] | |
| MOF-2 (Cd) | 769.23 | [25] | |
| CoCNSP | 534 | [26] | |
| UiO-66-NH2 | 181.81 | [27] | |
| nFe3O4@MIL-88A(Fe)/APTMS | 536.22 | [28] | |
| UiO-66-NHC(S)NHMe | 232 | [29] | |
| TMU-23 | 434.7 | [30] | |
| Cu-MOFs/Fe3O4 | 219.00 | [31] | |
| HKUST-1 | 819.28 | [32] | |
| Magnetic aminofunctionalized aluminium MOF | 492 | [33] | |
| Amino-functionalized MIL-101(Cr) | 88 | [34] | |
| Cu-BTC MOFs | 890.94–958.37 | This study |
The distribution coefficient (Kd), which represents the ability of an adsorbent at a given concentration, was calculated using equation (8) [35].

where C0 (μg ml−1) and Ce (μg ml−1) represent the initial and equilibrium concentrations, respectively, V (ml) represents the volume of the test solution, and m (g) represents the mass of the adsorbent.
In general, a large Kd value implies effectiveness of the adsorbent in extracting the target substance, and if it is 50,000 or more, it is considered to be effective [36]. Figure 9 presents the Kd values calculated at a given concentration from the results of isothermal adsorption (10, 25, and 40 °C) for Pb(II) ions using the synthesized Cu-BTC MOF. In all three temperature conditions, the Kd value was the largest at the initial concentration of 100 mg l−1, with the largest being above 50,000 (52,000–120,000 ml g−1). A relatively large Kd value was also obtained at an initial concentration of 50 mg l−1 (30,000–82,500 ml g−1), confirming that the Cu-BTC MOF synthesized in this study was effective in adsorbing Pb(II) ions. Furthermore, the Kd value tended to decrease as the temperature increased in the initial concentration range of 50–100 mg l−1. However, the Kd value increased with the temperature increase in the initial concentration range of 210–540 mg l−1. Therefore, these results are consistent with the results of the increase in the maximum adsorption capacity (Q°) with increasing temperature.

Figure 9. Distribution coefficient (Kd) values for Pb(II) extraction using synthesized Cu-BTC MOF at given initial concentrations (temperature condition = (a) 10 °C, (b) 25 °C, (c) 40 °C).
Download figure:
Standard image High-resolution image3.4. Desorption of Cu ions according to Pb adsorption
In order to investigate the desorption of Cu ions from the Cu-BTC MOF during the adsorption of Pb(II) ions, adsorption experiments were conducted with the initial concentrations of Pb(II) ions of 100, 200, and 400 mg l−1. Using inductively coupled plasma mass spectrometry (ICP-MS 7900, Agilent), the initial concentrations of Pb and Cu ions in the solution were measured before adsorption, and the concentrations of Pb and Cu ions in the solution during the adsorption process were measured for each time period. From the measured concentration results, the number of moles (mmol) of adsorbed Pb ions and desorbed Cu ions per amount (g) of adsorbent were calculated. The results are shown in figure 10. During the adsorption process using synthesized Cu-BTC MOF at initial Pb(II) ion concentrations of 100, 200, and 400 mg l−1, the adsorption amounts of Pb were 1.97–2.24, 2.56–2.80, and 2.79–3.00 mmol g−1, and the desorption amounts of Cu were 2.35–2.47, 2.64–2.87, and 2.94–3.01 mmol g−1, respectively. The amount of Pb adsorption and Cu desorption increased as the initial concentration of Pb ions increased, and the molar ratio of Pb adsorption/Cu desorption was found to be close to 1. These results indicate that ion exchange with Cu ions in the Cu-BTC MOF material occurs in the process of Pb adsorption. Consequently, the cation exchange between Pb ions and Cu ions can be considered as a dominant mechanism of the adsorption. Although Cu desorbed from Cu-BTC MOF is also one of the heavy metals, according to the Integrated Risk Information System (IRIS) of the US EPA, the carcinogenic grades of copper and lead are D (not classifiable as to human carcinogenicity) and B2 (probable human carcinogen - based on sufficient evidence of carcinogenicity in animals), respectively, indicating significantly higher toxicity and carcinogenicity of lead [37]. In addition, the WHO's International Agency for Research on Cancer (IARC) ranks lead as high as 2B as a carcinogen [38]. Therefore, Cu-BTC MOF, which has a high lead adsorption capacity, can be considered as an adsorbent for the removal of lead in water. In this study, we actually would like to emphasize that the main adsorption mechanism of lead is stoichiometric ion exchange between lead ions and copper ions.

Figure 10. Comparison of Pb adsorption and Cu desorption during the adsorption process using synthesized Cu-BTC MOF at initial Pb(II) ion concentrations of (a) 100, (b) 200, and (c) 400 mg l−1.
Download figure:
Standard image High-resolution image3.5. Properties of Cu-BTC MOF material after adsorption
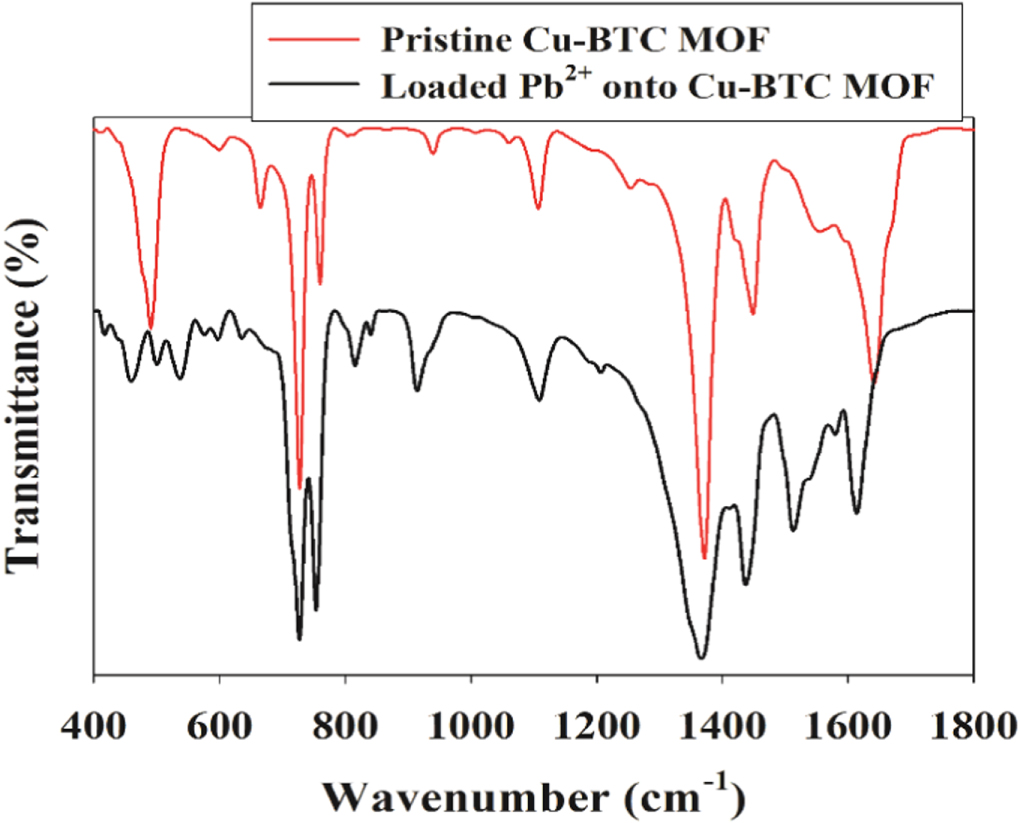
FT-IR, XPS, FE-SEM/EDX, and XRD analysis were performed to investigate the change in the properties of the Cu-BTC MOF material after Pb adsorption. Figure 11 shows the FT-IR results of the molecular structure analysis of the components of the Cu-BTC MOF material after an aqueous Pb(II) ion adsorption experiment. The main peaks were slightly shifted after the adsorption of Pb(II) ions. In addition, the peaks at 727 cm−1 correspond to the Cu-O vibration mode almost disappeared after exposure to the Pb(II) ions, suggesting the hydrolysis of pristine Cu-BTC MOF, which was confirmed by figure 1. Moreover, the peaks at approximately 767 cm−1 and 1370–1600 cm−1 maintained the C–H bending vibration and C=C stretching vibration of the benzene ring, respectively. The above suggests that the H3BTC linker (organic ligand) continuously exists in the MOF material even after the Pb(II) ion adsorption experiment Therefore, these results determined that the destruction of Cu-BTC MOF structure appeared after aqueous Pb(II) ions exposure and the coordination interaction between Pb(II) ions and the free-standing carboxylate group in the ligand of Cu-BTC MOF played an important role in the adsorption process[32].

Figure 11. FT-IR spectrum of synthesized Cu-BTC MOF after adsorption of Pb(II) ions.
Download figure:
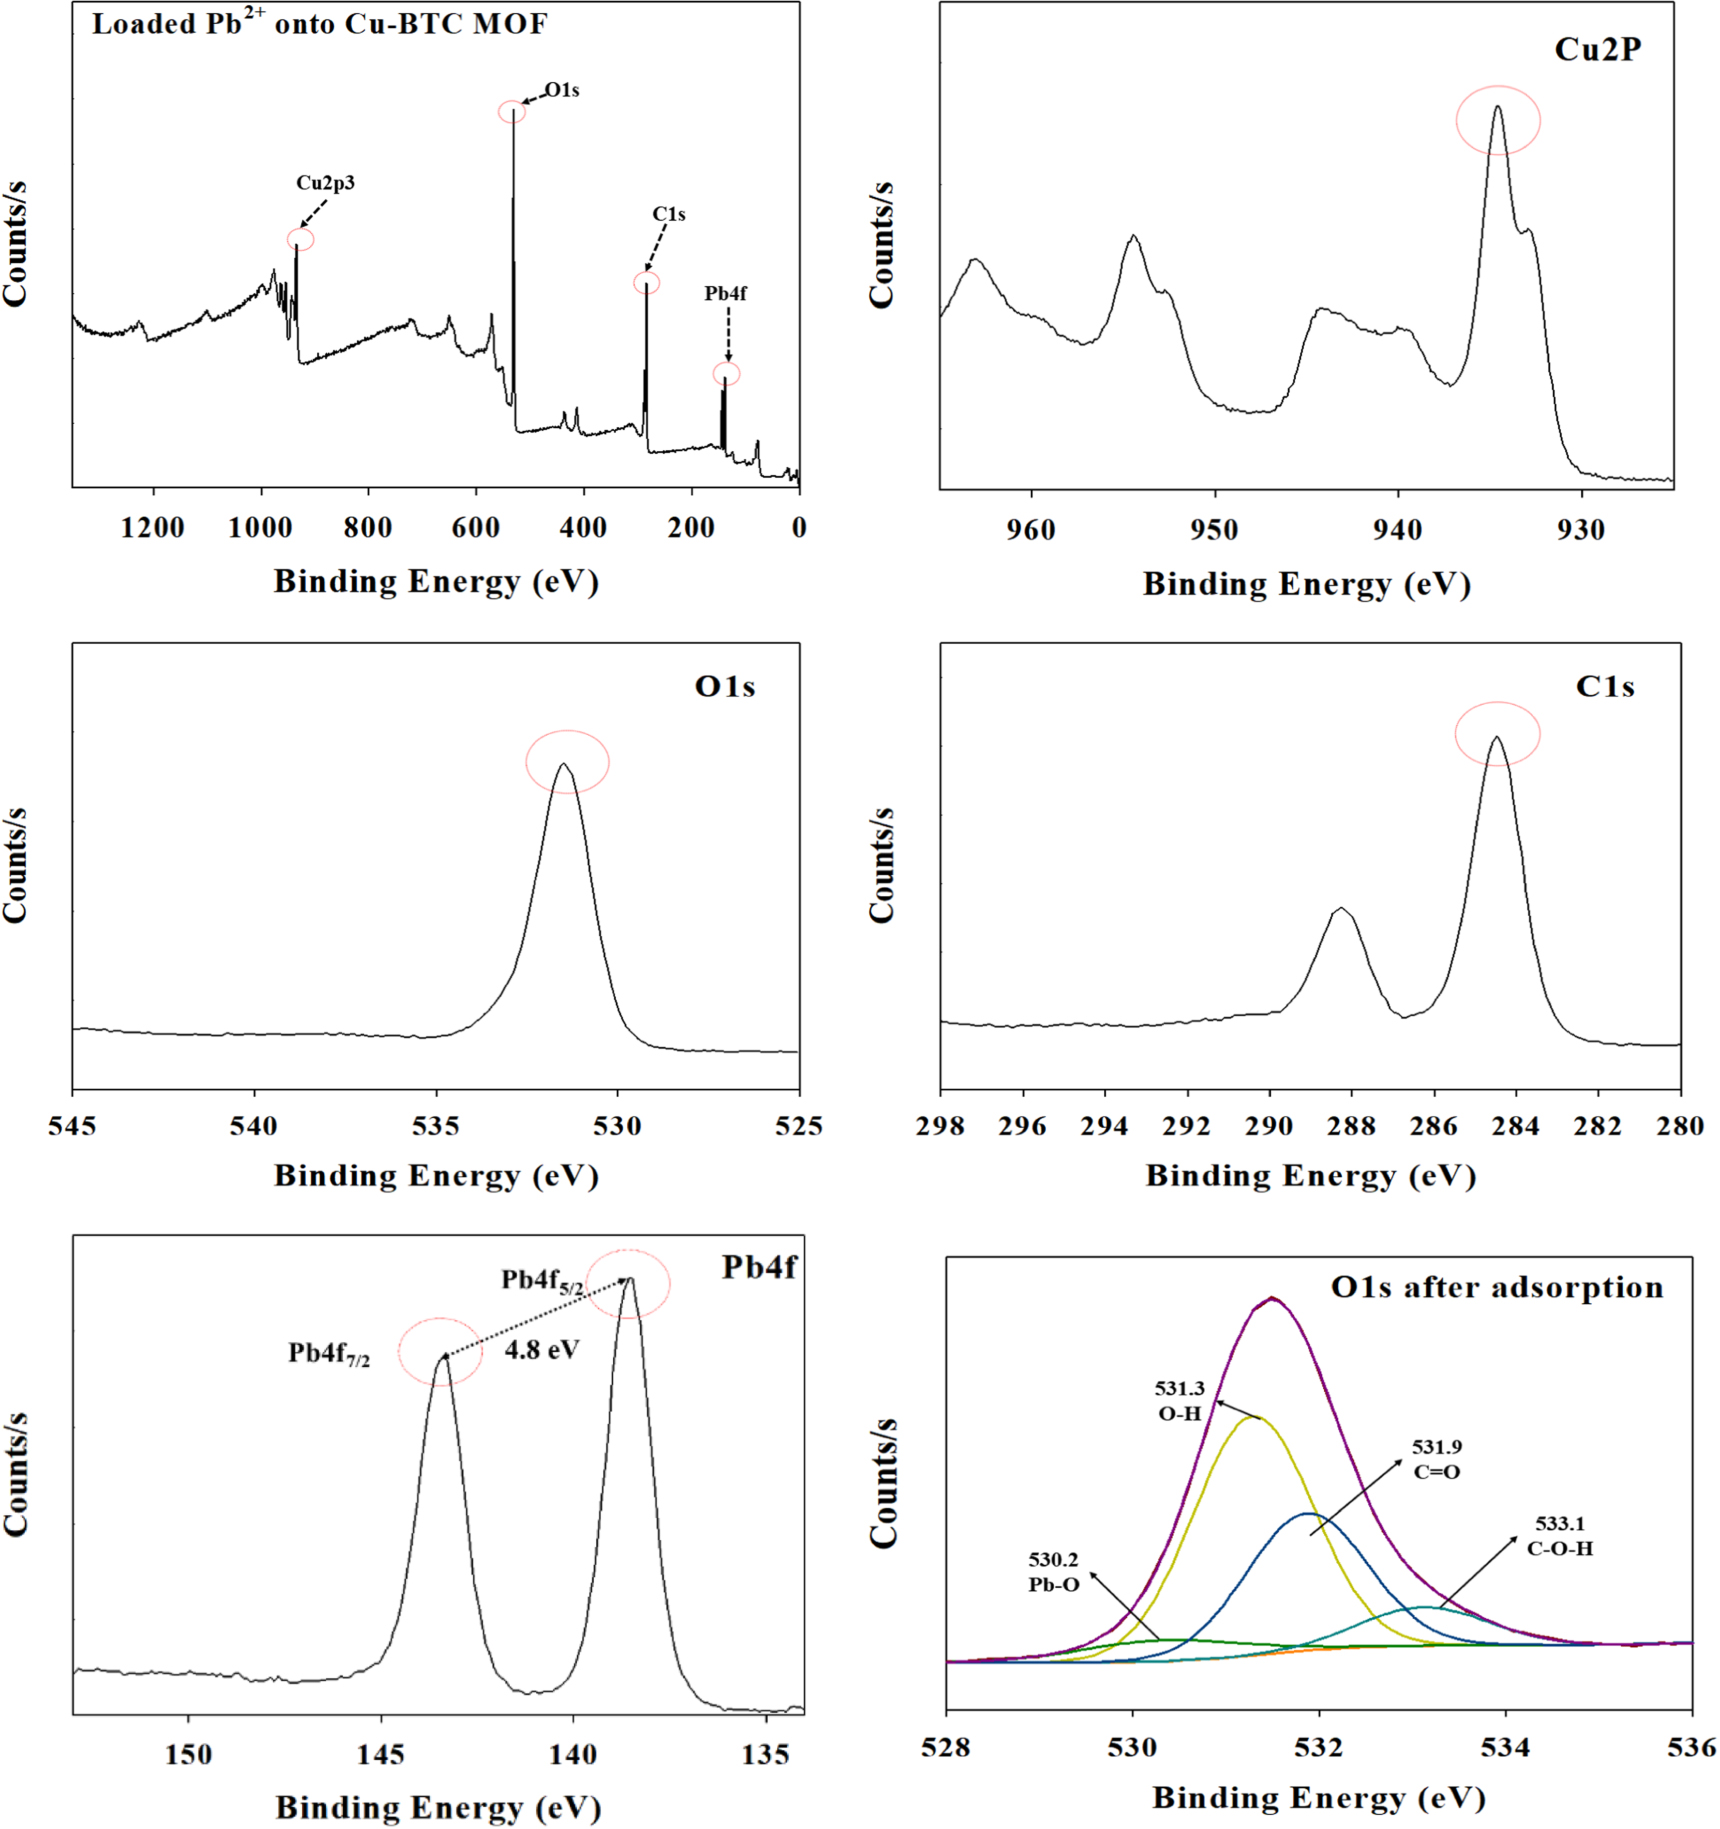
Standard image High-resolution imageThe XPS results on chemical states and surface elemental compositions of the Cu-BTC MOF material after Pb adsorption are shown in figure 12. Three main peaks are identified for the Cu-BTC MOF material: Cu 2P (932.3 eV), O1s (531.8 eV), and C1s (284.9 eV). We could also identify Pb 4f (Pb 4f5/2, 143.3 eV; Pb 4f7/2, 137.5 eV), confirming the adsorption of Pb(II) ions, i.e., the target pollutant. It is the shift of 0.6 eV inhibited the strong affinity between Pb2+ and prepared MOF and the gap of 4.8 eV between Pb 4f5/2 and Pb 4f7/2 confirmed the existence of Pb–O bond [32]. Moreover, the O1s of loaded Pb(II) ions onto prepared MOF presented a peak at 530.2 eV, corresponding to Pb-O. Combining with the results of Cu desorption and FT-IR analysis, it is possible that there is an ion exchange between Pb ions and Cu ions during the adsorption.

Figure 12. XPS patterns of synthesized Cu-BTC MOF after adsorption of Pb(II) ions.
Download figure:
Standard image High-resolution imageFigure 13 presents the FE-SEM/EDS images and XRD pattern results for each element, to confirm the particle shape and composition of the Cu-BTC MOF material after adsorption. Based on the FE-SEM images, it was confirmed that after adsorption of Pb(II) ions, the Cu-BTC MOF material destructed a crystal shape that was close to a rectangular parallelepiped. The pristine Cu-BTC MOF of hexagonal shaped crystals transformed towards rectangular prism crystals during the interaction with the Pb(II) in water are shown. This transformation of Cu-based MOF (HKUST-1) has been described by Goyal et al to occur when octahedral crystals are treated in aqueous solutions for 2 h [10]. Also, figure 13(b) presented the result of XRD on damaged structure of Cu-BTC MOF after Pb(II) exposure to water. The structural change of prepared MOF is due to the presence of the unstable Cu-O bond involved in the paddle-wheel, which hydrolyzes in the presence of an energetically favorable H2O molecule [39]. Furthermore, the absorption of Pb(II) ions with the material components of C, O, and Cu was confirmed from the mapping image for each element.

Figure 13. (a) FE-SEM/EDS images and (b) XRD of synthesized Cu-BTC MOF after adsorption of Pb(II) ions.
Download figure:
Standard image High-resolution image
4. Conclusions
In this study, we synthesized a porous MOF material for the removal of aqueous heavy metal ions and conducted adsorption experiments using Pb(II) ions. A Cu-BTC MOF for aqueous Pb(II) adsorption was successfully synthesized. The synthesized material was identified as a crystal similar to an octahedron with a specific surface area of 1,127 m2 g−1, a pore volume of 0.51 cm3 g−1, and a pore size of 1.80 nm. Moreover, the Cu-based MOF material was confirmed by XPS and FT-IR analyses. Adsorption of Pb(II) ions by the synthesized Cu-BTC MOF over time showed to reach the adsorption equilibrium in 120 min. It was evaluated to be better suited to the pseudo-second-order kinetic model equation through adsorption kinetic model fittings. The isothermal adsorption of Pb(II) ions by the synthesized Cu-BTC MOF was well fitted to the Langmuir model. The Cu-BTC MOF synthesized in this study showed significantly high levels of Pb(II) adsorption capacity (Q0) of 890.94–958.37 mg g−1 in the temperature range of 10 °C–40 °C. Moreover, the maximum adsorption capacity increased as the temperature increased. From the high Kd values, it was confirmed that the synthesized Cu-BTC MOF was very effective in extracting Pb(II) ions. In the Pb adsorption process, the molar ratio of Pb adsorption/Cu desorption was found to be close to 1 indicating that ion exchange with Cu ions in the Cu-BTC MOF material occurs and the cation exchange between Pb ions and Cu ions can be considered as a dominant mechanism of the adsorption. Additionally, the ion exchange between Pb(II) ions and Cu-BTC MOF can be also supported by the XPS and FT-IR analysis results on MOF material after the adsorption.
Acknowledgments
This work was supported by the National Research Foundation of Korea(NRF) grant funded by the Korea government(MSIT) (NRF-2020R1A2C1008597).
Data availability statement
No new data were created or analysed in this study.