
Abstract
Tungsten oxide based gas sensors have attracted a lot of attention in breath acetone analysis due to their potential in clinical diagnosis of diabetes. The major problem with this material in sensor application has been remarkable response to all gases but low selectivity to specific gases. Herein, we report the gas sensing performance of WO3 materials which were synthesized by varying water and ethanol ratios using a facile solvothermal method for acetone detection. The gas sensing properties of as-prepared WO3 were tested on acetone C7H8, NO2, NH3, H2S and CH4 under relative humidity. X-ray diffraction patterns show that as-prepared WO3 samples are mainly composed of monoclinic WO3, a phase having relatively high selectivity to acetone. The as-prepared WO3 sensors produced using 51:49 ratio of water: ethanol show an increase in acetone response as the acetone concentration increases and a decrease in acetone response as the relative humidity increases. The sensor responded to a very low acetone concentration ranging from 0.5 to 4.5 ppm which is normally found in human breath. Furthermore, the sensor exhibited high sensitivity and selectivity to low ppm of acetone at 100 °C. On contrary, the sensor showed significantly lower response to other gases tested.
Export citation and abstract BibTeX RIS

Original content from this work may be used under the terms of the Creative Commons Attribution 4.0 licence. Any further distribution of this work must maintain attribution to the author(s) and the title of the work, journal citation and DOI.
1. Introduction
Tungsten trioxide (WO3), an n-type semiconductor with a band gap ranging from 2.4 and 2.8 eV, chemically stable and with a reasonably high electrical conductivity; has attracted a lot of interest in gas sensing [1–5]. Lately, more research has focused on its remarkable gas sensitivity which makes it an ideal candidate for different gases i.e., acetone, H2S, sulphur dioxide (SO2), CO, ethanol, hydrogen (H2) and NH3 [6–8]. According to literature, WO3 has been reported to exhibit various crystal phases, which includes monoclinic I (γ-WO3), monoclinic II (ε-WO3), and orthorhombic (β-WO3). Among the above, mentioned phases, γ-WO3 is considered a promising phase for detection of acetone, while ε-WO3 has high selectivity to acetone [9–11]. Although ε-WO3 has been reported to have high selectivity [12–14], is also said not to be stable at high temperature [15], and it is usually becomes stable after doping with Cr or incorporating Si into the lattice of WO3 [16].
To achieve desired phases, different efficient methods and techniques such as sol-gel route [17], electrospinning [18], hydrothermal methods [10], chemical vapour deposition [19], physical vapour deposition [20], etc were used. For example, Righettoni et al [13] have reported Si-WO3 nanoparticles synthesises by flame spray pyrolysis. This study reported that annealing play a major role in the formation of various tungsten crystal phases. Furthermore, it is well known that morphology of nanostructured have a great effect on the properties, particularly sensing effect [21]. The control of morphology study has attracted a lot of interest due to desirable properties such as high aspect ratio structure, large surface area, good sensing and optical properties. Additionally, controlling morphology and crystal structure works very well for tungsten oxides as it has various crystal phases which might play a crucial role in achieving desired sensing properties.
With so much great work done in controlling the morphology and crystal structures of materials, there are few works reported on the effect of solvothermal on a low ppm concentration of acetone and low operating temperature. Chen et al [3] reported a solvothermal synthesis of tungsten oxides with various morphologies and their acetone sensing properties at 300 °C. They have found a good response at 100 ppm. Epira et al [22] reported the good acetone performance of TiO2 modified with tungsten species at a working temperature of 200 °C. The low acetone (20 ppm) performance of copper-doped tungsten sensor was reported [18]. Besides the sensor not being pure WO3, the operating temperature was 300 °C. Huang et al [23] found a sensitive acetone flower-like sensor at working temperature of 320 °C, after annealing the sample at 400 °C. All the mentioned great works are however not good enough for potential use in diabetic diagnosis as they report high acetone concentration and at high working temperature.
WO3 is among the transition metal oxides having interesting properties such as high surface areas, portability, low-cost and easiness of use which are promising candidates in the field of breath analysis [24]. In nanomedicine, early diagnosis and monitoring of the diseases is considered a need in the world; especially for diabetes mellitus due to continuous painful pricking [25]. The exhaled human breath has been widely used as a potential alternative for the study and diagnosis of medical conditions [26, 27]. Furthermore, it contains hundreds of VOCs ranging from part-per-trillion (ppt) to part-per-million (ppm) in concentration [28, 29]. These include isoprene, methanol, acetone, and several inorganic gas molecules such as nitrogen oxide (NO), carbon monoxide (CO) and hydrogen sulphide (H2S). Breath acetone has been found to correlate well with blood glucose from diabetic patients [30]. Hence the optimization of WO3 phase composition and sensing performance are crucial for stable and reliable detection of acetone.
Herein we report, without the expensive high-temperature annealing, the facile synthesis of different tungsten crystal phases and morphologies, using solvothermal method. This method allows for change in crystalline phase, which includes monoclinic W18O49, hexagonal WO3, and monoclinic WO3, by varying the solvent composition. Different solvents and water contents were varied in order to change the crystal phase of WO3 from hexagonal to monoclinic. The sensing properties of as-prepared tungsten oxides were examined by measuring the sensor response of main VOCs such as acetone, toluene, and other gases such as hydrogen sulphide (H2S), ammonia (NH3), Nitrogen dioxide (NO2) and methane (CH4). The nanorod synthesised with 49:51 ethanol: water sensor exhibited a high response, and good selectivity to low ppm of acetone at relatively lower operating temperature (100°C). The results indicate that the WO3 based sensors can be very beneficial in designing sensors for detection of acetone in point of care diagnosis.
2. Materials and methods
2.1. Materials
Tungsten hexachloride (wcl6) and 90% ethanol were purchased from Sigma Aldrich and were used without further treatment.
2.2. Synthesis of nanostructured tungsten oxides
This work reports a facile method for synthesis of tungsten oxide nanostructures with varying morphologies such as nanorods, nanocubes, and nanorods mixed nanoparticles as shown in the schematic diagram in figure 1. The process also enables for the change in crystalline phase, such as monoclinic W18O49, hexagonal WO3, and monoclinic WO3, by varying the composition of the solvent. An amount of 4.05 g of tungsten hexachloride was dissolved in 100 ml of ethanol as a stock solution. To prepare the tungsten trioxides nanostructures, an amount of 10 ml of the stock solution was mixed with the following ratios of ethanol and water. Sample 1, named S1 was based on as-purchased ethanol (90% ethanol: 10% water), sample 2 (S2) was 1:9 of water: 90% ethanol translating to ∼18 water content, sample 3 (S3) was 51:49 of water: ethanol and sample 4 (S4) was based on pure D.I water translating to 92% water content. The solution was then transferred to a 100 mL Teflon-lined acid digestion bombs. The reaction was run at 200 °C for 10 h using an electric oven. After, the as-prepared were collected and washed by centrifugation to remove any impurities.
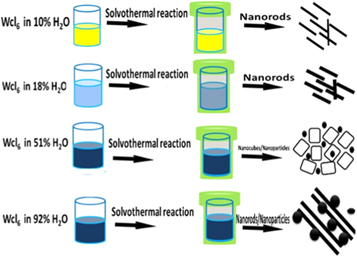
Figure 1. Schematic diagram showing the solvothermal synthesis of W03 nanostructures.
Download figure:
Standard image High-resolution image2.3. Fabrication of sensors and sensing measurements
The sensor device was prepared using the alumina interdigitated electrodes (2 mm x 2 mm) with one sided having pt-electrode and one side having micro-heater that is used for gas sensing measurements. The as-prepared nanostructured powders were dissolved in ethanol to form a paste and drop casted the paste uniformly onto the pt-electrodes of alumina substrate. The impregnated substrate was then heated at 100 °C for 1 h to remove the solvent and for adhesion of the paste. The gas sensing measurement was conducted using a gas sensing station KSGAS6S (KENOSISTEC, Italy). The measurements were tested at 50 °C, 75 °C, 100 °C, 150 °C and 200 °C by changing the voltage. Synthetic air with a constant flow rate of 0.5 l min−1 was used as a carrier gas. The acetone gas was tested at a varying humidity ranging from 0, 10, 20, 40, 60, 80%RH to best suit application in breath acetone detection. Other gases tested includes toluene, nitrogen dioxide, ammonia, hydrogen sulphide and methane. The sensor response was defined as Ra/Rg where Ra is the resistance of the sensor in dry air and Rg is the resistance of the sensor in the target gas.
2.4. Exhaled breath analysis
The Exhaled breath measurements were conducted with the tedlar bag connected to a box which houses WO3 sensor as shown in figure 2. The sensor was connected to the 2 electrode probes (keithley, semiconductor characterization system) for resistivity measurements. Acetone gas was first tested on the sensor to identify the correct voltage for acetone and it was found to be −10 v. Followed by running the acetone gas standards ranging from 0.5, 1.0, 15, 2.0 ppm and diabetic and non-diabetic breath at set voltage of −10 V.
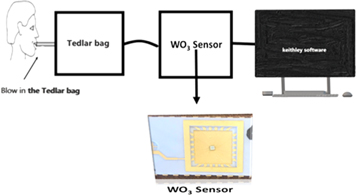
Figure 2. Schematic diagram of breath analysis from a volunteer using tedlar bag for sampling and W03 sensor device.
Download figure:
Standard image High-resolution image3. Results and discussion
3.1. X-ray diffraction
The effect of varying solvent mixing ratios during the synthesis of WO3 samples was examined by x-ray diffraction (XRD). Figure 3 depicts the XRD patterns of the as-prepared tungsten oxides, which show that phase composition and intensities of the reflections from different planes depended on solvent mixing ratio. The diffraction peaks of sample (S1) prepared with ethanol only could be indexed to the standard hexagonal WO3 (JCPDS: 33–1387), and the one (S2) prepared with 82:18 EOH: H2O could be indexed to the standard W18O49, (JCPDS: 05–0392). When the water content was increased in the remaining two samples (S3 and S4), the monoclinic WO3 (JCDPS: 00–0043–1035) was observed. The results observed in here are in agreement with the HRTEM study which is discussed later in the paper. Using the Bragg's equation  where d is the inter-planar-spacing observed on HRTEM images, we found that the
  correlate well on all the samples.
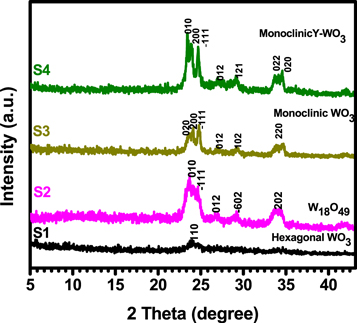
Figure 3. The XRD patterns of the as-prepared WO3 nanostructures obtained after varying solvent content from pure ethanol. The diffraction peaks of sample (S1) prepared with ethanol only compared with the standard hexagonal WO3 (JCPD: 33–1387), the S2 prepared with 9:1 EOH: H2O compared with standard W18O49, (JCPDS: 05–0392) and S3 (1:1 EOH: H2O) and S4 (H2O-only) with increased water content compared to monoclinic WO3 (JCDPS: 00–0043–1035).
Download figure:
Standard image High-resolution imageThe predominance of (010) plane shows that the WO3 nanorods grew along the [010] direction. Furthermore, it can be seen that the (010) plane is parallel with the (020) which corresponds with the layered rods on the scanning electron microscopy micrograph. When the water content increases, we observed the monoclinic WO3 (JCDPS: 00–0043–1035) in both samples with 51:49 and 18:82 (ethanol: water) ratios (see figure 4). The results confirm that the amount of water in the solvent can control the crystallinity of tungsten oxide. It was worth noting that the oxygen which was in water contributed to the formation of tungsten oxides crystalline phases. Furthermore, the crystallite size D of the dominating peak (010) was calculated using Scherer's equation:

Where λ and β are the wavelength of CuKα radiation and the FWHM of the (010) peak. It was noted that the crystallite size D of the material decreases with an increase in water (see table 1). Since Trinh et al [31] highlighted that the metal oxides sensor's response is mainly dependent on the crystallite size of the material of interest being tested. This indicates that as the grain size decreases, there will be an improvement of the gas sensor response to gases. When the grain size is comparable to 2 L (L being the thickness of the layer), D = 2 L a space charge develop in the region of crystallite and maximum response will be achieved.

Figure 4. SEM morphologies of the as-prepared WO3 nanostructures obtained after varying solvent from (a) pure ethanol to (b) 1:9 (ethanol: water), (c) 1:1 (ethanol: water) and (d) pure water.
Download figure:
Standard image High-resolution imageTable 1. Summary of the surface area, crystallite size and dielectric constants.
| Sensor | pwater | Surface area | Pore diameter | Crystallite size |
|---|---|---|---|---|
| S1 | 10 | 73.16 | 4.47 | 11.36 |
| S2 | 18 | 12.35 | 3.61 | 8.02 |
| S3 | 51 | 14.77 | 11.63 | 7.51 |
| S4 | 92 | 70.35 | 4.05 | 7.74 |
3.2. Morphological characterization
The effect of varying solvent mixing ratios on the morphology and microstructure of WO3 were further examined using SEM and HRTEM, respectively. The wet chemical synthesis enables the control of the particle size, shape, and the possibility of large-scale production as compared to the physical synthesis. Tungsten oxide nanostructures having different morphologies of one-dimensional nanostructures, such as nanorods, nanocubes mixed with nanoparticles and nanorods mixed with nanoparticles, were produced by solvothermal process. Figure 4 shows the SEM morphologies of WO3 obtained from samples synthesized by varying the solvent contents. As can be seen from figure 4 that as the content of water in solvent is increased, the shape of the particles changed from rod-like structures in figure 4(a), nanorod-like structures in figure 4(b), a mixture of nanoparticles and cube-like structures in figure 4(c) to a mixture of larger nanorods and nanoparticles in figure 4(d). Thus, samples prepared using high ethanol content produced nanorod-like structures while the ones prepared using high water content cube-like structures, nanorods mixed nanoparticles. As seen from XRD results, SEM observations also confirm that the morphology of WO3 was controlled by varying the compositions of water and ethanol during solvothermal process.
HRTEM morphologies in figures 5(a)–(d) is in good agreement with SEM in figures 5(a)–(d) that when the solvent composition changes, the morphology also changes. Interestingly, the HRTEM micrograph in figure 5(b), indicates that the nanorod grew along the [010] direction, which is also in agreement with the XRD. Moreover, these results show that the composition of the solvents plays a major role in the formation of morphology and crystalline phase of tungsten oxide, like nanorods W18O49, hexagonal rods-like WO3, and nanorods WO3 [32, 33]. HRTEM study also confirmed the crystallite size and different phases as observed with XRD. Using the Bragg's equation, phases were confirmed and the XRD results are found to be in agreement with the HRTEM. The crystallite size of S1, S2, S3, S4 were found to be ∼11.3, 8.0, 7.5 and 7.7, respectively. The crystallite estimation is in accordance with the size calculated using Scherer's equation. As the ratio of water and ethanol is nearly equal, crystallite size decreases and increases when there is nearly pure ethanol and water as a solvent. This trend is also observed on the surface area and XRD analysis. Therefore, the sample produced with nearly equal ratio of water to ethanol is expected to have the highest response to acetone gas as compared to other samples. The gas sensing will be discussed in detail later.
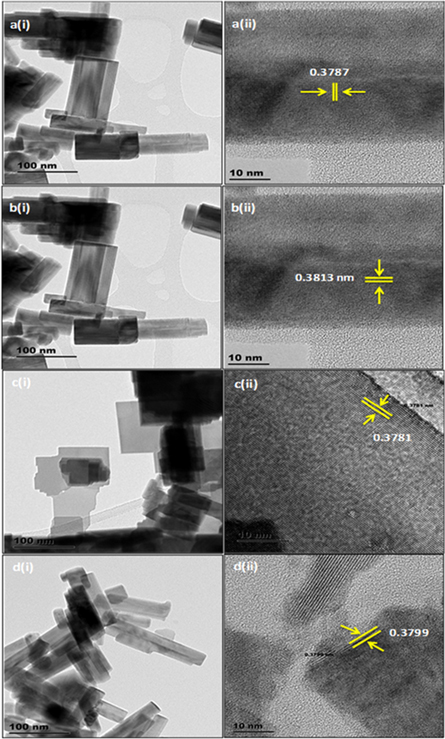
Figure 5. HRTEM morphologies of the as-prepared WO3 nanostructures obtained after varying solvent from (a) pure ethanol to (b) 1:1 (ethanol: water), (c) 1:9 (ethanol: water) and (d) pure water.
Download figure:
Standard image High-resolution image3.3. Proposed growth mechanism-the Wang et al model
From the SEM and HRTEM observations, we have learned that the water in the reaction controls the phase and morphologies of the as-prepared tungsten oxide nanostructures. This is consistent with the mechanism proposed by Wang et al [34] wherein the formation of WO3 takes place, firstly by nucleation and secondly by subsequent growth. For nucleation, the samples prepared in the non-aqueous system, ethanol slowly decompose as illustrated in reaction (1) with simultaneous release of water molecules, which coordinates the W6+ cations to form tungsten oxy/hydroxychloride complexes ([W (OH)xCln]6−(n+x) or [WOyCln]6−(n+2y)). Afterwards, WO3 nuclei are produced along with the condensation/polymerization of the complexes (reaction (2)).


Or

3.4. Proposed growth mechanism-current model
The Wang et al model is good for the reaction of WCl6 with H2O in the absence of ethanol. Also the reaction of WCl6 directly with H2O is energetically expensive. For instance, it requires a lot more energy (ΔH°f (298 K) = −1693 kJ mol−1) to dissociate water into H+ and OH− than dissociate ethanol (ΔH°f (298 K) −178 kJ mol−1) into CH3CH2O− + H+. In accordance with the Kirchhoff's law applied to chemical reactions, one would expect WCl6 to react more with ethanol than with water. Based on simple current-divider model where chemical potential powering a reaction has two pathways running in parallel with enthalpies (or activation energies) of such pathways represented as resistances, it can be shown that one can calculate the relative probabilities of WCl6 reacting with ethanol or water to be 88% or 12% respectively.
This calculation shows that although ethanol is more likely to take charge in the reactions, the WCl6 reaction cannot be entirely trivialized as there is still 12% chance. This analysis explains why the final WO3 produces from the ethanol-water solvent will have phases, composition (stoichiometry) and morphology dependent on the composition of ethanol and water in the said solvent.
3.5. Predicting the properties of ethanol-water mixture/solvent and its effects on the final WO3 morphology
We refer to a classic theory called effective medium theory [35] for us to calculate the properties of the ethanol-water mixture of various compositions of ethanol and water which is presented by equation (3). The dielectric constants are presented in figure 7 against the BET surface and water-ethanol ratios. More details on the effect of solvent ratio on the sensing properties is discussed on section 3.7. For instance we can estimate the water-composition dependency of the dielectric constant of the ethanol-water mixture as follows;

The dielectric constant of water is εwater ∼79 and that of ethanol εethanol ∼25. Given the composition of water, pwater, it is then possible to estimate the effective dielectric constant of the mixture. This can be used to predict other properties of the ethanol-water such as density, reactivity and the like. The effective dielectric constants calculated from this equation are tabulated in table 1 and figure 6, as an illustration and these are correlated with other properties of the finally WO3 materials as will be discussed in later sections.
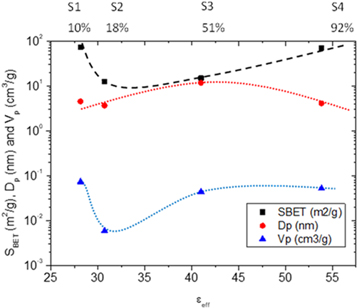
Figure 6. Surface properties of S1, S2, S3, and S4 against the corresponding dielectric constants of the ethanol-water solvents and the water content in the mixture.
Download figure:
Standard image High-resolution image3.6. Brunauer–Emmett–Teller (BET) analysis
The dielectric The BET analyses were conducted to give more insight on the porous nature of WO3 structures and effect of varying solvent mixing ratios. The characteristics such as the surface area, volume and pore size of WO3 nanostructures are summarized in table 1 and S1 (supplementary is available online at stacks.iop.org/MRX/7/035905/mmedia). It has been observed that the surface area increased for sample S1 prepared by nearly pure ethanol and decreased for samples S2 and S3 prepared by 51:49 of ethanol: water ratios, and later increased for sample S4 where nearly only water was used as a solvent. This observation is consistent with the crystallite size observed with XRD and HRTEM. The pore volume decreased with the addition of water, however high pore diameter of about 10.54 nm was observed at a solvent ratio of 51:49 (ethanol: water) as compared to other samples, i.e., sample S3 having the largest value of DP (pore diameter). It may not have the largest SBET (surface area per unit mass) and it may also not have the largest VP (the volume of the pore per unit mass) but the fact that it has the largest Dp suggests that Dp gives it the biggest advantage to sense acetone over the other samples.
Furthermore, the porous structure of the as-synthesised tungsten oxides indicates that there was removal of the solvents and interspaces among the assembled nanorods and particles. These WO3 nanostructures with higher surface areas and porosity play a significant role in the performance of sensing materials. Our results agree very well with the sensing results which will be discussed later. The sample with higher pore diameter showed a higher response and selectivity to acetone as compared to the sample with higher surface area. As it was also observed and mentioned by Tshabalala et al [36], a large surface area alone does not influence the good sensing response, it is however influenced by the porous surface which ultimately allows the gas to be adsorbed into the whole sensing layer, enhancing the response of the sensor.
3.7. Gas sensing properties of WO3 sensors
The sensing performances of WO3 samples synthesized by varying solvent mixing ratios to acetone concentration ranging from 0.5 to 4.5 ppm were investigated at 50, 75, 100, 150 and 200 °C, respectively. As we know, the acetone concentration in human can be 0.8 ppm to lower and for diabetic patients' ranges from above 0.8 ppm. Figures 7(a)–(e) shows the dynamic response curves of the sensors. All the sensors demonstrated an increase in sensors response upon an increase in acetone concentration. This behaviour is common for the semiconducting metal oxides including WO3. It can be described by the kinetics and mechanics of gas adsorption and desorption [37]. Additionally, the n-type semiconductor metal oxides have been proven to have great sensing properties for reducing gases [36].The gas sensing response (R) is defined as:

Where Ra and Rg, represent the resistance of the sensor in dry air and the target gas, respectively.
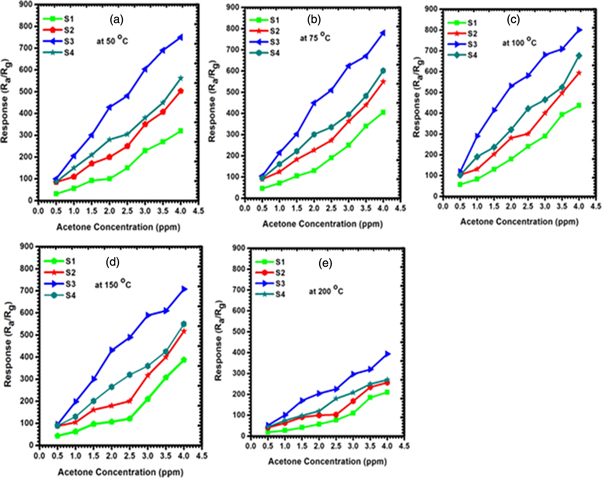
Figure 7. Response versus acetone concentration for samples synthesised with varying solvent composition at (a) 50 °C, (b) 75 °C (c) 100 °C, (d) 150 °C and (e) 200 °C.
Download figure:
Standard image High-resolution imageThe dielectric Sensor S3 showed the highest response to acetone in all temperatures as compared to other sensors. For example, the response of 2 ppm acetone at 50 °C was 1.9, 2.4, 5.3, and 3.42 for S1, S2, S3 and S4, respectively, the response at 100 °C was 172.82, 278.53, 534.93 and 321.05, respectively. In the two mentioned temperatures, the response of S3 was almost double times higher than all the samples. This was also observed in the two remaining temperatures (150 and 200 °C). This could be attributed to the high pore diameter and monoclinic phase. The high pore diameter in this case plays a crucial role as it offers more sites for surface adsorption and desorption of acetone. Interestingly, the results obtained in here are not entirely surprising that the high surface area does not always contribute to excellent sensing response. Tomer et al [38] and Tshabalala et al [36] also observed the same findings. Sample S3 has less surface area as compared to other samples but showed high response in all temperatures.
We observed an increase in sensor response from 50 °C, 75 °C, and 100 °C with the highest respond at 100 °C, and a decrease from 150 °C and 200 °C as shown in figure 8. When the heating temperature is low, the chemical activation of nanoparticles, nanorods and nanoplates can be low and consequently result into a low response. However, increasing the temperature usually leads to a positive chemical activation, with the gas sensor demonstrating maximum response at the operating temperature of 100 °C. This temperature was therefore selected as operating temperature for further investigation in this study. More interestingly, all the sensors could respond to even a low concentration (0.5 ppm). This gives an advantage to the current sensors in an application that requires low concentration detection of acetone especially for diabetes mellitus monitoring and management. As most good performing acetone sensors are achieved at high ppm concentration for example this study [16], the Y-doped SnO2 showed the good acetone performance at 50 ppm.
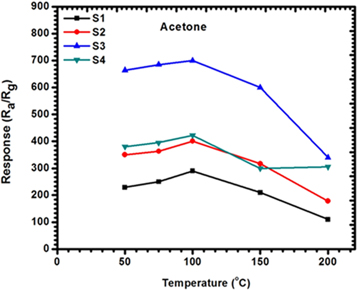
Figure 8. Response of sensor synthesised with varying solvent composition to 2 ppm of acetone at different operating temperatures (50 °C–200 °C).
Download figure:
Standard image High-resolution imageFigure 9 depicts that when S3 sensor is exposed to dry acetone, the response increases with increasing acetone concentration. However, the response to acetone decreased with an increasing RH%. This is attributed to the fact that more sensing sites of the sensor were occupied by a gaseous H2O with the increase of RH%. Therefore, the concentration of chemisorbed oxygen on the sensor will decrease and results in the weakened acetone response. Furthermore, this plot can also clearly distinguish a diabetic patient region and a healthy patient region. The response to dry acetone is 1.3 and for acetone at 60 RH% (ambient relative humidity in human breath) is 0.64 both tested at 1 ppm. The difference in sensor response is 0.66; this makes it possible for the diagnosis and monitoring of diabetes mellitus by using breath acetone.

Figure 9. Sensor (S3) responses to acetone concentration (0–4 ppm) at varying RH from 0 to 60% at 100 °C. Diabetic patient (>1.8) can be clearly distinguished from healthy patients (<0.9) by, at least, 67% difference in sensor response.
Download figure:
Standard image High-resolution imageIn gas sensors, selectivity is one of the key parameter more especially gas sensor for disease detection to ensure correct diagnosis and avoid false positive results. To perform the selectivity test, we used the selectivity (σ) equation [39]:
Where  is the gas of interest and
  is the sum of all gases.
The values for selectivity of the gases against the sensors were calculated from the responses obtained from 2 ppm at 100 °C are presented in table S2 on the supplementary results. The results show that all the sensors select acetone better than any other gases, however, sample S3 showed the highest selectivity. The high sensitivity and response of S3 could be influenced by high pore diameter, small crystallite size and plate-like morphology. It has been reported that the pore diameter can positively influence the sensitivity of the sensor [40–42].
When the values of the morphological properties in table 1 of the final WO3 samples are plotted against the corresponding dielectric constants of the ethanol-water solvents and the water content in the mixture thereof, the profiles as shown in figure 6 are obtained. These profiles suggest that both specific surface area and specific pore volume have similar trajectories with a minimum values between sample 2 and sample 3 whereas specific pore diameter has a definite maximum in sample 3 where the solvent had a water content of 51% and an effective dielectric constant of 42.
We further used selectivity data on table S2 (on supplementary materials) and plotted against all the gases at 2 ppm and 100 °C. As can be seen from figure 10, we observed that acetone shows magnificent selectivity towards acetone in all the sensors as compared to other gases. An ideal sensor should have selectivity of 100% to one gas and 0% to all; however there is a huge gap between an acetone gas and other tested gases. The high selectivity and response of sample S3 could be attributed to small crystallite size, porous morphology and stabilization of ε-WO3 monoclinic phase which has strong interaction force between electric dipole of ε-WO3 and the largest dipole moment of acetone [13, 43]. Furthermore the ε-WO3 phase is best in detecting [7] and selecting acetone. The highest response, excellent selectivity, ability to respond well at varying humidity of the sample S3 which is produced by a very simple and cheap method shows a possibility of future application in breath acetone detection for diabetes mellitus monitoring.
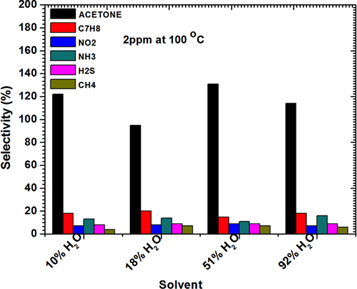
Figure 10. Selectivity values of sensor produces with varying solvent content against varying gases at 100°C at 2 ppm concentration.
Download figure:
Standard image High-resolution imageWe have gathered the gas sensing performances of materials reported in literature and compared it with this present work, the summary is shown in table 2. Among these materials, it can be seen that WO3 (S3 sensor) showed a good response at low operating temperature, without doping or functionalization. Furthermore, this also opens more research scope on non-invasive way of monitoring diabetes mellitus using the breath acetone. This makes it a promising material towards the development of sensors for the detection of acetone.
Table 2. Gas responses of acetone in the present study and those reported in the literatures.
| Material | Fabrication method | Acetone concentration (ppm) | Operating temperature (°C) | Rg/Ra | References |
|---|---|---|---|---|---|
| W03-nanoplates | Topochemical coversation | 1000 | 350 | 9 | [9] |
| WO3-nanoplates | Hydrothermal | 2000 | 307 | 10 | [10] |
| Cr-Wo3 | Flame spray pyrolysis | 1 | 400 | 2.9 | [16] |
| WO3-nanotubes | Electrospinning | 100 | 250 | 40 | [24] |
| Cu-WO3 | Electrospinning | 20 | 300 | 6.4 | [25] |
| WO3 | Solvothermal | 1 | 100 | 131 | This work |
The mechanism of WO3-based gas sensors has been intensively studied and reported in the literature [3, 9, 10, 44, 45]. Gas sensing mechanism of WO3 nanoparticles, nanocubes and nanorods sensors is described as follows:
The change in resistance of tungsten oxide sensors is dependent on the adsorbed oxygen species (O2−, O−) on the surface. Upon their exposure to air, O2− gets adsorbed onto the surface which later adsorbs electrons from the conduction band. This decreases the concentration of electrons in conduction band which ultimately decreases the electrical conductance of the material [46]. This mechanism is expressed as follows:


In the case where the sensor is exposed to acetone gas, the chemisorbed oxygen species (O2− (ads), O2− (ads), O− (ads)) react with acetone vapor and releases electrons back to conduction band and as a results, electrical conductance increases. The reaction mechanism is expressed as follows:


In the current study, the enhanced acetone performance of WO3 indicates that the following parameters played a major role; large pore diameter, high crystallinity, and expedite diffusion channels of WO3 nanorods. WO3 nanorods having pore diameter of about 10 nm and high crystallinity were found have excellent acetone-sensing properties than the WO3 nanoparticles. Since the pore diameter of both nanorods and nanoparticles are mesoporous, gas transport is thought to have occurred through molecular diffusion. This observation is in agreement with the study of Sakai et al, which revealed that gas transport in SnO2 with larger pores occurred mainly through molecular diffusion whereas surface diffusion dominated in micropores. Surface diffusion will have less effect on smaller mesopores [30, 31].
3.8. Breath acetone analysis
Figure 11 shows the resistance curve of sensor S3 at room temperature after injecting acetone standard concentrations of 0.5, 1.0, 1.5, and 2.0 ppm (a), non-diabetic (b) and diabetic breath (c) against standard acetone. As can be seen, the resistance of the sensor decreased from 5.9 to 4.4 MΩ corresponding to 0.802 response as 0.5 ppm acetone concentration was injected, under 0.39 s. For other concentrations such as 1 ppm, the resistance decreased from 5.3 tap 2.8 MΩ corresponding to 1.4 response, for 1.5 ppm the resistance decreased from 5.0 to 2.8 corresponding to 1.7 response. We further analysed non-diabetic and diabetic breath from a volunteer to assess the performance of the sensor. We have found that with the non-diabetic breath, the resistance decreased from 7.5 to 5.9 MΩ which corresponded to 0.66 response and it was well matched with the response from 0.5 ppm acetone gas standard. This results confirms that the sensor can respond to acetone level in the no-diabetic range (0.8 ppm and below). Furthermore, with the diabetic breath, the sensor's resistance decreased from 5.3 to 3.6 MΩ corresponding to 1.09 response. Interestingly this response ranges with the response observed with 1.0 ppm acetone standard. The results confirms that the sensor can respond well to both non-diabetic and diabetic acetone concentration in human breath.

Figure 11. (a) Sensor resistance at room temperature upon exposure to different acetone concentration and non-diabetic (b) and diabetic human breath (c).
Download figure:
Standard image High-resolution image
4. Conclusion
The as-synthesised WO3 composed of nanoparticles, plate-like structures and nanorods were successfully synthesised by varying solvent content using solvothermal method. The sensor fabricated with 51:49 water: ethanol is found to demonstrate high response and good selectivity to 2 ppm level of acetone when compared with the one fabricated with pure ethanol, 18:92 (ethanol: water) and 92% water. However, the sensor exhibited low response under increased relative humidity at 100 °C. Furthermore, the sensor could response to low concentration of acetone ranging from 0.5 to 4.5 ppm of acetone at 100 °C. More interestingly, the sensor could distinguish the healthy region and diabetic region even under high relative humidity. These characteristics could be attributed to their high pore diameter, crystallite phase which consequently played a major role in the adsorption of oxygen species and enhanced the interactions of acetone and WO3 on the surface. The gas sensing performance of WO3 indicates that it has a potential application in low concentration and fast response of acetone detection. These properties are suitable for sensors that can be used for the detection of exhaled acetone from human breath, more specifically in diabetic patients.
Acknowledgments
The authors would like to acknowledge CSIR-DST, project number (HGER85x) for the financial support.