

Abstract
0.5Ba(Zr0.2Ti0.8)O3–0.5(Ba0.7Ca0.3TiO3) nanopowders were synthesized at very low temperature using a soft chemical approach. The synthesized powders and the consolidated disks were structurally characterized thoroughly by XRD, SEM, TEM and EPMA and also by ultraviolet and Raman spectroscopy. The 1350 °C sintered BZT–BCT disk displayed the highest density, underwent diffused phase transition centered at ∼100 °C and showed the highest dielectric constant (8917) and lowest dielectric loss (0.015). The sintered BZT–BCT sample with the highest density showed a maximum polarization (Pmax) of 13 μC cm–2 and remnant polarization of 6 μC cm–2. The same sample exhibited very high electrostrain of ∼0.12% under a relatively low electrical field of 3.5 kV mm−1.
Export citation and abstract BibTeX RIS
1. Introduction
For the past few decades, since the discovery of the important piezoelectric composition lead zirconate titanate (PZT) in 1950, lead (Pb)-based perovskite ceramic materials have been used extensively in piezoelectric and ferroelectric memory device applications because of their large piezoelectric and electromechanical coupling coefficients, as well as their high remnant polarization [1–4]. However, there are certain serious drawbacks associated with using Pb-based piezoelectric materials which include the severe toxicity of Pb and the high vapor pressure of PbO during sintering. Moreover, necessary measures have to be taken during the processing of Pb-based perovskite materials to minimize the formation of an unwanted pyrochlore phase which usually degrades the ferroelectric as well as piezoelectric properties. As a consequence, there is a growing interest in investigating lead-free piezoelectric materials as a possible alternative to the widely used PZT-based ceramics. The search for such alternative materials has resulted in the invention of solid solutions of sodium bismuth titanate (NBT) and tetragonal barium titanate (BaTiO3) near their morphotropic phase boundary (NBT-BT) [5–10], alkali niobates (KNbO3), etc [11, 12]. However, the piezoelectric coefficients (d33) in these materials are considerably lower than those in conventional Pb-based piezoelectric compositions. Very recently, high-performance Pb-free ceramics Ba(Zr0.2Ti0.8)O3–x(Ba0.7Ca0.3)TiO3 [BZT–xBCT], have been reported which show a high piezoelectric coefficient of d33 ∼ 620 pCN−1 at x = 50 [13, 14]. This level of piezoelectricity is comparable to the high-end PZT (d33 = 500–600 pCN−1) and is much higher than the existing Pb-free systems (such as (K, Na)NbO3-based systems, d33 ∼ 250 pCN−1, (Bi, Na)TiO3-based systems, d33 ∼ 200 pCN−1, and BaTiO3-based systems, d33 ∼ 150 pCN−1).
Sol–gel processing offers better homogeneity and a lower phase formation temperature of the desired oxide phase due to the molecular scale mixing in the precursor. The sol–gel processing technique is also cost effective and involves simple processing methodology. There are quite a few reports on bulk BZT–BCT materials synthesized by the sol–gel technique where the piezoelectric properties of BZT–BCT ceramics sintered at 1550 °C are reported [15–18]. Sahoo et al [15] and Tian et al [16] reported only the synthesis and structural characterizations of BZT–BCT nanoparticles obtained by the citrate gel synthesis technique. Electrical properties were not reported in their published work. Venkata S Puli et al [17] reported sol–gel synthesis of BZT–BCT ceramics; however, piezoelectric properties were not reported. Praveen et al [18] first reported dielectric, ferroelectric and piezoelectric properties of sol–gel synthesized BZT–BCT ceramics but the electrical properties were reported for samples sintered at a very high temperature (1550 °C). In the present work, we report the synthesis of piezoelectric [0.5(BaZr0.2Ti0.8O3)-0.5(Ba0.7Ca0.3TiO3)] ceramic by sol–gel processing including its structural, dielectric, ferroelectric and piezoelectric characterization. The precursor sol is synthesized from inexpensive chemical precursors and is stable for months. The synthesized BZT–BCT materials were sintered at considerably lower temperatures (1300°–1400 °C) and piezoelectric properties were measured. In the present communication, we have demonstrated that the sol–gel synthesized BZT–BCT ceramic powders could be sintered at lower temperatures, and considerably higher piezoelectric properties can still be obtained in the low temperature sintered samples. The low temperature sintered sample showed considerably large strain comparable to that of the high-end PZT. Moreover, the simple methodology, ease of fabrication, and the opportunity of using inexpensive precursors coupled with low densification temperature offer enormous flexibility for large scale fabrication of the ceramic material.
2. Experiment
The precursor chemical sol for [0.5(BaZr0.2Ti0.8O3)-0.5(Ba0.7Ca0.3TiO3)] was prepared by the following method. Precursor solutions for Ba and Ca were first made by dissolving stoichiometric amounts of barium carbonate [BaCO3] (purity: 99.9%) and calcium acetate [Ca(CH3COO)2.H2O] (purity: 99%) in glacial acetic acid. Stoichiometric amounts of titanium isopropoxide [Ti(OC3H7)4] (purity: 97.0%) and zirconium propoxide [(CH3CH3CH2O)4 Zr](purity: 98.0%) were slowly added with continuous stirring into iso-propanol containing acetyl acetone stabilizer to obtain Ti- and Zr- precursor. The Ti-Zr sol was then added to the precursor solution containing Ba and Ca ions. The mixed sol was then processed at 70°–80 °C for 30 min with continuous stirring. Finally, a clear yellowish precursor sol was obtained. The precursor sol was converted to gel by controlled hydrolysis with the addition of small amounts of dilute nitric acid. The gel was then dried in an oven followed by calcination at higher temperatures (700°–950 °C).
For the processing of bulk BZT–BCT, the nanocrystalline powders obtained by the chemical synthesis technique described above were pressed into pellets at room temperature using cold isostatic pressing (CIP) and subsequently sintered at 1300°, 1350° and 1400 °C for 4 h in air. The processing of BZT–BCT chemical sol to obtain thin film and ceramic powder is shown in the schematic diagram in figure 1. The relative density of the sintered pellets was estimated by measuring the experimental density using the Archimedes principle. Room temperature x-ray diffraction (XRD) studies on both the powder samples as well as the sintered ones were carried out in a Philips x-ray diffractometer using Cu kα radiation. The powder samples for TEM observation were prepared by dispersing the powder in methanol and adding a few drops of the suspension on a carbon-coated TEM grid. A FEI Tecnai 20T TEM was used for observation. The growth of the particle size of the polycrystalline samples in the pellet (diameter ∼6 mm and thickness ∼1.02 mm) was studied by scanning electron microscopy (SEM). Quantitative elemental analysis of the sintered sample was done by electron probe microanalysis (EPMA) on the Bakelite-mounted, diamond-polished and gold-coated pellet.
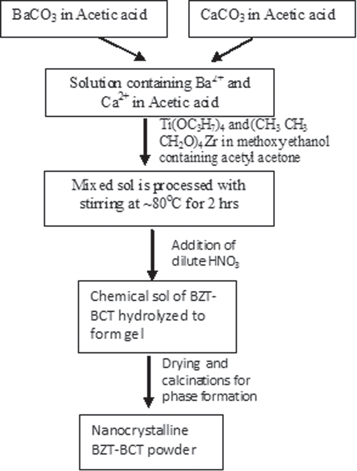
Figure 1. Schematic diagram for the synthesis of nanocrystalline BZT–BCT powder materials.
Download figure:
Standard image High-resolution imageA high temperature automated horizontal dilatometer (Linseis L75HX1600) was used to record the thermal expansion curves for the green and sintered BZT–BCT samples. The samples were heated in air in an alumina sample holder assembly. The system is interfaced to a PC and is designed to automatically measure the percentage of linear change corresponding to the time and temperature of the test sample under controlled heating and cooling rates.
Polarization (P) versus electric field (E) and strain (S) versus (E) measurements were carried out by using aix-ACCT, TF-analyzer 2000 (GmbH) equipped with a high voltage power supply (Trek-663A, GmbH).
3. Results and discussion
3.1. Structural characterization of BZT–BCT nanocrystalline powders
For structural characterization of the BZT–BCT powders, XRD was performed on the powders calcined at different temperatures in air. The XRD results are shown in figure 2.

Figure 2. XRD pattern of BZT–BCT powder samples calcined at different temperatures showing the phase formation.
Download figure:
Standard image High-resolution imageThe XRD patterns of BZT–BCT powder calcined in the temperature range 400°–900 °C are shown in figure 2. XRD characterizations reveal that at lower calcination temperatures (400°–500 °C) dried BZT–BCT gel powders form metal hydroxides and carbonates which then decompose to nanocrystalline metallic oxides at higher temperatures (figure 2(a)) followed by their gradual conversion to the nanocrystalline BZT–BCT phase. This finding is in agreement with the results reported by Wang et al [19]. However, in contrast to the XRD results reported by Wang et al which showed 650 °C to be the initiation temperature for phase formation, in the present work, the phase formation starts at the very low temperature of ∼500 °C. The conversion from the nanocrystalline mixed oxide phase to the crystalline phase is almost completed at 700 °C except for minute amounts of unreacted components indicated by two tiny extra peaks in the XRD patterns (figure 2(b)). However, a fully pure BZT–BCT phase is obtained only at 900 °C. The earlier reports on the synthesis of 0.5BZT-0.5BCT from the respective oxides by the solid state technique [13, 14] revealed the coexistence of tetragonal and rhombohedral phases which are usually indicated by splitting of the (200) and (211) peaks. However, in the present work, the nanocrystalline BZT–BCT powder has been synthesized by the chemical technique and the XRD peaks obtained from the scanning of the nanocrystalline powders are broad where the tetragonal splitting is submerged by the appearance of broad peaks. Therefore, the coexistence of tetragonal and rhombohedral phases has been confirmed from the Raman spectra of the sintered BZT–BCT disk which is discussed in the subsequent sections of the report.
Figure 3(a) shows a TEM image of the nanoparticles in the BZT–BCT powders calcined at 900 °C. The size distribution for most of the nanoparticles is 5–30 nm. However, a few bigger nanoparticle-agglomerates are also present in the distribution. The d-values calculated from the diffraction pattern (figure 3(a), inset) for the (100), (110), (111), (200) and (211) planes match the same calculated from the XRD patterns (figure 2). HRTEM (figure 3(b)) of a BZT–BCT particle shows that the lattice spacing of the (100) plane of a BZT–BCT grain is 2.86 Å.
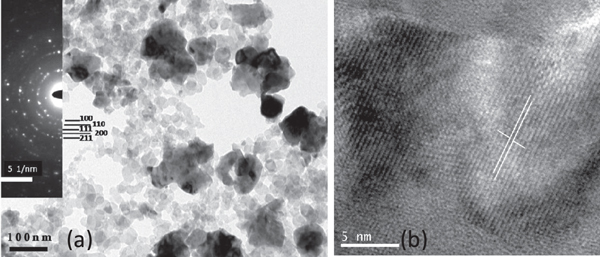
Figure 3. (a) TEM image of the nanoparticles in the BZT–BCT powders calcined at 900 °C with the electron diffraction pattern (inset), and (b) HRTEM of a BZT–BCT nanoparticle.
Download figure:
Standard image High-resolution image3.2. Studies on sinterability of the nanocrystalline BZT–BCT powders
Sinterability of the synthesized nanocrystalline BZT–BCT powders was studied by a dilatometer to identify the suitable sintering temperature for densification. A high temperature automated horizontal dilatometer (Linseis L75HX1600) was used to record the thermal expansion curves for the green and sintered BZT–BCT samples. The samples were heated in air in an alumina sample holder assembly. The system is interfaced to a PC and is designed to automatically measure the percentage of linear change corresponding to time and temperature of the test sample under controlled heating and cooling rates.
Figure 4 shows the typical dilatometric plot of the green disc of the BZT–BCT sample. The sample was heated to 1350 °C with a heating rate of 5 °C min–1. It is observed that significant shrinkage occurred at ∼1050 °C, which is indicated by the initiation of a sharp slope change at this temperature. Up to 1350 °C, ∼1.1 mm (∼10%) shrinkage is observed, which is quite reasonable to achieve a good densification at this temperature.

Figure 4. Typical shrinkage behavior for one of the green compacts of the BZT–BCT sample.
Download figure:
Standard image High-resolution image3.3. Consolidation and structural characterization of dense BZT–BCT materials
For densification, green pellets made from calcined BZT–BCT powders by CIP were sintered at different temperatures in air. Following the results of the dilatometric study the green pellets were sintered at 1300 °C, 1350 °C and 1400 °C in air for 4 h. The relative densities of the sintered samples were measured by the Archimedes principle. The relative densities of the samples sintered at 1300 °C, 1350 °C and 1400 °C were found to be 94.2%, 94.5% and 93.6%, respectively. The decrease in relative density for the sample sintered at 1400 °C can be attributed to the loss of barium (Ba) at high temperatures which reduced the bulk density of the sample. To observe the microstructure of the grains and the grain growth, SEM micrographs of the fractured surface of the 1350 °C sintered sample were recorded and one of the micrographs is shown in figure 5. BZT–BCT grains with grain sizes ranging from 5–25 μm are visible in the microstructure.

Figure 5. SEM micrograph of the fractured surface of 1350 °C sintered BZT–BCT sample.
Download figure:
Standard image High-resolution imageFigure 6(a) shows the XRD patterns of the BZT–BCT pellet sintered at 1350 °C in air for 4 h indicating the presence of single phase polycrystalline BZT–BCT. From the XRD pattern it can be concluded that stoichiometry in the sample remains almost unchanged even at high sintering temperature, though there might be marginal loss of Ba due to high temperature evaporation of BaO. The splitting of the (200) peak indicates the coexistence of rhombohedral (R3m) and tetragonal phase (P4mm) in the sintered sample. Similar observations have also been reported by other researchers [13, 15, 20, 21].
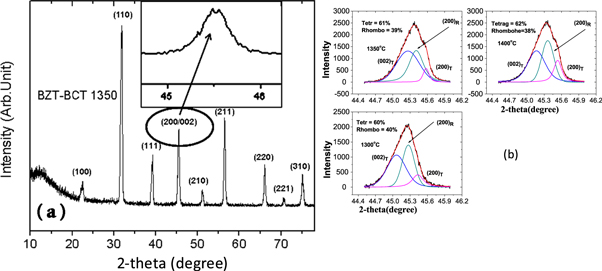
Figure 6. (a) XRD patterns of the BZT–BCT pellet sintered at 1350 °C in air for 4 h. The inset shows the peak splitting of the (200) peak. (b) Slow scan XRD plots in the range: 44.5°–46° of 2θ with peak deconvolution.
Download figure:
Standard image High-resolution imageHowever, splitting of the peaks is not always observed in the sintered BZT–BCT samples. For example, splitting of the (200) peak was not apparent for the samples BZT–BCT 1300 and BZT–BCT 1400. Hence, XRD slow scans were performed in the 2θ range 44.5°–46° for the three sintered samples and the results are plotted in figure 6(b). The broad asymmetric peaks were deconvoluted into tetragonal and rhombohedral peaks using Gaussian fitting [22]. The tetragonal volume fraction was calculated using the formula:

where, Irh(200) is the integral intensity of the rhombohedral (200) reflection, and Itr(002) and Itr(200) are the integral intensities of the tetragonal (002) and (200) reflections, respectively [23, 24]. Occurrence of both phases signifies crystallization of BZT–BCT in the morphotropic phase boundary regions.
3.3.1. Spectroscopic characterization
The existence of the tetragonal phase is also confirmed by the Raman spectra recorded on the sintered samples. Raman spectra are an important spectroscopic tool effectively used by several groups of researchers to characterize the tetragonal phase in the presence of the cubic phase in different ceramics e.g. ZrO2, BaTiO3. The existing non-centrosymmetry in the tetragonal phase is believed to be the reason for the occurrence of multiple Raman active nodes [19]. The Raman spectra of the samples (figure 7) show four bands at 162 (band-1), 305 (band-2), 520 (band-3) and 726 cm−1 (band-4) among which the band at 162 cm−1 usually observed in the rhombohedral phase of nanocrystalline BaTiO3 [22, 25]. The band at 305 cm−1 is the signature of the tetragonal phase of BZT–BCT [19]. The band at 726 cm−1 also signifies the presence of the tetragonal phase of BZT–BCT whereas the band at 520 cm−1 can be attributed to both cubic and tetragonal barium titanate (BaTiO3) (pure and substituted BaTiO3).

Figure 7. Raman spectra of the BZT–BCT samples sintered at 1350 and 1400 °C.
Download figure:
Standard image High-resolution image3.3.2. Detection of elemental concentration in the sintered pellet by EPMA
Although the chemicals are added in the stoichiometric ratio, BaO usually evaporates at higher sintering temperatures and the stoichiometry could be lost in the pellets sintered at higher temperatures. Hence, electron probe microanalysis (EPMA) was performed on the polished sintered pellets for quantitative estimation of the elements in the sintered samples. Microanalysis data were acquired on 15 arbitrary points on the polished and gold-coated sample. The results obtained from a 1350 °C sintered sample are plotted and shown in figure 8(a). The results indicate the existence of a very good homogeneity in the sintered sample with respect to the elements present throughout the sample, although the figure shows little variation in the line plots. The very small variation in concentration at different points is as expected and usually occurs in samples that are not polished perfectly to yield microscopic flat surfaces. These variations are well within the error limit of EPMA quantitative measurements. The EPMA line scans for the same sample show the variation of elemental concentration in counts with the scanning distance (figure 8(b)). The line scans also show small variations in elemental concentration with scanning distance.

Figure 8. (a) Variation of elemental concentration at different points of a sintered pellet, and (b) EPMA line scan for the elements present in the BZT–BCT sintered sample.
Download figure:
Standard image High-resolution image3.4. Typical dilatometric behavior of sintered sample
The tetragonal to cubic transition was determined by heating the sintered BZT–BCT sample (sintered at 1350 °C) in a dilatometer and the corresponding curve is shown in figure 9. The plot clearly indicates the tetragonal to cubic phase transformation as we pass through the Curie temperature (∼100 °C). Also, a broad transition was observed. The phase transition appears to be broad because the change in lattice parameters starts from a low temperature and the same takes place within a broad region of temperature. The values of Tc obtained from both dilatometric heating and the dielectric study (discussed in the next section) of the sintered samples are observed to be in good agreement with each other.
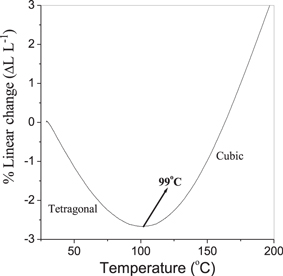
Figure 9. Typical dilatometric plot of sintered BZT–BCT sample showing the tetragonal–cubic phase transition.
Download figure:
Standard image High-resolution image3.5. Electrical characterization of the sintered BZT–BCT disks
3.5.1. Dielectric characterization
Figure 10 shows the temperature dependence of the dielectric constant (εr) and dielectric loss (tanδ) at different frequencies of the BZT–BCT ceramic samples, sintered at (a) 1300 °C, (b) 1350 °C and (c) 1400 °C respectively. All samples show a relatively broad peak in the dielectric constant around the phase transition temperature (Tc) (figure 10) which is typical for relaxor ferroelectrics or ferroelectrics with a diffuse phase transition [26, 27]. Values of εr and tanδ of the BZT–BCT ceramic samples, sintered at different temperatures, are given in table 1. In all the BZT–BCT ceramic samples, εr increases with the increase of temperature and reaches maximum (εmax) in the tetragonal–cubic phase transition region. The εr-T spectra of the BZT–BCT samples show two anomalies, one at the region of Ts and another at the region of Tc. These anomalies can be attributed to occurrence of different phase transitions in the BZT–BCT system [28]. The first broad phase transition at ∼50 °C corresponds to the rhombohedral–tetragonal (TR–T) and the second broad phase transition at ∼100 °C corresponds to tetragonal–cubic (TT–C) transitions, respectively.

Figure 10. Dielectric spectra of BZT–BCT ceramics sintered at (a) 1300 °C, (b) 1350 °C and (c) 1400 °C.
Download figure:
Standard image High-resolution imageTable 1. Dielectric properties of the sintered BZT–BCT ceramic samples.
| Sample | εr(25 °C) at 1 kHz | εm at 1 kHz | loss (25 °C) at 1 kHz | Center of TR–T (°C) | Center of TT–C (°C) |
|---|---|---|---|---|---|
| BZT–BCT 1300 | 1813 | 4022 | 0.03 | 46 | 95 |
| BZT–BCT 1350 | 2400 | 8917 | 0.015 | 58 | 100 |
| BZT–BCT 1400 | 2097 | 8315 | 0.02 | 52 | 101 |
From the figures it is observed that tetragonal–cubic transition regions for the BZT–BCT ceramic samples are shifted to higher temperatures with the increase of sintering temperature. With the increase of internal stress in a ferroelectric material, its free energy increases and the Curie temperature decreases. Generally, internal stress in a ceramic can be relieved by porosity or grain-boundary sliding [29]. If internal stress is relieved by pores, the lower density ceramics should have a higher Tc than that of dense ceramics. Internal stress of the dense ceramics is mainly relieved by grain-boundary sliding. Thus, the dense ceramics with fine grains should have higher Tc than those of the coarse grains. This suggests that in the present study the effect of relieving of internal stress by grain-boundary sliding is dominant. Therefore, the increment of Tc with the increase of sintering temperature of the BZT–BCT ceramic samples can be associated with the relieving of internal stress by grain-boundary sliding. Both at RT and at the center of the broad TT–C (analogous to the Tc of the normal ferroelectric materials) BZT–BCT ceramic samples sintered at 1350 °C showed highest εr and lowest dielectric loss, which suggests about the optimized sintering conditions.
Diffuse phase transitions (DPTs) take place in the ferroelectric materials where microscopic inhomogeneity leads to composition fluctuations. The microscopic regions with slightly different compositions have similar but slightly different Curie temperatures resulting a diffused phase transition. Smolenskii and Rolov [30, 31] believed that Curie temperatures of different microscopic regions have a Gaussian distribution around some average Tc. However, in the present case, for the BZT–BCT samples, there is no frequency dispersion in transition temperature Tc indicating a non-relaxor type composition.
It is known that for normal ferroelectric materials, above the Tc, variation of dielectric constant with temperature follows Curie–Weiss law:

where T0 is the Curie–Weiss temperature and C is the Curie–Weiss constant. The plots of the inverse dielectric constant versus temperature at 10 kHz for BZT–BCT 1300 and BZT–BCT 1350 in the high temperature regions are shown in figure 11(a). The extrapolation of the linear fittings in the high temperature regions shows that linearity of the plot is good except in a narrow temperature range above Tc (region close to the phase transition) and hence it can be concluded that dielectric behavior doesn't completely follow the Curie–Weiss law at temperatures above the critical point (Tc). The temperatures (Tcw) from which the dielectric behavior shows departure from the Curie–Weiss law, for BZT–BCT 1300, BZT–BCT 1350 and BZT–BCT 1400, are given in table 2.

Figure 11. (a) Variation of inverse permittivity as a function of temperature and (b) plot of ln(1/εr − 1/εrmax) versus ln(T − Tmax).
Download figure:
Standard image High-resolution imageTable 2. The temperatures (Tcw) from which the dielectric behavior shows departure from the Curie–Weiss law and diffuseness parameters (γ) for the sintered BZT–BCT samples.
| Sample | Tcw(°C) at 1 kHz | Tcw(°C) at 10 kHz | Tcw(°C) at 10 kHz | γ at 1 kHz | γ at 10 kHz | γ at 100 kHz |
|---|---|---|---|---|---|---|
| BZT–BCT 1300 | 117 | 119 | 118 | 1.75 | 1.77 | 1.77 |
| BZT–BCT 1350 | 123 | 123 | 122 | 1.51 | 1.53 | 1.54 |
| BZT–BCT 1400 | 119 | 120 | 119 | 2.02 | 2.11 | 2.05 |
Uchino and Nomura [32], in their published work on diffused phase transition of PbMgNbO3 and PbZnNbO3, attempted to fit the experimental data for variation of the dielectric constant with temperature above phase transition temperatures with different equations derived from a modified form of the Curie–Weiss law.
They attempted to fit the experimental data to the following quadratic law:

(assuming Curie temperatures of different microscopic regions have a Gaussian distribution around some average Tc in a diffused phase transition).
Here εr is the dielectric constant, εr max is the maximum dielectric constant at Tmax and σ is the standard deviation of the Gaussian function. Uchino and Nomura observed that the plot of reciprocal permittivity as a function of (T − Tmax)2 deviated remarkably from a straight line in the temperature range near the averaged Curie point (T − Tmax < 30 °C) and did not deviate in the higher temperature range. A similar phenomenon has also been observed in figure 11(a) where reciprocal permittivity is plotted as a function of (T − Tmax) for the BZT–BCT samples. Based on their observation Uchino and Nomura [32] tried to establish an empirical equation that could explain the real phenomenon. They determined that the equation

may provide the best fit to the experimental results. Here C is the Curie–Weiss constant and γ is the critical exponent. Uchino and Nomura concluded that this generalized equation would work not only for relaxor ferroelectrics but also for ferroelectrics with sharp or diffused phase transitions. The critical exponent γ = 1 for a classical Curie–Weiss ferroelectric and γ = 2 for a system with a completely diffused transition.
Therefore, the diffuseness in the phase transition for the BZT–BCT samples was measured following equation (4) as developed by Uchino and Nomura. The deviation from the Curie–Weiss law is measured by fitting the εr − T curve at the temperature range of T > Tmax with equation (4). In figure 11(b), ln(1/εr − 1/εrmax) is plotted as a function of ln(T − Tmax) and the slope of the straight line fitted to the logarithmic plot gives the value of γ. For the present samples the values of γ at three different frequencies are given in table 2. For BZT–BCT 1300 and BZT–BCT 1350 the values of γ are ∼1.75 and ∼1.5 respectively indicating partially diffused phase transition. However, for BZT–BCT 1400 the value of γ is ∼2.0 which indicates completely diffused phase transition. The higher value of γ for BZT–BCT 1400 could be attributed to the inhomogeneity developed due to evaporation of Ba at higher sintering temperature and this finding is concurrent with the conclusion made by L E Cross et al [26, 27], who believed that microscopic inhomogeneity leads to diffuseness in phase transition.
3.5.2. Ferroelectric and piezoelectric characterizations
Figure 12(a) shows the typical polarization (P) versus electric field (E) hysteresis loop for a BZT–BCT sample sintered at 1350 °C. Since samples sintered at 1350 °C showed the best dielectric properties, measurements of ferroelectric and piezoelectric properties were performed on this sample. The maximum polarization (Pmax) and remnant polarization (Pr) values observed for the sample are 13 μC cm–2 and 6 μC cm–2, respectively. This level of polarization can be compared to the polarization data reported by Venkata S Puli et al [17], who obtained remnant polarization of 3–6 μC cm–2 for their BZT–BCT ceramic samples synthesized by the sol–gel technique. In figure 12(b) unipolar strain versus electrical field up to 3.5 kV mm−1 was plotted at a frequency of 1 Hz for a poled BZT–BCT sample. The sample exhibits electrostrain of ∼0.12% and the level of strain is higher than that observed in ultrasoft PZT-5H, undoped PZT and PZT-4 [13]. The level of electrostrain (0.12%) shown by the 1350 °C sintered BZT–BCT sample is somewhat lower than that (0.15%) reported by Praveen et al [18] for the sol–gel synthesized BZT–BCT of the same composition but sintered at much higher temperature (1550 °C). Figure 12(c) shows the unipolar strain loop for the poled BZT–BCT ceramics measured up to 0.5 kV mm−1 and at a frequency of 1 Hz. A maximum strain of 0.0375% is obtained under a relatively low electrical field of 0.5 kV mm−1. The converse piezoelectric coefficient (d33) is measured from the ratio of the maximum strain to peak electric field Smax/Emax, which was found to be 648 pm V−1. The large strain and high converse piezoelectric coefficient measured at such low electric field clearly shows the soft elastic nature of the BZT–BCT crystal lattice [15].

Figure 12. (a) P versus E hysteresis loop, (b) strain versus E curve for BZT–BCT up to 3.5 kV mm−1, and (c) plot of strain versus E for BZT–BCT up to 0.5 kV mm−1.
Download figure:
Standard image High-resolution image
4. Conclusion
BZT–BCT bulk and thin film materials were successfully prepared from a stable chemically synthesized sol. Phase formation of BZT–BCT commenced at ∼500 °C and a fully single phase structure was obtained at 900 °C. Characterization by XRD and Raman spectroscopy of the sintered pellet showed a mixture of rhombohedral and tetragonal phases. BZT–BCT ceramic samples sintered at 1350 °C showed the highest εr (8917) and lowest dielectric loss (0.015). The phase transition temperature of the BZT–BCT ceramic samples increases with the increase of sintering temperatures. The maximum polarization (Pmax) and remnant polarization (Pr) observed for a sintered BZT–BCT ceramic are 13 μC cm–2 and 6 μC cm–2 respectively. The sintered BZT–BCT ceramic exhibits an electrostrain of ∼0.12% and the level of strain was found to be higher than that observed in ultrasoft PZT-5H, undoped PZT and PZT-4.
Acknowledgments
The authors acknowledge financial support from the Defence Research Development Organization (DMRL), Ministry of Defence, New Delhi, for carrying out the present work and thank the Director of DMRL for his constant encouragement. The authors also wish to thank Dr Abhay Kumar, Scientist, DMRL, for his help with dilatometric characterization. The help of Dr A K Sing and Dr P Ghosal, Scientists, DMRL, in XRD and SEM is gratefully acknowledged.