


ABSTRACT
Highest resolution observations made with the new 1.6 m aperture solar telescope in Big Bear Solar Observatory during this time of historic inactivity on the Sun reveal new insights into the small-scale dynamics of the Sun's photosphere. The telescope's unprecedented resolution enabled us to observe that the smallest scale photospheric magnetic field seems to come in isolated points in the dark intergranular lanes, rather than the predicted continuous sheets confined to the lanes, and the unexpected longevity of the bright points implies a deeper anchoring than predicted. Further, we demonstrated for the first time that the photospheric plasma motion and magnetic fields are in equipartition over a wide dynamic range, and both cascade energy to ever-smaller scales according to classical Kolmogorov turbulence theory. Finally, we discovered tiny jet-like features originating in the dark lanes that surround the ubiquitous granules that characterize the solar surface.
Export citation and abstract BibTeX RIS
1. INTRODUCTION
The 1.6 m clear aperture new solar telescope (NST) in Big Bear Solar Observatory has begun scientific observations (for NST technical details, see Goode et al. 2010, or http://www.bbso.njit.edu/nst_project.html). The NST is the first of a new generation of large aperture, high-resolution solar telescopes. Its off-axis design eliminates obscuration in the path of the sunlight—an essential advantage in high-resolution observations for distinguishing low-contrast features on the Sun.
Sunshine comes from the narrow, turbulent photospheric region, which is dynamically characterized by the upflow of hot convective cells called granules and the horizontal turbulent motion of the solar granular velocity field sweeping the magnetic field uplifted by individual granules into the dark, cool, narrow, downflowing lanes between the granules. The photosphere is the complicated region in which the pressure of turbulent convection, which controls beneath, ceases to dominate the pressure of the magnetic field that controls above.
2. OBSERVATIONS
The results presented here come from two data sets both taken at disk center with the NST with a pixel size of 0 034. The first set was taken with a broadband TiO filter (centered at a wavelength of 705.7 nm, with a bandpass of 1 nm), which highlights small-scale photospheric features. This set consists of 120 speckle reconstructed images obtained on 2009 July 29 starting at 17:29 UT with a time cadence of 15 s. The data were taken at the Gregorian focus, and each reconstructed image was derived from a burst of 100 raw 10 ms exposures acquired over an 8 s period during each 15 s interval. The second data set was obtained with an Hα Lyot filter tuned at 0.13 nm from the line center toward the short-wave end of the solar spectra (corresponding to an upward Doppler shift of ∼60 km s−1). This data set was acquired on 2009 August 27 and lasted 15 minutes with the same temporal cadence as the first data set. For both data sets, each raw image in a burst was corrected for dark current and flat field and speckle reconstructed employing the KISIP speckle reconstruction code (Wöger et al. 2008). The resulting speckle reconstructed images were carefully aligned and de-stretched, and the field of view of each image is 50'' × 50''.
3. RESULTS AND DISCUSSION
3.1. Bright Points in Dark Intergranular Lanes
In Figure 1, we show a typical NST image of the photospheric granular field with bright points in the intergranular lanes evident. These are agglomerations of the vertical magnetic field seen in cross section. The subfield (of the 50'' × 50'' field) shown is 12'' × 12''. It is generally agreed that the points are bright compared to the mean granular intensity because the dynamical equilibrium with the external gas is partly balanced by the field in what is commonly called a "flux tube." Since the gas pressure is lower inside the "tube," the measured radiance comes from a deeper, hotter layer of the Sun. What is obvious in this representative image is that the bright points do not come in sheets as observations with lower spatial resolution show and simulations predict (Schüssler et al. 2003; Rempel et al. 2009; Berger et al. 2004). In fact, we see no evidence of sheet-like structures in any of these observations covering the entire field of view over the duration of the data. So instead of an unstructured magnetic sheet in the dark lanes between granules, one might envision a turbulent "sheet" composed of separated, nearly vertical threads that are "washed out" at lower resolution, so as to appear continuous. Still, a definitive answer awaits higher resolution. We emphasize that one should not be persuaded that the "tubes" are round merely because the images show them to be so. The roundness is indicative of the point-spread function (resolution) of the NST at this wavelength. The diffraction limit (Rayleigh criterion) of the telescope at 700 nm is 011, which is essentially the same as the 012 that is determined from the speckle reconstruction of the TiO images. The largest "tubes" have a diameter about twice the diffraction limit, and in the larger tubes one can see a gradient in brightness nearing the edge. Thus, in reality they could be even narrower, brighter threads with more intense magnetic fields that appear round reflecting the telescope resolution at 700 nm. Soon we will observe at shorter wavelengths corrected with adaptive optics and it will be interesting to see whether the tubes stay the same size and show structure, or become even smaller and brighter. Such observations will provide critical constraints on the process of formation and dynamical equilibrium of "flux tubes."

Figure 1. Typical granular subfield observed in TiO with a field of view of 12'' × 12''. The nearly circular bright points in the dark lanes are horizontal cross sections of nearly vertical fibers of the intergranular magnetic field shown in intensity.
Download figure:
Standard image High-resolution imageThe typical lifetime of the bright points is a few minutes with wide variation. For instance, some of the ones shown in Figure 1 lived more than 10 minutes (they were present at the beginning of the data set). We note that most of them at the center of the field of view disappear when the upper and lower surrounding granules (indicated by red arrows) collide. However, the collision creates a vortex into which the encircled bright points enter and spin around each other until they both disappear about 10 minutes later. To investigate this process further, we calculated the divergence ( ) and vorticity (
 ) of the transverse velocities (determined using local correlation tracking; Strous et al. 1996) and found large and well-defined cyclonic flows in the circled region.
This newly observed phenomenon of two bright points forced into cyclonic motion is especially interesting because it is often argued that the braiding/twisting of flux tubes is a significant way to transfer energy upward to layers above the photosphere where the braided/twisted field unwinds and releases energy. Rotation and folding of chains or groups of bright points were observed earlier (Berger & Title 1996).
Now the NST provides us with the opportunity to observe this process and study it in detail. The resiliency of the longer lived bright points might imply a deeper anchoring of the tubes beneath the surface. In the data set, we also see evidence of a single event in which a granule brightens at one edge and then seems to shed two bright points into the dark lane. The bright points then move to the center of the lane and have a lifetime extending beyond the end of the data set 6 minutes later.
3.2. Equipartition of the Photospheric Velocity Field and Magnetic Field
A fundamental property of the photosphere governing its dynamics is a rough equipartition between the kinetic energy density of horizontal flows and the magnetic energy density. An exact equipartition is a standard assumption in the simulations of the photospheric region. Using NST and Hinode quiet-Sun data, we are able to more precisely probe the nature of the photospheric turbulence and demonstrate the conventional, but unproven, wisdom of equipartition over a wide range of spatial scales.
Our determination of equipartition proceeds by expressing the plasma and magnetic field quiet-Sun energy densities in terms of the Fourier transforms of their respective observed energy densities. In Figure 2, we compare the kinetic (green and orange, NST data, which were also used in Figure 1) and magnetic (black, Hinode/SP data quiet-Sun data from 2008 November 30) energy spectra calculated for the quiet-Sun photosphere measured near solar disk center. Under the assumption of isotropic turbulence, each magnetic field component would display the same energy density spectrum. We chose to use the line-of-sight component of the field primarily because it is much more accurately measured than either transverse component. We made use of a calibrated Hinode SOT/SP (Tsuneta et al. 2008; Ichimoto et al. 2008) line-of-sight magnetic flux map of size 985 × 512 pixels with the pixel size of 03 available at LMSAL Hinode Data Center (http://sot.lmsal.com/data/sot/level2d/). As for the velocity field, the two equivalent, transverse components are the ones sweeping the magnetic field from the granules and into the lanes. We note that under the same considerations that led to the assumption of equipartition, one should expect the same equipartition from day to day in the quiet Sun.
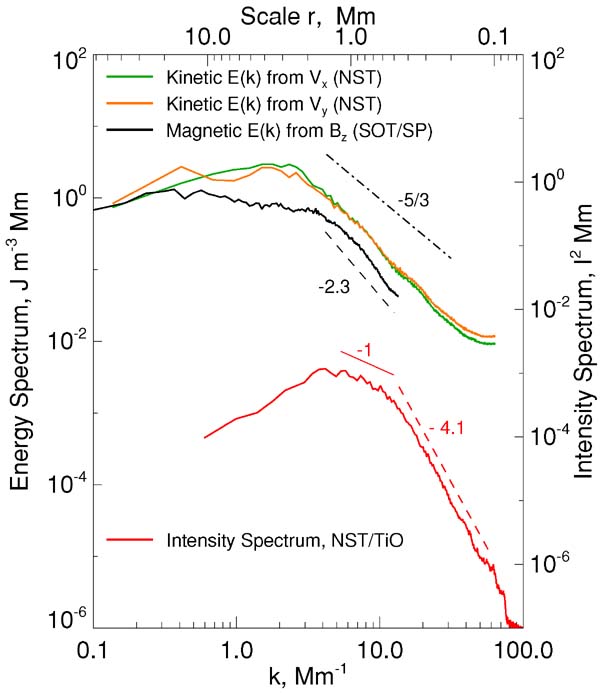
Figure 2. Upper part: the NST power spectra of the kinetic energy derived separately for the Vx (green) and Vy (orange) components of the transverse velocity field determined from the speckle reconstructed NST/TiO data set. The power spectrum of the line-of-sight magnetic field (black) in a quiet-Sun area derived from Hinode/SOT/SP data. The dot-dashed line segment shows the −5/3 Kolmogorov law. The NST spectra extend further toward smaller scales than the Hinode spectra because of a factor of 3 difference in aperture. Lower part: the power spectrum of the solar granulation (red) obtained from the best-quality image in the raw NST/TiO data set, which was obtained from averaging 120 spectral images. Dashed and solid line segments indicate the slope of the spectra determined within the spatial range they span.
Download figure:
Standard image High-resolution imageAs apparent in Figure 2, the kinetic and magnetic energy density spectra are quite similar over a wide dynamic range demonstrating for the first time that there is a true equipartition. This result provides strong support for the important magnetohydrodynamic (MHD) assumption of an equipartition state in the photospheric magnetized plasma (Schüssler et al. 2003; Rempel et al. 2009). The energy spectra display a slope close to k−5/3 on scales smaller 1.5 Mm, which clearly implies the Kolmogorov (Kolmogorov 1991) behavior in which energy cascades to ever-smaller scales. In fact, the spectra show an exponent that is slightly steeper than −5/3, which might be attributed to the intermittent nature of turbulence under real photospheric conditions. We also note that we can deduce a kinetic energy density from the line-of-sight Doppler-shifted Hinode data. However, the shape of the spectrum depends strongly on the filtration/smoothing and varies drastically. Note that the NST spectra from the transverse velocities are from data that are already smoothed in time and space data, and are less influenced by noise. That said, the kinetic energy density determined from Doppler-shifted data roughly agrees with that from the TiO data. Further, comparison of the NST kinetic and Hinode magnetic spectra shows that if there were a fast turbulent dynamo in the photosphere, it could only exist on scales much smaller than 0.5 Mm. As a consequence of a (fast) dynamo, the turbulent exponent for the field would have to be shallower than −5/3 (of order of −1, which is the Kolmogorov exponent for such a dynamo; Biskamp 1993), so that the magnetic energy density would have to ultimately exceed the kinetic energy density due to the generation of small-scale magnetic fields by velocity vortices.
We note that for dissipative turbulence, we should observe a −17/3 exponent, which is not present in our data in the upper part of Figure 2. Therefore, future observations with higher resolution will determine the spatial scale of the onset of dissipative turbulence, and the possible role, if any, for a fast dynamo. For now, the upper limit for the fast dynamo follows from a comparison of the NST and Hinode data in the upper part of Figure 2.
The NST granular intensity spectrum was calculated using our power spectrum code (Abramenko et al. 2001; Abramenko 2005), which was designed for a scalar field specified on a two-dimensional surface. The results are shown in the lower part of Figure 2 (red). This granular spectrum does not seem to possess any regime with k−5/3. Instead, we observe a rather narrow k−1 interval at scales 1.1–0.5 Mm followed by a broad k−4 interval extending down to the noise-affected scales in the NST data (the slight enhancement of power at scales of approximately 0.1 Mm). Generally, a shallow spectrum is related to the inertial-convective regime of turbulence (Espagnet et al. 1993; Monin & Yaglom 1975). NST data indicate that the inertial-convective range (k = −1) of turbulence extends to about 0.5 Mm, which is a smaller scale than previously reported (Espagnet et al. 1993; Lepreti et al. 1999). This implies that turbulent convection may have more influence on the formation of temperature/brightness structures than previously realized.
The NST intensity spectrum follows k−4 at scales below 0.5 Mm. This significant difference from −17/3 leads us to suggest that turbulent dissipation is being affected by the presence of a magnetic field. Previously (Espagnet et al. 1993; Lepreti et al. 1999; Rieutord et al. 2009), spectra were reported that very roughly corresponded to k−17/3, but arguably correspond to the k−4 reported here.
We purposely extended the intensity spectrum in the lower part of Figure 2, what we know to be the diffraction limit of the NST. Below about 015 (or 0.11 Mm) the curve becomes ragged, but follows the same slope as larger scales. However, note the abrupt change in the slope of the intensity spectrum at about 01 (or about 0.07 Mm), which tells us the effective observational resolution limit of the telescope at 700 nm, which is about the same we have seen from the Rayleigh criterion and the speckle reconstruction, and reminds us that we can resolve nearly down to 01 at 700 nm. There are many important, dynamic phenomena that have been beyond our grasp that will be revealed with this resolution and better resolution to come at shorter wavelengths.
3.3. Smallest Scale Chromospheric Events
The NST enabled us to peer more sharply than ever before into the solar chromosphere. This is the relatively thin (few thousand kilometers) atmospheric layer between the photosphere and corona. Even with the finer resolution of the NST, the solar chromosphere shows its ceaselessly changing character with small-scale energetic events occurring constantly all over the solar surface. These small-scale energy release events are expected to hold the key to unlocking the mystery of chromospheric and coronal heating (Schrijver & Title 2005; Patsourakos & Klimchuk 2009; Hasan & van Ballegooijen 2008). Most of these events are observed as small, dark, jet-like features. The most prominent and best-studied phenomena are spicules, needle-like structures that dominate the solar limb when observed in the hydrogen spectral line at 656.3 nm (Hα), which is quite useful in revealing the chromosphere. Spicules are driven by photospheric oscillations and convective motions that leak into the chromosphere (de Pontieu et al. 2007). Seeing-free data from Hinode (de Pontieu et al. 2009) revealed even smaller and shorter lived features now called type II spicules (de Pontieu et al. 2007), chromospheric jets (Shibata et al. 2007), and penumbral micro-jets (Katsukawa et al. 2007), which were observed in the Ca ii H 396.8 nm spectral line.
The NST chromospheric data set discussed here was obtained at disk center with an Hα Lyot filter tuned at line center and blueshifted by 0.13 nm. The blueshifted images correspond to upward-directed flows that have velocities up to 60 km s−1 (dark features in the image). Temperature and density may also effect the line width however; however, the small scale of the events and the absence of flare emission do not favor these possibilities.
The Hα line center data were used to probe filaments (called prominences at the solar limb). These dynamic magnetic features span the photosphere, chromosphere often reaching into the corona. Present observations reveal filament-like structures on all scales, including those so small that they only span not much more than a single granule and have never been seen before. Such events seem to suggest a self-similarity of filaments and/or magnetic structures underlying filaments from hemispheric down to granular scales.
There are several types of dark dynamic features apparent in the image in Figure 3. Most noticeable are the dark elongated features (center left of the figure in the biggest white box) that form a rosette-like structure and are seen against the background of photospheric granulation and stronger network magnetic fields manifested by large clusters/conglomerates of bright points. The majority of these dark, absorption features appear and fade without showing any significant bulk motion along the arc of the feature, while showing noticeable transverse motions. According to Rouppe van der Voort et al. (2009), they can be identified as rapid blueshift events (RBEs), or straws (Rutten 2007), thought to be disk counterparts of the type II spicules (Rouppe van der Voort et al. 2009; Langangen et al. 2008) discovered with Hinode. The events in the large white box indicate the scale of the smallest chromospheric features studied until now.

Figure 3. NST Hα 0.13 nm (corresponding to a Doppler blueshift of ∼60 km s−1) image acquired on 2009 August 27. The three small white boxes indicate regions of interest shown in detail in Figure 4. These regions show intriguing small-scale elongated, dark features bisecting a granule (box 1), originating in a dark lane (box 2), and inclined to reveal a loop-like structure (box 3). Each small box indicates the behavior of new features discovered with the NST. As for the large white box, we note that the large dark and elongated structures therein may be identified as rapid upflow events and are thought to be disk counterparts of type II spicules.
Download figure:
Standard image High-resolution imageHowever, the NST also sees previously unknown, even finer chromospheric features in the Hα 0.13 nm data. They appear as very small, dark, and short-lived jet-like upflows (Doppler shifted to the blue) arising from the dark lanes. Their presence in these far blueshifted images indicates strong plasma upflows, although we are reluctant to call them pure upflow events (or jets), since it is not clear at this moment how strong they are in the redshifted images, which would reveal plasma downflows (note that knowledge of the structure of plasma flows within these events is important for understanding the mechanism of their formation).
Their origin seems neither to be unequivocally tied to strong magnetic field concentrations accompanied by bright points nor predominantly associated with the vertex formed by three (or more) granules. Rather, they most frequently stem from the intergranular lanes separating two granules, which are known to host strong magnetic fields too, even without bright points being apparent there (Berger & Title 2001). These intergranular events were not resolved in any earlier high-resolution off-band Hα images (e.g., Figure 2 in Rouppe van der Voort et al. 2009; Figure 7 in Rutten 2007; Figure 2(c) in Berger & Title 2001). The projection of these events on the image plane may reach a typical length of 1 Mm, while maintaining their width at 0.2 Mm during a typical lifetime of 30–60 s (some as long as 4 minutes).
The three panels in Figure 4 show the time evolution of three small-scale upflow events detected in our blueshifted data set.

Figure 4. Time evolution of events that occurred in each of the smaller boxes in Figure 3. Each row of images represents the evolution of a single event. The top row shows an event that arcs over a granule seeming to bisect it. The middle row shows an event emerging from a dark lane. The bottom row shows an event with a clear arc structure.
Download figure:
Standard image High-resolution image
The first row shows an event that persisted for at least 30 s and it neatly bisects the underlying granule. The second row shows another event originating in a dark lane and traversing the granule. Even though these tiny events are ubiquitous, it was not easy to find one clearly revealing their common origin in the dark lanes because most of them suddenly appear as a streak across a granule. During a 15 s time step, these events would show a streak over about 700–900 km (∼1'') so that the time cadence of 15 s is not typically sufficient to resolve their development. One can see, therefore, that to observe these tiniest of events, we should have a cadence of about 5 s or better, which will come soon for the NST. The third event lasted somewhat longer and can be seen extending and curving, as if it were plasma moving along a field line belonging to a loop.
We do not know what these events are. It has yet to be established whether these intergranular events are pure upflows (jets) and how their dynamics might be associated with the underlying dynamics of convective flows and turbulent magnetic fields. An extensive analysis of solar data, which would include spectral data, needs to be carried out with high spatial, temporal, and spectral resolution. Two interpretations are offered, although their origin remains open. First, they may represent smallest scale jets accelerated by a reconnection between the intergranular ambient magnetic fields and the turbulent fields churned up by granular flows (Lites et al. 2008; Orozco et al. 2008; Centeno et al. 2007; Isobe et al. 2008). Alternative possibilities are that they may be either a result of oscillations and turbulent photospheric flows leaking into the lower chromosphere (de Pontieu et al. 2007; and references therein) or shearing motions of photospheric footpoints of vertical magnetic field lines (van Ballegooijen et al. 1998).
We gratefully acknowledge support of NSF (ATM-0745744 and ATM-0847126), NASA (NNX08BA22G), AFOSR (FA9550-09-1-0655), and a Hinode subcontract through Lockheed (8100000779).