
Abstract
The contribution of the spatially uniform variation of average optical absorption to the dynamics of the transient two-wave mixing (TWM) response is considered. It is shown theoretically and confirmed experimentally that this transient effect, via dynamic population gratings in erbium-doped fibers (EDFs) can ensure a response nearly two times faster in such gratings as compared to the growth rate of fluorescence uniformly excited under similar conditions, and can also result in an additional overshot in the tail of the TWM response. This additional 'accelerating' contribution is of even type, and does not influence the odd transient TWM response for the refractive index component of such gratings in the EDFs reported earlier. It is also shown that this effect can be utilized to monitor the formation of the dynamic grating with an auxiliary probe wave of the essentially different non-Bragg wavelength.
Export citation and abstract BibTeX RIS

Original content from this work may be used under the terms of the Creative Commons Attribution 3.0 licence. Any further distribution of this work must maintain attribution to the author(s) and the title of the work, journal citation and DOI.
1. Introduction
Dynamic Bragg population gratings and two-wave mixing (TWM) via such gratings in the saturable rare-earth-doped optical fibers [1, 2] were demonstrated recently as having some interesting practical applications. In particular, their utilization in the tunable narrow-band optical filters [3, 4], single-frequency fiber lasers [5–7], adaptive interferometers and optical fiber sensors [8, 9], and slow/fast light configurations [10] were reported recently. The dynamic Bragg grating configurations can also be utilized for investigation of the excited-state migration (diffusion) processes [11, 12].
In all of the above-mentioned applications, a reliable evaluation and the possibility of controlling the speed of the TWM response is of major importance. In particular, the contribution of the excited-state migration is usually evaluated as an additional speeding up of the four- or two-wave mixing responses [11, 12]. It is generally accepted that the formation of the population grating, and particularly the decay of the TWM response under rectangular phase modulation of one of the recording waves (see figure 1) [2], is governed by the dynamics of the metastable-level population of the active ions. In the simplest optical configuration for rare-earth-doped fiber, i.e. without optical pumping, the formation of the grating (and the TWM response) is determined by saturation of the active ions' fundamental optical absorption, which occurs with the characteristic rate [13]:

Here,  is the spontaneous relaxation time of the metastable level,
  is the average transmitted light intensity, and
  is the so-called saturation intensity.
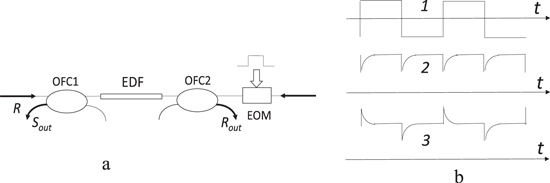
Figure 1. Simplified schematic of the transient TWM configuration in doped optical fiber with rectangular phase modulation of one of the recording waves: (a) (EOM—electro-optic phase modulator, OFC1,2—optical fiber couplers); and (b) the shapes of the rectangular phase modulation (1) and typical qualitative TWM responses for the amplitude (2) and the phase (3) population gratings.
Download figure:
Standard image High-resolution imageFor the purposes of the present consideration we can substitute the intensity ratio in the last equation with the ratio between the two light powers: the transmitted power  and the saturation one—
 which can be obtained from the above-mentioned light intensities by multiplying them by the effective modal area of the fiber. Note that in the conventional widely spread silica erbium-doped fibers (EDF), the spontaneous relaxation time is close to 10 ms [14], and the saturation power is usually located in the sub-mW range [2] for the recording wavelengths between the 1480 and 1570 nm spectral region of the Er3+ fundamental absorption.
One can expect, however, that the grating relaxation is described by the same simple equation (1) when one can neglect the spatial migration of the active ions excited states and when the contrast of the recording interference pattern is low ( only. Our earlier experiments [12] have demonstrated that in the EDFs with low/medium erbium concentration (<1000 ppm), the effects of the excited-state diffusion are insignificant for the formation of the dynamic Bragg population gratings in question, with typical fringe spacing of about 0.5 μm. The influence of the recording interference pattern with high contrast on the grating formation dynamics and the TWM response was never taken into account and analyzed in detail. This effect, which is of high importance because for many practical configurations the recording (or interacting via TWM process) waves intensities are very similar to each other, is investigated in the present paper.
2. Theoretical consideration
Figure 2 presents the normalized to initial and shifted (as a result of a π-phase jump introduced into one of the recording waves at t = 0—see figure 1) stationary absorption coefficient profiles in one spatial period of the recording's sinusoidal interference pattern ![$P(z)=P[1+m{\rm{c}}{\rm{o}}{\rm{s}}(Kz)]$](https://content.cld.iop.org/journals/2040-8986/18/8/085502/revision1/joptaa29d3ieqn7.gif) with contrast m = 1 and m ≪ 1. It was assumed that these profiles are determined by the local value of light intensity in the interference pattern according to the following well-known [13] equation:
with contrast m = 1 and m ≪ 1. It was assumed that these profiles are determined by the local value of light intensity in the interference pattern according to the following well-known [13] equation:

Here,  is the initial, non-saturated value of the fiber optical absorption. These illustrating curves were obtained for typical average light power
  (for which the maximum TWM response amplitude was expected [2]) and, for simplicity, the effect of a general attenuation of the recording light along the fiber axis was neglected.
In the same figure, the solid lines show a representative set of profiles of the fiber optical absorption (i.e. the amplitude grating) as it relaxes from its initial shape at t = 0 to the final (inverted) shape at  In our calculations it was also assumed that in every point the absorption coefficient relaxed exponentially from the initial value to the final one with the characteristic time (see equation (1)) determined by the local value of the total light power in this particular cross-section of the fiber.
In the presented curves we can see that in the case of a large contrast under consideration (m = 1), the relaxation of the grating profile to its new position is accompanied by a significant distortion of the absorption grating profile. This, obviously, results from essentially distinct values of a local light power  in different cross-sections of the interference pattern: the optical absorption relaxation rate is clearly maximum in the bright fringes of the displaced light pattern and minimal in the dark ones. A similar simulation shows that the relaxation of the grating of a low contrast (m ≪ 1) occurs without any significant change of its practically sinusoidal shape and with the characteristic time determined by the average light power
  .
.
Because of the intrinsic Bragg character of the light diffraction from the fiber dynamic gratings under consideration, the grating profile deformation is of no significance for the TWM process. What is really important is the evolution of the fundamental (Bragg) grating component, which contributes to the Bragg diffraction. Figure 3 shows the temporal development of this fundamental component in the grating recorded by the interference pattern of the same total average power ( for different values of the signal (S) wave and normalized power
  .
.
To our surprise, the relaxation rate of this Bragg component amplitude, which also governs the dynamics of the TWM process, has proven to be practically independent of r and, finally, of the contrast of the interference pattern  We have determined that a similar conclusion is also correct for higher and lower than
  average recording light powers. This obviously means that, by itself, the high contrast of the recording interference pattern does not influence the dynamics of the grating relaxation (and of TWM) in a significant way.
It has been proven, however, that during the high contrast grating relaxation process illustrated by figure 2(a), a significant transient variation of the average (i.e. averaged over one interference pattern spatial period) optical absorption of the fiber is observed. Figure 2(b) shows the dynamics of this change for the same fixed average light power  and for different signal wave normalized powers r. This is clearly an effect which is not expected in the case of low recording light pattern contrast, and figure 3(a) demonstrates how the maximum transient change of the optical absorption and the stationary Bragg grating component depend on r. Since, for low normalized signal wave power
  one can see from the figure that while the stationary grating amplitude depends linearly on m, the transient average absorption change, as expected, depends on the interference light pattern contrast as m2.
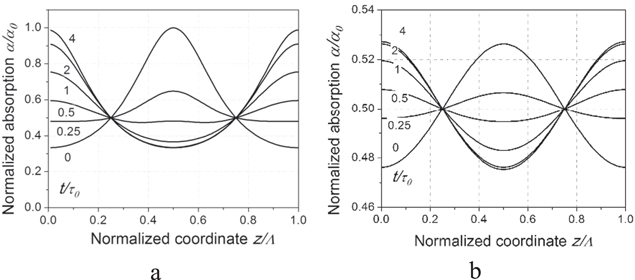
Figure 2. Evolution of the absorption grating profile during its relaxation to a new position of the recording interference pattern for m = 1 (a) and m ≪ 1 (b) for both figures  .
.
Download figure:
Standard image High-resolution image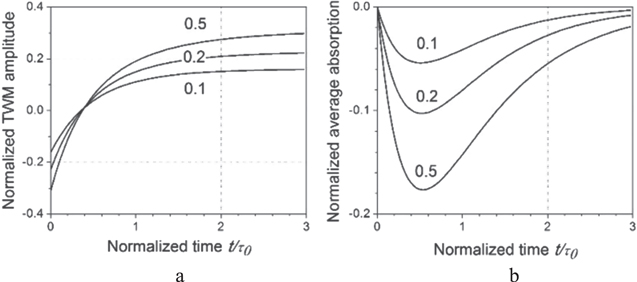
Figure 3. Relaxation of the fundamental Bragg grating component amplitude (a), and of the average absorption (b) observed for different normalized signal wave power r.
Download figure:
Standard image High-resolution imageThe effect of the transient reduction of the optical absorption is obviously observed in the transmitted power of the interacting waves. This means that it contributes to the dynamics of the experimentally observed TWM response, changing its shape and increasing the effective relaxation rate—see figure 3(b). As expected, the deviation from the expected m ≪ 1 exponential relaxation is minimal in the case of different recording powers (which reduces the value of m) and when it is observed in the wave of lower power. However, it is quite strong in the transmitted wave of larger power and even pronounced opposite sign overshot can be observed at the tail of the TWM response in this case. For approximately equal recording light powers (r = 0.5) the characteristic relaxation rate is nearly 1.5 times shorter than is expected from equation (1) for the same average light power level. It is also important to mention that due to a fundamentally different shape (see figure 2(b)), the transient temporal variation of the spatially uniform absorption does not influence the maximum amplitude of this modified TWM response, which is always observed immediately after the rectangular modulation phase jump.
3. Experimental configuration and results
To verify the results of the above-presented analysis we have performed experiments in a standard configuration of the transient TWM with periodic rectangular modulation of phase in one of the interacting waves. A schematic of this setup is shown in figure 5; for more details one can see our earlier publications, e.g. [15].
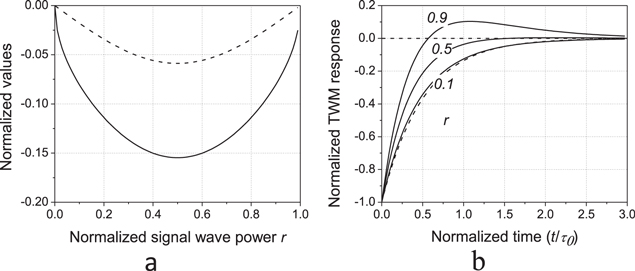
Figure 4. Normalized to initial optical absorption maximal transient change of the average optical absorption (dashed line) and that of the stationary Bragg grating amplitude (solid line) as functions of r (a), and normalized to their maximal values TWM peaks observed for r = 0.1, 0.5, and 0.9 (b). The dashed curve presents exponential relaxation with characteristic time τ0/2). All curves are calculated for P = Psat.
Download figure:
Standard image High-resolution image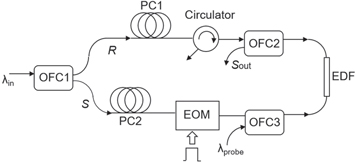
Figure 5. Optical setup utilized for measurements of TWM response. PC1,2—polarization controllers, OFC1,2,3—optical fiber couplers, EOM—electro-optic phase modulator, EDF—erbium-doped fiber.
Download figure:
Standard image High-resolution imageThe presented results were obtained using silica single-mode EDF Er103 of CorActive with a relatively low erbium concentration (around 600 ppm), for which the spatial migration of the erbium ions' excited states was shown to be negligible [12].
The figure 6(a) shows the normalized TWM profile responses to their maximal amplitudes as they are observed in the 'signal' output recording wave for the 1526 nm wavelength. To ensure sufficiently high signal-to-noise ratio, we utilized a ≈2 m-length doped fiber with initial (non-saturated) optical density Lα0 ≈ 2.3 at this particular wavelength. For a phase jump π, the amplitude of the rectangular phase modulation used in these experiments for the TWM response was of the even type illustrated by curve 2 in figure 1(b). The total incident laser power was fixed and close to 0.3 mW, i.e. to the saturation power of the fiber at this wavelength (≈0.4 mW), but the normalized signal wave power was different: r = 0.1, 0.5, and 0.9.
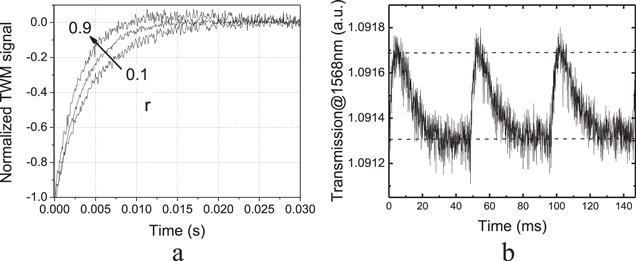
Figure 6. Normalized TWM response profiles observed for total incident power ≈0.3 mW at λ = 1526 nm for different relative power of the signal wave r: 0.1, 0.5 and 0.9 (a); and transmission of the fiber during the transient TWM experiment at λ = 1549 nm observed at the auxiliary wavelength ≈1568 nm (b).
Download figure:
Standard image High-resolution imageBy comparison of the experimentally observed oscilloscope traces presented in figure 6(a) with the theoretical profiles shown in figure 4(b) we can see the expected acceleration of the TWM response. For the same total incidence power the shortest TWM response is observed in the output recording wave of a higher power (r = 0.9). One can also see some traces of the expected characteristic overshot of the opposite sign in the tail of this particular TWM response. For the case of equal wave powers (r = 0.5) the TWM response rate is approximately 1.5 times higher than that observed in the recording wave of lower power (r = 0.1).
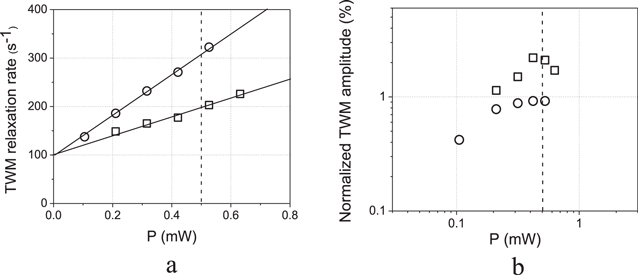
For more quantitative measurements, the recording (TWM) wavelength was selected to be 1549 nm, for which the doped fiber optical absorption is lower and the population grating in the EDF is practically of the absorption type [15]. To reduce possible additional influence of the fiber saturable absorption on the recording wave powers we utilized relatively short ≈1 m-length doped fiber with initial (non-saturated) optical density  at this wavelength. The saturation power of the doped fiber was estimated to be approximately ≈0.5 mW for this wavelength.
The figure 7(a) shows the recording power dependence of the TWM relaxation rate for two different values of the normalized signal wave power r = 0.5 and 0.1. One can clearly see the theoretically predicted difference between the TWM relaxation rates in these two cases. As is expected for the recording power close to the fiber saturation power (see figure 4(a)) the relaxation rate in the former case is lower by approximately 30% compared to the latter case. Also, when the TWM response is observed in the signal wave of the lower power (r = 0.1) its relaxation rate is close to that of the fluorescence growth rate (equation (1)), i.e. it is two times higher than  when
when  .
.
Figure 7. Incidence power dependence of the TWM relaxation rate (a), and normalized amplitude (b), when observed in 1 m long EDF at the recording wavelength of 1549 nm for two different normalized signal wave powers r: 0.1 (,) and 0.5 (B).
Download figure:
Standard image High-resolution image
The normalized TWM response amplitudes to the average transmitted light power as functions of the total recording power are shown in figure 5(b). As expected, their maxima are observed at  and the normalized amplitude of the response observed in the recording wave of the lower intensity is approximately two times higher than that observed for r = 0.5.
4. Discussion
It is well-known that, in addition to a change of the fiber optical absorption, the optical pumping of the EDF at 980 nm also results in a significant variation of the fiber refractive index—see, for example, [16]. The latter variation also shows a significant spectral dependence inside the spectral profile of the Er3+ fundamental absorption. In a similar way, the saturation of the fiber optical absorption under the influence of the incident light power in the mW scale inside the fundamental absorption spectral range also results in similar changes of the EDF refraction index [17]. This enables, in particular, the formation of the phase (i.e. refractive index) component in the Bragg population gratings recorded in EDFs. This grating also proves to be essentially spectrally dependent and is comparable with the amplitude component in the short wavelength region of 1480–1490 nm [15]. The shape of the transient TWM response from such a phase grating proves to be, however, quite different: it is of the odd type (see illustration in figure 1(b)), reaching its maximum for π/2 rectangular phase modulation amplitude, and going to zero for π modulation amplitude.
Here, we can make two comments. First, the transient spatially uniform changes of the fiber optical absorption considered above are of the even type, i.e. the sign of this change does not depend on the sign of the phase jump when it is not equal to π. As a result, the changes this effect introduces to the shape of the TWM response are also always of an even type. This means that it modifies the even response, which is usually associated with the amplitude dynamic grating only, but not the odd TWM response, which is associated with the phase grating component. This, in particular, explains the experimentally detected difference in the response rates of the even and odd contributions to the transient TWM (the even component was, indeed, faster that the odd one) reported earlier [15] but not explained there.
Additionally, when a suitable wavelength (e.g. from the spectral range 1480–1490 nm) is utilized, one can also expect for a spatially uniform transient variation of the fiber refractive index, which, in principle, can also influence the shape of the TWM response. In the accepted approximation of a weak grating diffraction efficiency, we neglect the secondary influence of the interference pattern change due to formation of the grating itself. In this case we can assume that the grating is re-recorded to a new position as a result of the phase jump introduced by the phase modulator, while an additional phase modulation via transient change of the fiber refractive index is introduced into the TWM response only.
We can also accept that the periodic transient modulation of the spatially uniform refractive index  is approximately proportional to the spatially uniform fiber's transient optical absorption change, i.e. it is also of the even type (see figure 2(b)) and it is also proportional to the square of the grating contrast. If the amplitude of the externally introduced phase modulation is selected to be π (as it was done in the experiments presented) the transient TWM response from the amplitude grating is maximum and that from the phase grating is equal to zero. The transmitted and the diffracted waves from the amplitude grating are always in phase (before the phase jump) or in antiphase (after the phase jump) in this case. For this reason, the additional spatially uniform transient modulation of the fiber refractive index cannot modify the intensities of the total output of the light waves in a significant way.
Another important aspect to be analyzed is associated with the fact that the change of the average absorption coefficient, which accompanies the grating formation, is not a resonant effect and can be detected at an essentially different wavelength. Indeed, it is generally accepted that there is practically no spectral hole burning [13] in EDFs at room temperature and the whole Er3+ absorption line (1480–1570 nm) is considered to effectively be a homogeneously broadened one. For this reason, the temporal modulation of the transmitted probe wave at a different wavelength from all of this absorption spectrum is expected to be practically the same as for the transmitted recording waves.
Figure 6(b) shows modulation of the transmitted power of an auxiliary probe wave at a shifted wavelength (1568 nm), it is observed during the above-described transient TWM experiment with approximately equal powers of the recording waves at 1549 nm (r = 0.5 at P = 0.5 mW). One can see the periodic pulses of the sign, shape, and duration expected from our theoretical analysis—see figure 3(b). The experimentally observed modulation depth of these peaks (≈3.5*10−4) and the initial optical density at the probe wavelength (≈0.22) allows us to evaluate the effective modulation depth of the recorded population grating as m' ≈ 0.15. The rather close value of m' (≈0.12) was also obtained from the same experiment (with the transient TWM observed at 1549 nm) when the probe wave was at 1492 nm, i.e. from the opposite side of the Er3+ fundamental absorption spectrum.
Note that the above estimations are close to the evaluation of the recorded dynamic grating contrast (m' ≈ 0.07), which was obtained from the relative amplitude of the TWM response observed at 1549 nm in the same experiment. These results are in agreement with those reported earlier in many different publications (see, for example, [2]). The significant discrepancy between the modulation depth in the recorded population/absorption grating and those with a modulation depth of the recording interference pattern which is close to unity is typical for the recording wavelength (i.e. 1549 nm in our case) at the center of the fundamental erbium absorption spectrum. More qualitative and exact comparison of the experimental data on the transient TWM and on the transient non-Bragg transmission obviously requires the development of theory of the population grating recording under simultaneous illumination by light of two different wavelengths, which is outside the scope of this paper.
5. Conclusions
It is shown that, due to the transient variation of the average optical absorption of the fiber during re-formation of the population dynamic grating to a new position of the interference pattern, the characteristic rate of the transient TWM response in EDFs can be significantly faster than the fluorescence growth rate and can even acquire an overshot of the opposite sign at its tail. This new contribution to the TWM response is of an even type and does not influence the odd TWM response component from the phase (refractive index) dynamic population grating component, which explains the experimentally observed difference in the characteristic rates of the odd and even TWM components reported earlier for EDFs. It is also demonstrated that effect of a transient change of the average absorption opens up a new way for observation of the transient process of the grating formation and for evaluation of its contrast by means of the probe wave of an essentially different, non-Bragg wavelength.