

Abstract
As 3D bioprinting has grown as a fabrication technology, so too has the need for improved analytical methods to characterize engineered constructs. This is especially challenging for engineered tissues composed of hydrogels and cells, as these materials readily deform when trying to assess print fidelity and other properties non-destructively. Establishing that the 3D architecture of the bioprinted construct matches its intended anatomic design is critical given the importance of structure-function relationships in most tissue types. Here we report development of a multimaterial bioprinting platform with integrated optical coherence tomography for in situ volumetric imaging, error detection, and 3D reconstruction. We also report improvements to the freeform reversible embedding of suspended hydrogels bioprinting process through new collagen bioink compositions, gelatin microparticle support bath optical clearing, and optimized machine pathing. This enables quantitative 3D volumetric imaging with micron resolution over centimeter length scales, the ability to detect a range of print defect types within a 3D volume, and real-time imaging of the printing process at each print layer. These advances provide a comprehensive methodology for print quality assessment, paving the way toward the production and process control required for achieving regulatory approval and ultimately clinical translation of engineered tissues.
Export citation and abstract BibTeX RIS
1. Introduction
As the demand for organ transplantation continues to outpace supply, clinicians and researchers are turning to regenerative medicine and tissue engineering strategies to create tissue de novo [1]. 3D bioprinting has emerged as a way to begin to build these tissues using robotic control to precisely pattern cell-laden and hydrogel bioinks in a layer-by-layer process [2]. Here we use a broad definition of the term bioink to include high-density cell slurries, synthetic and natural hydrogels, cell-laden hydrogels, biomaterial inks, and combinations thereof used for extrusion bioprinting. Bioprinting has been used to produce a number of advanced constructs including collagen heart valves, contractile cardiac muscle constructs, perfusable vascular networks, kidney proximal tubule models, external ear scaffolds, and microfluidic models of lung alveoli capable of gas exchange [3–9]. While still at the research stage, these and many other examples are being developed for applications ranging from in vitro model systems and drug discovery platforms to tissue replacements [4, 5, 10–12]. While the field remains years away from clinical translation, as bioprinting capabilities improve and constructs become larger and more geometrically complex, there is an increasing need for hardware and software platforms that enable non-destructive, volumetric 3D imaging and validation of printed constructs. Existing imaging techniques allow for characterization of construct fidelity after printing; however, by acquiring images during the printing process we can create full 3D reconstructions of geometrically complex prints and monitor the fabrication process.
While an integrated platform for 3D bioprinting and volumetric imaging is valuable for all bioprinting modalities, it is even more useful for embedded 3D bioprinting techniques such as freeform reversible embedding of suspended hydrogels (FRESH). In FRESH, the support bath is critical to enabling true freeform printing, but is highly light scattering making live viewing and imaging of the print process challenging [3, 4]. Commonly used imaging techniques such as bright field imaging and confocal fluorescence microscopy either lack the ability to capture 3D images, are too slow, or cannot image through the scattering gelatin microparticle support bath. Micro-computed tomography (µCT) imaging can acquire 3D volumetric images of both external and internal features, but requires an x-ray source, extended post-processing time for 3D image reconstruction, and relatively large form factor imaging hardware that would be challenging to incorporate into a 3D printing motion control platform. The ideal imaging solution needs to have a large imaging depth and field of view, a fast volumetric acquisition speed, the ability to resolve features from the micron to centimeter scale, be non-destructive to the sample, and be small enough to be integrated into a 3D bioprinter. Optical coherence tomography (OCT) is an imaging modality that uniquely fulfills these requirements. OCT has been a valuable tool for clinical imaging in ophthalmology of the retina and cornea [13–15], creating 3D angiograms [16, 17], and even monitoring fabrication and quality of electronic devices [18, 19]. More recently, the use of OCT has emerged in the 3D printing space to monitor print quality for simple process feedback control, to image collagen, polyethylene glycol (PEG), and 3D printed hydrogel scaffolds after printing [20–25], and integrated into a 3D bioprinter to measure polycaprolactone (PCL)-based and alginate-silk scaffolds printed in air [26]. These reports demonstrate the advantages of using OCT to characterize a printed scaffold. Achieving true 3D reconstruction of an embedded printed construct with complex internal architecture requires integration of a 3D imaging system, such as OCT, directly into high-performance 3D bioprinters for in situ monitoring and analysis.
Here we address this challenge by developing a custom-built dual extruder 3D bioprinter with an integrated OCT system to perform real-time imaging during FRESH printing. In addition to developing the custom hardware, we enhanced the OCT contrast of our collagen I bioink, developed a method to image prints larger than the maximum imaging depth of our OCT (>8.3 mm), and created a transparent support bath to address the challenge of FRESH gelatin microparticle support bath light scattering. Finally, we demonstrate the flexibility of this platform by imaging live during printing, intermittently between print layers, or following print completion. Together these advancements enable us to (a) visualize our constructs while they are still embedded, providing in situ measurements of the as-printed geometry, (b) assess the quality of large bioprinted constructs such as human-scale tissues and organs, and (c) generate 3D reconstructions of the bioprinted construct for quantitative dimensional measurements, error detection, and to ensure geometric fidelity.
2. Materials and methods
2.1. Experimental design
The objectives of the experiments presented here were to develop the ability to perform in situ imaging of FRESH bioprinted constructs using optical coherence tomography. To improve signal to noise ratio (SNR) and image quality using OCT we experimented with high contrast collagen inks, bioprinting the gelatin microparticle support bath, and refractive index matching to make the support transparent. We then demonstrated the effectiveness of these approaches by imaging functional and dimensional deviations of multiple bioprinted constructs including four that were derived from medical imaging data.
2.2. Integrated OCT bioprinter
The bioprinter used here was built using four Parker Hannefin 404 × R 100 mm travel precision stages in a gantry configuration (8 µm travel accuracy verified using Mitutoyo absolute digimatic indicator 543–792, data not shown) mounted to an aluminum baseplate (www.worldofclamping.com) [27]. The printer utilizes two custom Replistruder 5 syringe pumps built with high-precision metric leadscrews (www.McMaster.com) and compact Nema 11 motors with planetary gearsets (www.stepperonline.com); both were mounted to the Z stage. A dovetail adapter was designed, 3D printed from polylactic acid (PLA) plastic, and mounted to the Z stage to receive the OCT scanhead (Thorlabs), which was controlled with its own dedicated polycarbonate (PC). The X, Y, and Z axes as well as the two extruders were controlled using a Duet 3 motion controller with a Raspberry Pi 4 single board computer dedicated for the user interface.
2.3. Plain FRESH gelatin microparticle support bath and generation
FRESH v2.0 gelatin microparticle support bath was prepared as previously described using a complex coacervation method to produce gelatin microparticles [4]. First, 2.0% (w/v) gelatin Type B (Fisher Chemical), 0.25% (w/v) Pluronic® F-127 (Sigma-Aldrich) and 0.1% (w/v) gum arabic (Sigma-Aldrich) were dissolved in a 50% (v/v) ethanol solution at 45 °C in a 1 l beaker and adjusted to 7.5 pH by addition of 1 M hydrochloric acid (HCl). The beaker was then placed under an overhead stirrer (IKA, Model RW20), sealed with parafilm to minimize evaporation, and allowed to cool to room temperature while stirring overnight. The resulting gelatin microparticle support bath was transferred into 250 ml containers and centrifuged at 300 g for 2 min to compact the gelatin microparticles. The supernatant was removed and gelatin microparticles were resuspended in a 50% ethanol solution of 50 mM 4-(2-hydroxyethyl)-1-piperazineethanesulfonic acid (HEPES) (Corning) at pH 7.4, to remove the Pluronic® F-127. The gelatin microparticle support bath was then washed three times with the same ethanol HEPES solution and stored until use at 4 C. Prior to printing, the uncompacted support was centrifuged at 300 g for 2 min then washed with 50 mM HEPES and centrifuged at 750 g for 3 min a total of four additional times. After the last washing the gelatin microparticle support bath was again suspended in 50 mM HEPES and was degassed in a vacuum chamber for 15 min, followed by centrifugation at 1900–2100 g, depending on level of compaction desired, for 5 min. The supernatant was removed and the gelatin microparticle support bath was transferred into a print container.
2.4. Collagen bioink preparation
All collagen bioinks were purchased as LifeInk 200 (Advanced Biomatrix). For bioprinting these inks were prepared as previously described [4]. Briefly, 35 mg ml−1 LifeInk was mixed with syringes in a 2:1 ratio with .24 M acetic acid to produce a 23.33 mg ml−1 acidified collagen ink. The ink was then centrifuged at 3000 g for 5 min to remove bubbles. To produce high contrast collagen inks an appropriate amount of 0.3–1.0 µm TiO2 powder (Atlantic Equipment Engineers) was then weighed out for a 250 parts per million (PPM) mixture with the acidified collagen bioink. The TiO2 powder was then dissolved in 100 µl of .24 M acetic acid. This TiO2 solution was then aspirated into the collagen through a needle. The TiO2 collagen mixture was then mixed 100 times between two syringes. The ink was then centrifuged at 3000 g for 5 min to remove bubbles. For printing the bioinks were transferred to a 500 µl gastight syringe (Hamilton Company).
2.5. OCT imaging
To acquire an image with the Thorlabs Vega 1300 nm OCT system (VEG210C1) the sample was first placed under the objective (OCT-LK4 objective). The system was started in the 2D mode with a scanline intersecting the sample. The sample's surface was then brought into focus and shifted using the reference stage to highlight the region of interest and to set further parameters. The amplification and reference intensity were then set to provide the highest signal without introducing image artifacts. The polarizing filters were then adjusted to optimize the signal intensity and minimize image artifacts. For a 2D image the averaging and z depth were then set, and the image was acquired at this point. For a 3D volume the mode was switched to 3D then the x, and y pixel dimensions were set to provide sufficient resolution while allowing for averaging and the amount of averaging was set (typically 16.22 µm or 20 µm with 10 averages). Finally, the image was acquired. When utilizing the OCT mounted to the bioprinter for in situ imaging this same process was executed after the printer automatically positioned the scan head and paused for imaging. Acquired images were exported as 32-bit Tiff files for further processing.
2.6. Printing both bioink and gelatin microparticle support bath with in situ imaging
To generate print pathing for multimaterial printing with in situ imaging we used a combination of open-source software and custom code. First the object to be printed and the volume of gelatin microparticle support bath to be printed were generated using Autodesk Inventor (Autodesk) or acquired from another source. These models were then loaded into Ultimaker Cura (Ultimaker) and processed into G-code using print parameters appropriate to the needle and syringe diameter being used. Next the G-codes were imported into a custom MATLAB script (Mathworks) designed to interleave the support print, the collagen print, and the imaging steps (meshGcode_OCTandSupport.m). The script takes advantage of the ability built into the Duet 3 implementation of G-code to store multiple toolhead positions. Using an index of the layer change comments in the G-code (automatically generated by Cura) the MATLAB script inserts small G-code scripts that use these toolhead positions to swap between extruder 1 (bioink), extruder 2 (gelatin microparticle support bath), and the OCT scan head. This custom script also allows for selection of the number of initial layers of gelatin microparticle support bath prior to initializing the collagen print and the number of layers of collagen to print prior to a new layer of support. The OCT scan head is also automatically raised by the thickness of the new layers printed to maintain focus on them.
Prior to printing, the high contrast collagen bioink is centrifuged at 3000 g for 5 min in a 10 ml plastic biosciences (BD) syringe and 450 µl is transferred to a 500 µl Hamilton gastight syringe. The plain gelatin microparticle support bath is centrifuged at 2000 g for 5 min in a 10 ml plastic BD syringe and is transferred to a 10 ml Hamilton gastight syringe. These inks, in their syringes, are loaded into their dedicated Replistruder 5 syringe pumps. Then, using the tip of the needle to measure the width and height, the first needle is aligned to the center of the print dish. For this first tool the origin is set using the G92 command. The first toolhead (T0) position is then set using the G10 command. Next, the second extruder's needle is centered on the dish and the position is again recorded using the G10 command, but for the second toolhead (T1). Finally, the OCT is aligned by centering its objective on the dish. Next the Z positions must be set. The first extruder (T0) is touched off to the bottom surface of the print dish and the G92 and G10 commands are used to set its Z offset. This process is repeated with the second extruder (T1) and the G10 command. Finally, the OCT is shifted in Z until the boundary at the bottom of the dish is in focus and the G10 command is used to set the offset of the focal plane. At this point the Duet 3 knows all the relative positions of the tools attached to the Z axis and is ready to print.
The second extruder (T1) is then returned to the center of the dish, using the measured offsets from the alignment process. Plastic dishes are filled with DI water (for collagen bioink) or 50 mM HEPES (for support ink) and placed such that the inactive extruder needle is submerged (to prevent drying out and clogging). At this point the print can be initiated by selecting the G-code on the Duet 3 interface. When the printer reaches the first pause for imaging the user can acquire an image using the Vega OCT's PC and then reinitiate printing using the Duet 3 interface.
2.7. Index of refraction measurement
Index of refraction measurements for iodixanol solutions were taken using a Hanna Instruments digital refractometer (HI96800). Briefly the refractometer was calibrated using deionized water, then the sample of interest was placed on the flint glass for measurement. The sample was allowed to equilibrate in temperature with the steel ring of the refractometer. Measurements were repeated until the 4th digit was consistent across measurements.
2.8. Identification of gelatin microparticle support bath index of refraction
Plain gelatin microparticle support bath was prepared as described above. A high viscosity pipette was used to transfer 100 ul of compacted gelatin microparticle support bath into 2 ml of prepared iodixanol solutions ranging from 0% to 60% in a 12 well plate. The support was then dispersed thoroughly within the iodixanol solutions using clean pipette tips. Coverslips were used to trap the particles against the bottom of the well, which was necessary as iodixanol solutions above 30% were denser than the gelatin microparticle support bath and floated the particles. Images were then acquired using a Nikon Eclipse TS100 microscope using a 20X phase objective and a Photometrics CoolSnapES camera run by MicroManager. The images were captured with identical exposure and illumination settings to allow for direct comparison.
The iodixanol solutions were measured with our digital refractometer as described previously. To compare the particle clarity at different indices of refraction the peak to trough difference of the high contrast phase boundary was quantified using a line scan analysis in FIJI ImageJ software for n = 13 particles in each image. Then the absolute value of this was plotted against the refractive index to identify the refractive index and iodixanol concentration that resulted in the clearest support solution.
2.9. Clear FRESH gelatin microparticle support bath generation
To produce clear gelatin microparticle support bath using iodixanol the initial process is the same as plain support described above except 250 mM HEPES is used instead of 50 mM HEPES. After the plain support is prepared for printing (e.g. centrifuged at 2000 g for 5 min and supernatant removed), the supernatant is poured out and the remaining supernatant is absorbed with Kim wipes. The desired final concentration of iodixanol ranged from 47.5% to 50% for optimal clarity and print characteristics, here we describe bringing the concentration to 50%. First, iodixanol reused from previous support preparations, at roughly 50%, is measured using our Hanna Instruments digital refractometer. The refractive index is utilized to determine the exact iodixanol concentration. Sufficient iodixanol is added to the support to bring the mass ratio of iodixanol to 26% (mass ratio of 1:1.1 support:∼50% iodixanol). The solution is then vortexed. After mixing the 26% iodixanol support is centrifuged at 3500 g for 5 min. After compaction, the iodixanol supernatant is removed. At this point new 60% iodixanol is added at a mass ratio sufficient to bring the final solution up to 50% iodixanol (mass ratio of 1:2.3 support:60% iodixanol). This 50% iodixanol support solution is backfilled into capped 10 ml BD syringes (with plungers removed) and placed in a vacuum chamber for 15 min. The open barrel of the syringe was sealed with parafilm and then the syringes were centrifuged at 3500 g for 15 min. After centrifugation, the denser iodixanol is on the luer lock side of the syringe, covered by the compacted, clear gelatin microparticle support bath. A plunger is reintroduced into the backside of the syringe using a thin wire to allow for the passage of air. The iodixanol solution is removed to another 10 ml BD syringe using a luer coupler and collected for later use in the first iodixanol wash. After the iodixanol has been removed, the clear gelatin microparticle support bath is collected into as few BD syringes as can hold the total volume. The support is transferred back and forth 50 times between these syringes to homogenize the mixture. Finally, the support is transferred to new 10 ml BD syringes with their plungers removed. The open barrel is covered with parafilm and the syringes are centrifuged at 3500 g. The plungers are reinserted, again using a wire to break the seal, and the support is ready for use.
2.10. Absorbance spectra measurement
To measure the absorbance of different gelatin microparticle support bath preparations we used a spectrophotometer (Molecular Devices SpectraMax i3x). For each preparation, an equal volume of gelatin microparticle support bath was deposited into the wells of a standard clear 24 well plate (thus producing an equal thickness). The spectrophotometer was set to acquire absorbance spectra from 230 nm to 980 nm in 30 nm steps for each filled well. The plastic dish absorbed light from 230–400 nm and so this range was excluded from the analysis. Measurements were taken at a consistent temperature of 24 °C.
2.11. Printing in clear gelatin microparticle support bath with in situ imaging
Generating print pathing for printing in clear gelatin microparticle support bath with in situ imaging is very similar to printing both the bioink and the support. Ultimaker Cura is utilized to generate the print pathing for the object to be printed. Next the G-code is imported into a custom MATLAB script (Mathworks) designed to interleave the collagen print and the imaging steps (meshGcode_OCT.m). The resulting G-code is uploaded to the Duet 3 printerboard via a universal serial bus (USB) flash drive.
Prior to printing, the dish is filled with clear gelatin microparticle support bath and the top surface is scraped flat using a 20 mm × 20 mm square 1.5 coverslip. The top surface of the support is then covered in a layer of light mineral oil to prevent drying out (Fisher Scientific). Next the offset between the bioink toolhead (T0) and the OCT scan head (T2) is measured as previously described and stored using the G10 tool offset command. The bioink extruder (T0) is then returned to the center of the dish, using the measured offsets from the alignment process. A plastic dish is filled with deionized (DI) water (for collagen bioink) and placed such that the inactive extruder needle is submerged (to prevent drying out and clogging during imaging). At this point the print can be initiated by selecting the correct G-code on the Duet 3 interface. When the printer reaches the first pause for imaging the user can acquire an image using the Vega OCT's PC and then reinitiate printing using the Duet 3 interface.
2.12. 3D model creation
All models were created using Inventor Professional 2020 (Autodesk) or downloaded from online repositories. For the benchmark model and the 3D mixing model, the entire model was generated in Inventor then exported as an STL for printing. The vestibular apparatus was sourced from https://vestibularfirst.com/how-to-print-3d-vestibular-apparatus/ and was derived from magnetic resonance imaging (MRI) data acquired by the University of Dundee School of Medicine (https://sketchfab.com/3d-models/anatomy-of-the-inner-ear-f80bda64666c4b8aaac8f63b7b82a0a0). The circle of Willis, derived from MRI data, was sourced from the National Institutes of Health (NIH) 3D Print Exchange (Model ID 3DPX-002604). The brain stem model, derived from MRI data, was sourced from the NIH 3D Print Exchange (Model ID 3DPX-003892). The kidney model was sourced from the University of Pittsburgh School of Medicine.
2.13. Image analysis
To assess SNR in OCT images they were first opened in FIJI ImageJ. Then areas of the image with high signal and adjacent areas of background were sampled. The resulting averages and standard deviations for each area were utilized in the equation  to calculate the signal to noise ratio, where
  is the average of the signal,
  is the average of the background, and
  is the standard deviation of the background [28].
To assess the signal intensity at different depths in plain and clear gelatin microparticle support bath a plastic dish was created with a sloped bottom that allowed for imaging through increasing depths of gelatin microparticle support bath. Images of the bottom of the dish were acquired using plain and clear gelatin microparticle support bath at the same imaging settings. Images were opened in FIJI and converted to 16-bit TIFFs using the same range of intensity values prior to conversion. The images were scaled to match each other, then regions of the same size were sampled at equivalent depths in each image. The resulting averages were utilized to create a curve of intensity as a function of depth for plain and clear gelatin microparticle support bath.
To assess the quality of the printed resolution test object the acquired OCT images were opened in FIJI. The images were corrected for rotation about the x, y, and z axes. Cropped views of the middle 50% along the channel axis and 25% perpendicular to it were extracted from the images. These images were then 3D-median filtered with a 5-pixel filter width. The background intensity in the center of the channel was measured and used to perform background subtraction. The images were then automatically thresholded. The images were cropped to only include the channels and their walls. These stacks were saved and then imported into a custom MATLAB script that measured the width of the channel at each row in each slice of the segmented images and reported the average value of this width for all slices.
2.14. OCT image composites
To combine multiple OCT image stacks acquired throughout printing into a single composite image the pairwise stitching plugin was used in FIJI ImageJ with subpixel accuracy and linear gradient or maximum intensity fusion options set [29]. First the raw images were rotated to orient the print to the pixel x, y, and z axes. Next the images were cropped to include the full last layer and the bottom of the print. These images were then resliced to a view perpendicular to the Z axis. The first stitching was performed with the first and second captured OCT stacks. The second stack was cropped to have approximately 10% overlap with the first. Overlapping regions of interest were highlighted to aid the plugin in registration. In subsequent stitching steps the same process was repeated but using the previously stitched image and the next stack to be incorporated, until the last stack was incorporated.
2.15. Gauging
To perform quantitative gauging of printed objects using the OCT images a full model of the printed object needed to be extracted. To do this the OCT images, either one acquired at the end of printing or a composite of multiple acquired throughout printing, were loaded into FIJI. These stacks were then filtered using the 3D-Median filter with a filter width of 3 pixels. The background subtraction tool was then used to remove background if necessary. The images were then converted into 16-bit tagged image format (TIFs) and the histogram equalization was used. Local automatic thresholding was utilized to isolate the image data, using the savola method. Next erroneous spots were removed using the outlier removal tool. Finally, the segmented image stack was exported as a TIF file.
The TIF file was imported into 3D Slicer (www.slicer.org/). The integrated segmentation tools were used to isolate the print. The segmentation was manually edited to remove artifacts and islands and was then smoothed using a median filter with a 3 pixel width. After smoothing the reconstruction was exported as an stereolithography (STL) file using the built-in exporter, taking care to set the pixel size to match the known pixel dimensions from OCT acquisition.
The reconstruction was loaded into 3D builder (Microsoft), where scaling was verified, and the mesh was simplified to aid with future processing. After saving the simplified mesh the reconstructed object was loaded, along with the digital model STL (which was used to generate the G-code for printing the object) into CloudCompare (www.cloudcompare.org/) [30]. Using built in tools the two objects were oriented relative to each other, registered, then surface deviations were calculated. This information was exported as false color images as well as mean and standard deviation.
2.16. FRESH printing fibrin and cellular fibrin bioinks
Acellular fibrinogen bioinks were prepared by dissolving bovine fibrinogen (Sigma, 341 573) at 60 mg ml−1 in 1 × pPBS) in a cell culture incubator overnight. The solution was loaded into a 500 µl gastight syringe (Hamilton, 81222) and extruded from a 30 gauge 0.5-inch blunt tip needle (Jensen Global, JG30-0.5HPX). C2C12 fibrin bioinks were prepared using methods adapted from those developed by Lee et al [3, 4]. Briefly, C2C12 mouse myoblast cells (ATCC, CRL-1772) were cultured in Dulbeccos Modification of Eagles Medium (Dulbecco's modified eagle medium(DMEM) 1x) with high glucose (Corning, 15-013-CM) supplemented with 2 mM L-glutamine (Thermo Fisher, 25030081), 100 U ml−1 penicillin-streptomycin (Thermo Fisher, 15 140 122), and 10% v/v fetal bovine serum (VWR, 89510-186). Cells were prepared for bioink generation by passaging at 90% confluency, resuspended in DMEM/F12 with 15 mM HEPES (Thermo Fisher, 11320082) to achieve 30 mg ml fibrinogen and transferred to a BD 1 ml syringe. The bioink cell density was enriched by centrifugation at 200 rcf for 5 min, the supernatant was removed then transferred to a Hamilton 500 µl gastight syringe for printing. For the cell viability studies, 1 ml of cellular bioink was supplemented with 2 µM calcein additive manufacturing (AM) and 4 µM ethidium homodimer and mixed into the cell bioink prior to centrifugation.
2.17. Filament analysis
OCT images from benchmark prints of different conditions were opened in FIJI. The images were oriented such that filaments of interest were aligned along the depth of the stack. Regions of interest encompassing each filament were cropped from the image. Automatic thresholding was then executed using Otsu's method. At this point each thresholded image in the stack corresponded to a single cross section of the filament of interest. Each cross section was then assessed for feret diameter and minferet diameter using the built-in particle analysis in FIJI. The diameter for each filament was estimated as halfway between these two measurements.
2.18. 3D visualization in imaris
We used Imaris (Bitplane, 9.5.1) for 3D rendering of the raw OCT data. The TIF file from the OCT data for each anatomic model was imported into Imaris. A surface object was created using the surface wizard function with local background subtraction and filtered using the 'quality' filter to remove small non-specific objects. A mask of the surface object was created to act as a passthrough filter for the original OCT data to remove non-specific background from the 3D image. 3D renders of the background removed OCT data and the x-ray view of the surface object were exported as TIF images. Built in animation functionality was then used to make movies showing the internal features and highlighting internal complexity within the printed objects.
2.19. Live/dead cell viability
Cell viability was quantified using the Live/Dead fluorescence staining kit (Invitrogen #L3224). The Live/Dead reagents were added to the cell bioink per manufacture's recommended concentrations prior to printing into the plain and iodixanol cleared support bath. After print completion, constructs were imaged using nikon imaging software (NIS) Elements on an upright Nikon FN1 equipped with an A1R HD confocal microscope with resonant scanner, 488 and 555 nm laser lines, green fluorescent protein (GFP) GaAsP and red fluorescent protein (RFP) GaAsP detectors, a Prior motorized XY stage and Z nose piece, and a 4X CFI Plan Apo Lambda Air (0.2 NA, 20 mm WD) objective. Large 3D (500 µm in Z) tile scans covering the entire printed constructs were acquired at both 1.5 and 3 h post-printing. Live/Dead analysis was performed in Imaris (Bitplane, 9.5.1) using the Spots detection function to identify the cells stained for the Live and Dead signal. For improved consistency, quality parameters (275 = Live, 100 = Dead) and size (20 µm) were set for each sample. Percent viability in the iodixanol cleared support was calculated as the number of Live cells/total cell number (Live + Dead) for each sample. Graphical and statistical analysis was performed in Prism 9 (Graphpad).
2.20. Statistics and data analysis
Statistical and graphical analyses were performed using Prism 9 (GraphPad) software and Excel (Microsoft v16). Statistical tests were chosen based on the experimental sample size, distribution, and data requirements. For comparison of SNR between benchmark models in plain gelatin microparticle support bath, gelatin, and water, Wilcoxon paired signed-rank tests were used (figure 1(I)). For analysis of measured width of the benchmark imaged in water the Pearson correlation coefficient was calculated (figure 1(J)). For comparison of SNR between benchmark models in plain support using plain and high contrast collagen, Wilcoxon paired signed-rank tests were used (figure 2(B)). For comparison of SNR between last image and composite image of benchmark models in plain support using high contrast collagen, Wilcoxon paired signed-rank tests were used (figure 2(H)). For comparison of embedded and released dimensions of benchmarks printed in plain support, Student's two-tailed unpaired t test was used (figures 2(J)–(L)). For comparison of OCT signal in plain and clear gelatin microparticle support bath at all depths, 2-way analysis of variance (ANOVA) with Tukey's multiple comparisons was used (figure 3(G)). For comparison of absorbance in plain and clear gelatin microparticle support bath at all depths, 2-way ANOVA with Tukey's multiple comparisons was used (figure 3(H)). For comparison of SNR of plain collagen and high contrast collagen in clear gelatin microparticle support bath, Student's two-tailed unpaired t test was used (figure 3(J)). For comparison of SNR between last image and composite image of benchmark models in clear gelatin microparticle support bath using high contrast collagen, Wilcoxon paired signed-rank tests were used (figure 4(B)). For analysis of measured width of a benchmark printed in printed support after release, the Pearson correlation coefficient was calculated (figure S2(B)). For analysis of measured width of a benchmark printed in clear gelatin microparticle support bath after release, the Pearson correlation coefficient was calculated (figure S6(B)). Preparation of figures and visuals was completed in Adobe Photoshop and Illustrator CS6 and CC. OCT images were edited in FIJI and Imaris. 3D Reconstruction of OCT images was completed using 3D Slicer (www.slicer.org/). Gauging was accomplished using CloudCompare (www.cloudcompare.org/). Additional image analysis and quantification was performed in MATLAB (Mathworks).
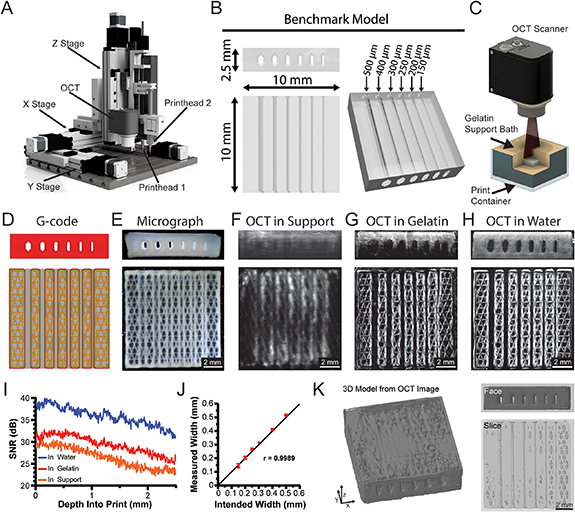
Figure 1. Design and integration of optical coherence tomography (OCT) into the FRESH printing platform. (A) 3D render of a custom-designed high-performance 3D bioprinter with dual extruders and an OCT scan head. (B) A benchmark model with internal channels of varying widths to test printer performance, resolution capabilities, and imaging quality. (C) Example rendering of OCT imaging of a FRESH printed construct within the gelatin microparticle support bath. (D) G-code 3D printer pathing of benchmark model channel cross sections. (E) Photomicrograph of the benchmark model FRESH printed from collagen I showing end on and top-down views. (F–H) OCT imaging of the benchmark model in the gelatin microparticle support bath, melted and resolidified gelatin, or water, respectively. (I) Analysis of the OCT SNR for the collagen benchmark model within either gelatin microparticle support bath, melted and resolidified gelatin, or water. All three SNR curves are statistically significantly different from each other (p < 0.0001, n = 12 total measurements from three benchmark prints each, Wilcoxon signed-rank test). (J) Correlation between the intended internal channel width and the measured width via OCT (n = 4, Pearson's correlation of r = 0.9989). (K) Images of the 3D OCT image data showing the full 3D reconstruction, an end on face view, and a cross-section slice through the internal channels.
Download figure:
Standard image High-resolution image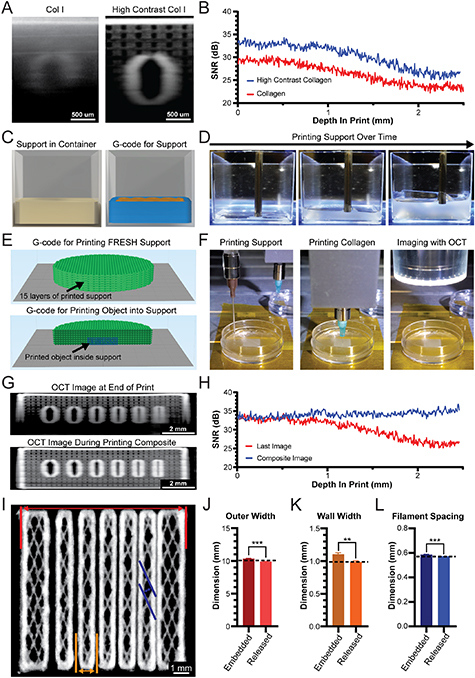
Figure 2. Development of a high contrast collagen bioink and printing of gelatin microparticle support bath to improve embedded OCT imaging. (A) OCT image cross-section of benchmark model channel printed from collagen I or high contrast collagen I embedded in the FRESH gelatin microparticle support bath. (B) OCT SNR analysis for a collagen and high contrast collagen benchmark model within the gelatin microparticle support bath. The two SNR curves are statistically significantly different from each other (p < 0.0001, n = 9 total measurements from three benchmark prints each, Wilcoxon signed-rank test). (C) 3D render of FRESH gelatin microparticle support bath within a print container (left) and layer-by-layer G-code (right). (D) Time-lapse images of gelatin microparticle support bath printing. (E) G-code for printing the gelatin microparticle support bath (top) and for printing an object inside of the gelatin microparticle support bath (bottom). (F) Stepwise process of printing the support bath, printing multiple layers of a collagen construct inside of the support bath, and OCT image acquisition. (G) OCT imaging performed at the end of the print (top) or intermittently during printing to produce a composite image (bottom). (H) OCT SNR for image acquired at the end of print (Last Image) or by compositing in situ OCT images (Composite Image). The two SNR curves are statistically significantly different from each other (p < 0.0001, n = 9 total measurements from 3 benchmark prints each, Wilcoxon signed-rank test). (I) Composite OCT cross-section image for evaluation of print fidelity in terms of outer width (red), channel wall width (gold), and filament spacing (blue). (J) OCT measured outer width while the print was embedded in the gelatin microparticle support bath or following print release (mean ± STD.; n = 3 prints, measurement at every x linescan in yz stack, embedded vs. computer aided design (CAD) P = 0.0095, Released vs. CAD P = 0.0606, Embedded vs. Released P = 0.0004 [***] by Student's two-tailed unpaired t test). Dashed line represents the 3D model expected value. (K) OCT measured wall width while the print was embedded in the gelatin microparticle support bath or following print release (mean ± STD.; n = 3 prints, highlighted wall measured at every x linescan in yz stack, embedded vs. CAD P = 0.0179, Released vs. CAD P = 0.3448, Embedded vs. Released P = 0.0026 [**] by Student's two-tailed unpaired t test). (L) OCT measured filament spacing while the print was embedded in the gelatin microparticle support bath or following print release (mean ± STD.; n = 3 prints, 12 filaments each, embedded vs. CAD P = 0.0418, Released vs. CAD P = 0.0002, Embedded vs. Released P = 0.0008 [***] by Student's two-tailed unpaired t test).
Download figure:
Standard image High-resolution image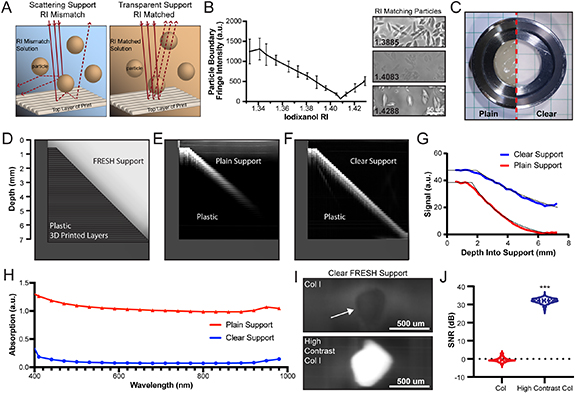
Figure 3. The transparent gelatin microparticle support bath increases OCT signal to noise and penetration depth. (A) For FRESH embedded printing, the gelatin microparticle support bath has an opaque appearance due to light scattering from the difference in RI between the particles and fluid phase solution. When the fluid phase RI matches the RI of the particles less light is scattered and absorbed which increases the gelatin microparticle support bath transparency. (B) Analysis of phase contrast imaging of gelatin microparticles' boundary fringe intensity in solutions of iodixanol. Example images of gelatin microparticles in iodixanol at the RI inflection point. (C) Plain (left) vs the 'clear' (right) gelatin microparticle support bath. (D) Schematic of a sloping 3D printed plastic well designed to determine the OCT penetration depth through gelatin microparticle support bath by visualizing the printed layers throughout the well depth. (E) OCT image through plain gelatin microparticle support bath. (F) OCT image through clear gelatin microparticle support bath. (G) Exponential fit and analysis of OCT signal penetration depth for plain (k = 0.4135) and clear gelatin microparticle support baths (k = 0.1709). There is a significant difference between both curves at all depths (p ⩽ 0.0003, n = 4 containers each, two-way ANOVA with Tukey's multiple pair-wise comparisons). (H) Absorption spectra for plain vs. clear gelatin microparticle support baths. Both curves are significantly different at all wavelengths (p < 0.0001, n = 6 wells, 2-way ANOVA with Tukey's multiple comparisons). (I) FRESH printed collagen I (top) and high contrast collagen I (bottom) filaments printed in clear gelatin microparticle support bath. (J) Analysis of the OCT SNR between collagen I and high contrast collagen I printed in clear gelatin microparticle support bath (mean ± STD.; n = 374 measurements along filament, P < 0.0001 [***] measured by Student's two-tailed unpaired t test).
Download figure:
Standard image High-resolution image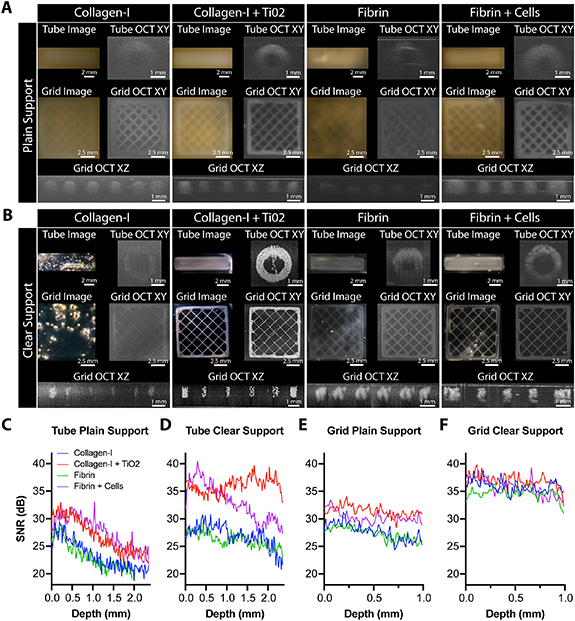
Figure 4. Comparison of OCT image quality and SNR for various bioinks in plain and clear FRESH support baths. (A) A tube and grid model FRESH printed into the plain gelatin microparticle support bath from collagen I, collagen I + TiO2, fibrin, and fibrin + cells. 2D top-down images and cross-sections through the 3D OCT images highlight the changes in image quality and OCT signal for the materials. (B) The tube and grid model printed in iodixanol cleared FRESH support bath for all bioinks. 2D top-down images and cross-sections through the 3D OCT images highlight the improved clarity of the support bath and enhanced visual image quality and OCT signal for collagen I + TiO2 and fibrin + cells. (C) Quantitative analysis of the OCT SNR for both the tube and grid models in plain and clear support (n = 3 total measurements from each model condition).
Download figure:
Standard image High-resolution image3. Results
3.1. Integration of OCT into a high-performance 3D bioprinter
Current 3D bioprinters lack real-time monitoring and cannot assess the 3D structure of printed constructs in situ. To address this, we designed and built a high-performance 3D bioprinter with an integrated OCT scan head for in-situ volumetric imaging during printing (figures 1(A) and S1). For 3-axis motion, the printer utilized a gantry configuration of four high-precision stages capable of positional accuracy of 8 µm over a 100 mm travel range. In addition to the OCT scan head, the bioprinter incorporated two Replistruder 5 syringe pump extruders, updated from the previously published Replistruder 4 open-source design [31]. The Replistruder 5 has improvements over previous versions including (a) a lead screw used with a geared stepper motor to increase the accuracy and precision of deposition, (b) increased rigidity in a narrower frame, and (c) mounting components that incorporate flexure-based clamps to make changing syringes faster (figure 1(A)). With these changes, the 3D bioprinter performance was significantly improved compared to previously published open-source bioprinters based on desktop-grade thermoplastic extrusion printers [5, 32]. While these low-cost printers have adequate performance for a wide range of bioprinting applications [3–5, 33]; the positional accuracy is limited by their belt and pully driven motion system and is on the order of ±100 µm [34]. For the 3D bioprinter developed here, we measured mean errors of 1.4 µm in the X-axis, 2.1 µm in the Y-axis, and 1.8 µm in the Z-axis over a 1 cm3 travel range.
To assess printing resolution and OCT imaging capabilities, we developed a benchmark model with six open channels ranging from 150 up to 500 µm in width, individual filaments as small as ∼87 µm in diameter (based on the extrusion needle inner diameter), and overall construct size up to 10 mm (figure 1(B)). This benchmark was designed to be imaged with the integrated OCT scan head during printing while embedded in the FRESH gelatin microparticle support bath (figure 1(C)). For printing, the benchmark model was processed into G-code using open-source slicer software for the bioprinter to execute (figure 1(D)). Once FRESH printed from a collagen type I bioink, the benchmark model was released from the gelatin microparticle support bath, washed to remove melted gelatin, and imaged with a camera (figure 1(E)). This serves as an example of the standard way 3D printed scaffolds are analyzed using microscopy or photography and while this approach demonstrates that all channels are visibly open on the exterior surface, it provides minimal information on the internal structure and print fidelity.
Next, we evaluated OCT imaging of the benchmark model (a) in the gelatin microparticle support bath, (b) in melted and resolidified gelatin, and (c) in water. We began by imaging the benchmark model while it was still embedded in the highly light-scattering gelatin microparticle support bath (figure 1(F)). While the channels were generally visible, OCT image fidelity was considered poor as printed filaments within the image were at least 2-times larger and less defined than in the optical micrograph (figure 1(E)). Here we define a high-fidelity OCT image as having less than a 10% difference in measured sized as compared to the known dimensions. To improve OCT image quality, we melted the microparticles and resolidified the gelatin before capturing another OCT image (figure 1(G)). This resulted in the benchmark model being embedded within a transparent block of gelatin, enabling capture of high-fidelity images and clear identification of the infill, channel lumens, and single filaments (diameter of 86.78 ± 9.69 µm). However, the OCT signal decayed throughout the depth of the print such that the bottom layers could not be resolved. Finally, to remove any influence of the gelatin on image quality, we imaged the released benchmark model in water (figure 1(H)). In this case all channels and features of the G-code are clearly resolved throughout the depth of the print, resulting in a high-fidelity image with filaments measuring 94.50 ± 10.77 µm compared to the 87 µm filament diameter defined in the G-code. A side-by-side comparison for the benchmark model imaged in (a) the gelatin microparticle support bath with poor quality beyond 500 µm in depth, (b) resolidified gelatin with improved transparency but signal loss beyond 2 mm in depth, and (c) water with higher contrast and sharper features throughout the depth, highlights the major effects of scattering and transparency on OCT image quality (supplementary movie 1).
To quantify the quality of the OCT images acquired in different media (figures 1(F)–(H)) we utilized the SNR formula  , where
  is the average of the signal,
  is the average of the background, and
  is the standard deviation of the background [28]. This analysis shows a linear decay in SNR with an average 6 dB higher SNR in water compared to embedded in gelatin and an average 9 dB higher SNR in water compared to embedded in the gelatin microparticle support bath (figure 1(I)). The SNR of the benchmark imaged with OCT in water (figure 1(H)) was used to measure all channel widths using a custom MATLAB image analysis script and validated that the intended width for all channels matched the measured width from OCT with a Pearson's correlation of r = 0.9989 (figure 1(J)). The 3D nature of the OCT images also allowed for full internal and external feature segmentation and 3D reconstruction of the printed benchmark model (figure 1(K)). The face-on and top-down views show the infill pattern as well as the internal channels. The isometric view of the bottom layers shows that the decay in SNR creates some difficulties when segmenting the full print, resulting in an incomplete reconstruction as depth increases. Together these data show the high performance of our custom 3D bioprinting platform to print 150 µm wide open channels, ∼90 µm single filaments, and the potential of integrated OCT imaging for analyzing FRESH printed constructs, but that signal quality in the gelatin microparticle support bath must be significantly improved for in situ imaging.
3.2. Image quality is improved with high contrast collagen and sequential imaging
As a next step to improve OCT image quality we incorporated titanium dioxide (TiO2) into the collagen bioink as a contrast agent [35]. We selected TiO2 since it has been used in OCT imaging due to its enhanced light scattering properties and low absorption at infrared wavelengths, and because it is a biologically inert compound food and drug administration (FDA)-approved for use in drugs and medical devices [36, 37]. Printing the benchmark model using standard and high contrast collagen bioinks showed a clear improvement in image quality throughout the full depth (figure 2(A)), quantified as a 3–4 dB increase in SNR with the TiO2 (figure 2(B)). However, the OCT SNR continued to decrease as a function of depth, which prevented imaging of the entire benchmark model by OCT when embedded in the gelatin microparticle support bath.
Due to the increased SNR of the high contrast collagen within the first 1 mm of the gelatin microparticle support bath, we sought to reduce the depth of support that must be imaged through to improve the overall OCT image quality. Instead of prefilling a container with the gelatin microparticle support bath [3–5], we printed the gelatin microparticle support bath using a second printhead (figure 2(C) that filled the container in a layer-by-layer manner at defined intervals during printing (figure 2(D)). To do this, we developed a custom MATLAB code that interleaves the G-code for the gelatin microparticle support bath and the G-code for the construct to be printed (figure 2(E)). In sequential steps, the gelatin microparticle support bath is first deposited in a layer 1–2 mm thick, then a section of the construct is printed with high contrast collagen into the printed support bath, and finally the OCT scan head is positioned over the print to acquire an image (figure 2(F)). Throughout the printing process, OCT 3D images are acquired after every 10 layers of printed collagen, followed by printing a new layer of gelatin microparticle support bath of comparable thickness (supplementary movie 2). This ensures that a maximum depth of gelatin microparticle support bath (∼1 mm) is above the print when acquiring each OCT image. All acquired OCT 3D images are then stacked and registered in 3D and then stitched together to form a complete composite OCT 3D image stack of the entire printed construct [29]. The composite OCT image shows visual improvement in signal quality, specifically as depth increases (figure 2(G), supplementary movie 3). Quantitatively, for the composite OCT image the SNR no longer decays as depth increases, and by 2 mm in depth shows an improvement of >10 dB (figure 2(H)).
Using this high-fidelity 3D dataset, the printed construct was evaluated in terms of overall size, width of the inner walls, spacing between filaments, and single filament diameter (figure 2(I)). For the overall construct size, defined as 10 mm in the CAD file, the OCT measured size for both embedded and released constructs was within 0.5 mm (figure 2(J)). For the inner wall width of 1 mm, the OCT measured size for both embedded and released constructs was within 0.1 mm (figure 2(K)). For the filament spacing of 550 µm, the OCT measured size for both embedded and released constructs was within 30 µm (figure 2(L)). In all of these cases, OCT measurements for embedded and released constructs were in close agreement, but also revealed small, statistically significant differences (figures 2(J)–(L) and S2). The single filaments in the constructs should nominally be ∼87 µm in diameter and were measured as 90 ± 5 µm. These results demonstrate the ability to combine (a) high contrast collagen bioink, (b) sequential printing of the gelatin microparticle support bath, and (c) sequential OCT imaging, that together achieve improved image quality and quantitative dimensional analysis.
3.3. Image quality is improved by increasing transparency of the gelatin microparticle support bath
The light scattering by the FRESH gelatin microparticle support bath has always made it challenging to visualize constructs during the printing process. This stems from a difference in the refractive indices (RI) of the gelatin microparticles and the surrounding aqueous medium. To reduce scattering and improve transparency we needed to increase the RI of the surrounding water (1.333) to match the RI of the microparticles (figure 3(A)) [38, 39]. We initially replaced the aqueous buffer with a higher RI biologically compatible solution called histopaque (a mixture of polysucrose and sodium diatrizoate). However, the RI of the highest concentration histopaque (1.367) available was not sufficient to match the RI of the microparticles and only slightly improved transparency (data not shown). We next looked at histopaque components starting with high concentration polysucrose; however, at the concentrations necessary for RI >1.367, the solution viscosity increased considerably, and was incompatible with the yield stress behavior required for the FRESH gelatin microparticle support bath [40]. We did not evaluate the other component of histopaque, sodium diatrizoate, because it is not iso-osmolar and therefore could alter the gelatin microparticle swelling and potentially lead to cytotoxicity when printing cells.
When looking for a cell compatible compound that had higher RI, low viscosity and was iso-osmolar, we identified iodixanol as a viable option. Iodixanol is a non-ionic, iso-osmolar chemical used as an x-ray computed tomography contrast agent [41]. It has a high RI and is cell and tissue compatible, endotoxin free, and comes as a 60% solution in water at a RI of 1.429 [42]. It has also recently been utilized for optical tuning of hydrogels in bioprinting [43]. To determine the RI required to achieve a transparent FRESH support bath we placed the gelatin microparticles within increasing concentrations of iodixanol with RI ranging from 1.333 to 1.429 and captured phase contrast images. By analyzing the fringe boundaries of the microparticles and the point at which they disappeared, we determined that the microparticles had an RI of 1.4083 (figures 3(B) and S3). Preparing the FRESH support bath with iodixanol at this RI resulted in a highly transparent gelatin microparticle support bath (clear support), evident with a checkered background easily seen through a filled Petri dish (figure 3(C)).
To evaluate OCT penetration depth in the clear gelatin microparticle support bath we 3D printed a plastic container with a sloping bottom and filled it with either plain or clear gelatin microparticle support bath. This enabled quantification of OCT image quality and signal as a function of imaging depth (figure 3(D)). When imaging through the plain gelatin microparticle support bath the image quality degrades after 2 mm and the bottom of the dish at 7 mm cannot be observed (figure 3(E)). In contrast, when imaging through the clear gelatin microparticle support bath the image quality is improved and the bottom of the dish at 7 mm can be resolved (figure 3(F), supplementary movie 4). In both cases there was an exponential decay of signal as a function of depth as expected; however, the signal decayed faster in the plain (k = 0.4135) versus clear (k = 0.1709) gelatin microparticle support bath (figure 3(G)). Absorbance spectral analysis showed improved transparency for the clear gelatin microparticle support bath throughout the visible–IR wavelengths (figure 3(H)) with a decrease in absorption of 91.4 ± 2.3% (mean ± std) compared to plain gelatin microparticle support bath.
An issue with the clear support bath is that the iodixanol used to match the RI of the gelatin microparticles also causes optical clearing of the collagen bioink. Specifically, because gelatin is a denatured form of collagen the optical properties are similar and collagen filaments FRESH printed in the clear support bath have minimal contrast difference with the surrounding gelatin microparticles (figure 3(I)). To address this, the high contrast collagen bioink with TiO2 was FRESH printed in the clear gelatin microparticle support bath and showed a significant increase in contrast compared to the collagen bioink with no contrast agent added (figure 3(J)). Quantifying this difference showed a >30 dB increase in SNR when use the high contrast collagen bioink in the clear support (figure 3(J)). Importantly, this shows that combining the clear gelatin microparticle support bath with the high contrast collagen bioink achieves high quality OCT images at depths of at least 7 mm (supplementary movie S5).
3.4. Image quality is dependent on the type of bioink in the clear support bath
To further investigate the conditions under which iodixanol causes optical clearing of the bioinks being printed, collagen, high contrast collagen, fibrin, and cell-laden fibrin bioinks were compared. CAD models of a hollow tube and square grid we created in order to determine OCT resolution and penetration depth. When printed in plain gelatin microparticle support, the collagen and fibrin tubes were difficult to visualize, and the OCT signal decreased with depth (figure 4(A)). The high contrast collagen was easier to visualize, as expected, and displayed improved OCT image quality. Interestingly, the cell-laden fibrin bioink also had improved OCT image quality within the plain gelatin microparticle support bath when compared to collagen and fibrin, but less than the high contrast collagen. For the square grid, individual filaments could be resolved by OCT for all bioinks with differences in image quality matching that as observed for the tubes (figure 4(A)). In clear gelatin microparticle support the collagen tube was invisible by eye and had minimal OCT signal (figure 4(B)). In contrast, the fibrin tube was visible by eye in the clear gelatin microparticle support with improved OCT image quality and less signal attenuation with depth. The high contrast collagen tube was a further improvement in OCT image quality, with single 150 µm filaments observable in the OCT cross-section, and no signal attenuation with depth. Finally, the cell-laden fibrin tube had improved OCT image quality compared to the collagen and fibrin with no signal attenuation with depth, but showed decreased overall signal compared to the high contrast collagen. For the square grid, individual filaments were resolved in the OCT images for all conditions with improved fidelity for each bioink in clear support as compared to plain support bath.
Next, we quantified OCT image SNR for the tube and square grid for each bioink printed in both the plain and clear gelatin microparticle support baths. For the tube in plain gelatin microparticle support bath, the SNR for the high contrast collagen and cell-laden fibrin bioinks were greater than for collagen and fibrin, but the SNR for all decreased rapidly throughout the depth of the image (figure 4(C)). In clear gelatin microparticle support bath the SNR of the tube printed from collagen and fibrin started with a similar value but decreased less as a function of imaging depth as expected (figure 4(D)). For the cell-laden fibrin tube, there was a substantial increase in SNR due to the clear gelatin microparticle support bath, though SNR did decrease with imaging depth. Finally, the high contrast collagen tube showed a substantial increase in SNR and no decrease in SNR with imaging depth, comparable to the previous results. Similar results for SNR were observed for the square grids in plain gelatin microparticle support bath, with collagen and fibrin yielding a lower SNR than high contrast collagen and cell-laden fibrin bioinks (figure 4(E)). While there is some visual difference in OCT image contrast for the square grids printed in the clear gelatin microparticle support bath between bioinks, all the square grids had increased SNR because of the reduced OCT background signal and lower background standard deviation (figure 4(F)). We also observed minimal decrease in SNR with imaging depth (figure 4(F)). In total, these results suggest that the cells added to the cell-laden fibrin bioink alter the RI and increase scattering in a manner similar to the TiO2 in the high contrast collagen bioink, improving SNR in both the plain and clear gelatin microparticle support bath.
3.5. Cytocompatibility of the iodixanol cleared gelatin microparticle support bath
While the clear gelatin microparticle support bath can improve image quality, the influence of the iodixanol clearing on printed cell viability needs to be assessed. To do this, the C2C12 cells in the cell-laden fibrin bioink were printed in the presence of calcein and ethidium homodimer to determine the number of live and dead cells, respectively. At 1.5 h after FRESH printing we observed a strong fluorescence signal facilitating imaging of the top 500 µm of the printed tube (figure S4(A)). Most printed cells were labeled with the Live dye with few Dead cells throughout the printed tube (figure S4(A)). Similar results were obtained for the grid model demonstrating high cell viability for the printed construct (figure S4(B)). Quantitative spot analysis of the tube and grid construct Live/Dead ratio revealed a 94% viability at 1.5 h and an 89% viability at 3 h after printing at room temperature (figure S4(C)). These data confirm that there is minimal cell death resulting from the FRESH printing process [4] and demonstrate both the utility of the clear gelatin microparticle support bath to facilitate live imaging of an embedded cellular print, as well as the cytocompatibility of the high concentration iodixanol for up to 3 h.
3.6. In situ volumetric imaging and fidelity assessment of FRESH printed constructs
We next evaluated the combined effect of the clear gelatin microparticle support bath, high contrast collagen bioink, and sequential OCT imaging for in situ volumetric imaging. In this case, using clear support means we did not need to print the gelatin microparticle support bath sequentially as it was sufficiently transparent for in process OCT imaging. Imaging the entire construct after printing showed some signal loss with imaging depth >1.5 mm, however this was nearly eliminated by using sequential OCT imaging to create a complete composite image (figure 5(A), supplementary movie 6). This signal loss was not due to the clear support bath, but rather due to imaging through the high contrast collagen construct itself. Quantitative analysis confirmed this result, showing that the sequential OCT imaging minimized the linear decay in SNR observed when acquiring the OCT image only at print completion (figure 5(B)). This effect is qualitatively similar to the previous results with high contrast collagen bioink and printed layers of the gelatin microparticle support bath (figure 2(H)). However, by using clear gelatin microparticle support bath we achieved substantially higher SNR values, resulting in further visual improvement in image quality. Importantly, only in the clear microparticle support bath did the OCT images of high contrast collagen single filaments match the values obtained for collagen single filament imaged in water after release (figure S5(A)). Quantification showed that high contrast collagen filaments imaged by OCT in the plain microparticle support bath appeared much wider than they actually were, but that this issue was absent in the clear support (figure S5(B)). Finally, we confirmed that clearing with iodixanol did not affect the final printed dimensions or interfere with print release, with no noticeable changes in terms of print quality or fidelity (figure S6).
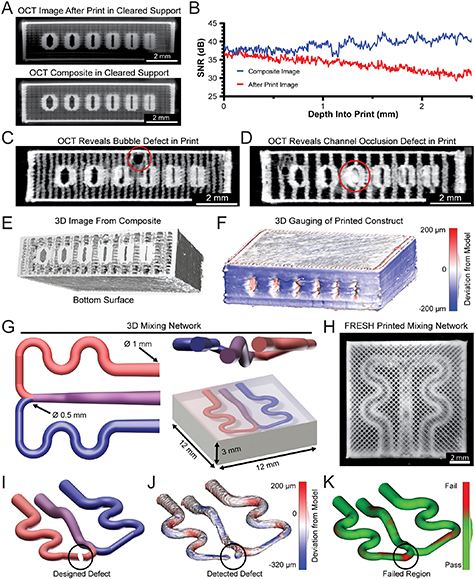
Figure 5. In situ OCT imaging and error detection of FRESH printed constructs. (A) Comparison of OCT imaging in clear gelatin microparticle support bath after print completion (top) or during in situ OCT imaging and composite image creation (bottom). (B) Analysis of OCT SNR after print imaging and during in situ imaging and composite image creation throughout the benchmark model depth. The two SNR curves are statistically significantly different from each other (p < 0.0001, n = 9 total measurements from three benchmark prints each, Wilcoxon signed-rank test). (C) In situ OCT imaging reveals an internal print defect due to an introduced air bubble. (D) Unintentional channel occlusion detected by in situ OCT imaging. (E) 3D reconstruction using composite OCT image of a benchmark model. (F) Quantitative 3D gauging analysis to detect deviations in the reconstruction of the printed model compared to the original computer-generated model. (G) 3D renders of a computer-generated mixing network to highlight FRESH printing and OCT capabilities. (H) Top-down view of a FRESH printed 3D mixing network from collagen I. (I) An engineered defect was designed into the mixing network to mimic a blockage to test the OCT detection capabilities. (J) Quantitative 3D gauging analysis revealing a void at the location of the engineered defect. (K) A pass-fail deviation analysis was implemented to compare the printed and imaged 3D volume to the expected computer model for validation or rejection of the final printed construct.
Download figure:
Standard image High-resolution imageThe combination of high contrast collagen bioink and clear gelatin microparticle support bath also enables measurement of print defects and detection of internal errors. For example, we can identify internal defects and void space, such as an air bubble trapped within the top of the benchmark model during printing (figure 5(C)). Since air has a lower RI of 1.0, trapped air bubbles within the printed constructs appear as a bright spherical signal containing a dark central void that obscures features deeper within. In this case the sequential OCT imaging is critical, as the image below the bubble was captured before the bubble existed and thus can be resolved in the sequentially captured composite image (figure 5(C)). If the OCT image were acquired only at the end of the print, the trapped air would cast a large shadow on features beneath it. In addition to defects such as bubbles, we can also detect over extrusion errors, such as the blockage of a channel that would prevent proper perfusion (figure 5(D)).
Using the composite OCT image, which is a 3D volume, we can also perform image segmentation to produce a full 3D reconstruction of the printed object that contains all internal and external features. This complete 3D reconstruction of the printed construct is then compared to the initial CAD model to quantify spatial deviations using gauging software. Quantitative analysis shows that the printed construct had deviations of −20.9 ± 60.4 µm, with most of this variation coming from the external surface of the construct (figures 5(E), (F) and S7) [30, 44]. While this 3D reconstruction was derived from OCT images captured sequentially, time-lapse OCT imaging performed during printing is also possible (figure S8, supplementary movie 7). Such real-time imaging highlights the potential of utilizing OCT for in situ in-process monitoring and could provide real-time feedback to tune the printing process, allowing for error detection within a single layer rather than waiting and imaging multiple layers.
In addition to basic defects, we can utilize in situ OCT imaging to systematically identify deviations in printed objects that could result in a loss of function. To demonstrate this, we designed a 3D microfluidic mixing network, with channels ranging in size from 0.5 to 1 mm within a collagen block (figure 5(G)). A photomicrograph of the mixing network 3D printed using high contrast collagen shows recapitulation of the intended network geometry in a top-down view (figure 5(H)). To test our detection capabilities, we introduced a defect into the mixing network model that in practice could occur due to over-extrusion, filament dragging, or a G-code pathing error, and would block flow from one side of the network rendering it non-functional (figure 5(I), supplementary movie 8). After printing and imaging in the clear gelatin microparticle support bath we inverted the OCT image to extract the internal network shape, performed quantitative 3D gauging, and compared this to the defect-free mixing network. Overall, the mixing network showed high accuracy with deviation of –53.4 ± 62.1 µm and clearly revealed the presence of the purposely introduced defect within the mixing network (figure 5(J)). By implementing a pass/fail criterion based on the maximum size of positive deviation, we can use software to automate the detection of this defect (figure 5(K)). While this pass/fail analysis was performed after printing, it is possible to implement this type of failure analysis during the printing process after each step of the sequential OCT imaging, or during the live OCT imaging, to provide a method for real-time error detection.
3.7. In situ imaging and analysis of complex 3D anatomic constructs
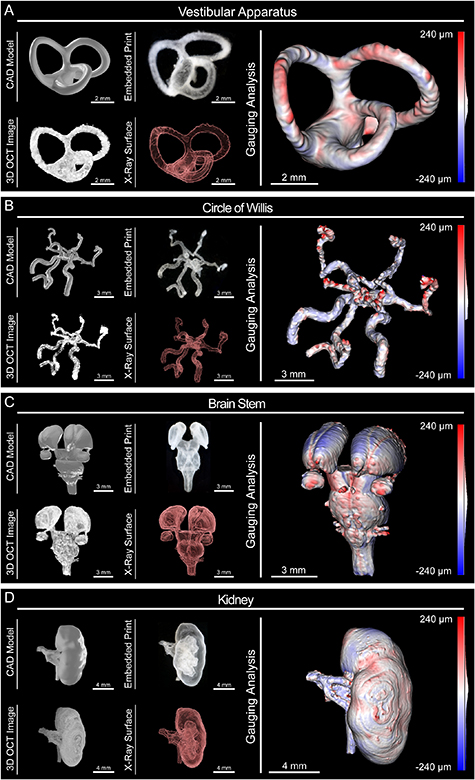
To leverage our improvements in 3D printer hardware, high contrast collagen bioink, clear gelatin microparticle support bath, and sequential OCT imaging, we moved beyond the relatively simple geometry of the benchmark model and mixing network to anatomic constructs based on patient-specific medical imaging data. First, we printed a segment of the vestibular apparatus from the inner ear, which stress-tests the printing and imaging systems due to the patent semicircular canals oriented in three mutually orthogonal planes (figure 6(A)). The embedded print was clearly visible, and optical imaging showed good reproduction of the model including patency of the three semicircular canals. The 3D OCT image had good signal quality and enabled 3D reconstruction, revealing internal features such as patent inner channels ∼325 µm in diameter (figure 6(A) and supplementary movie 9). Quantitative gauging analysis showed that the vestibular apparatus construct had deviation of 17.8 ± 43.3 µm. This mean deviation is one fifth the diameter of an individual printed collagen filament, highlighting the print quality and OCT resolution achieved when imaging within the clear gelatin microparticle support bath.
Figure 6. In situ OCT monitoring and 3D image reconstruction of medical imaging derived FRESH printed constructs. Four medical imaging derived models were chosen to demonstrate FRESH printing capabilities and OCT imaging using high contrast collagen in clear gelatin microparticle support bath. For each model we show five representations: (a) CAD model, (b) photograph of the embedded FRESH print in clear gelatin microparticle support bath, (c) an isometric view of the composite 3D OCT image, (d) an x-ray view showing internal features, and (e) the results of quantitative gauging showing deviations of the 3D reconstruction from OCT imaging versus the computer model (red is oversized, blue is undersized). (A) Vestibular Apparatus with three orthogonal semicircular canals. (B) Circle of Willis showing vertebral arteries, anterior spinal artery, middle cerebral arteries, and posterior and anterior cerebral arteries. (C) Brain Stem with thalami, midbrain, pons, medulla and cranial nerves. (D) Kidney demonstrating internal calyces, ureter, and blood supply.
Download figure:
Standard image High-resolution image
For the second model, we printed a segment of the circle of Willis from the brain's arterial system, an unsupported patent vascular network that would be challenging to 3D bioprint without FRESH. Optical imaging of the embedded print showed good reproduction of the model including the vertebral arteries, the anterior spinal artery, the middle cerebral arteries, and the posterior and anterior cerebral arteries (figure 6(B)). Segmentation of the OCT composite image confirmed the presence of both external and internal features, with the inner lumen of the right vertebral artery measuring ∼450 µm in diameter (figure 6(B) and supplementary movie 10). Quantitative gauging analysis showed the high fidelity of the vascular network with a deviation of 21.8 ± 53.2 µm, comparable to the average deviation for the vestibular apparatus. These data indicate that the precision of our custom FRESH 3D printing platform and OCT image resolution exceed the resolution of our smallest single printed filament (∼87 µm) and is approaching the mechanical precision of our linear motion system (∼8 µm).
Next, we focused on tissue constructs based on solid organs, rather than tubular networks. The third model we printed was the brainstem, which is a difficult model to print due to the small size of the cranial nerves (∼250 µm in diameter) and their close proximity to each other (∼200 µm center to center) as well as the subtle surface features on the thalami (∼300 µm in depth) (figure 6(C)). Visually, the embedded construct appeared to reproduce the CAD model including the thalami, midbrain, pons, and medulla. The OCT composited image captured all the 3D structure and after segmentation produced a 3D model that contained all of the external and internal features (figure 6(C) and supplementary movie 11). Quantitative gauging analysis showed reproduction of the fine cranial nerves and subtle surface features of the thalami with an overall average deviation of 21.4 ± 63.1 µm, which is an order of magnitude less than the smallest anatomic feature within the model.
The final model we printed was a scaled-down kidney to demonstrate the ability to print and image complex internal structures (renal artery, renal vein, calyces, and ureter) within a larger construct (the whole kidney capsule). The embedded print showed good reproduction of the CAD model with visible internal calyces as well as the renal artery, vein, and ureter (figure 6(D)). The OCT image confirmed high-fidelity printing throughout the thickness of the kidney and the segmented 3D surface clearly showed external and internal features, including the open ureter, with an inner diameter of ∼300 µm (figure 6(D) and supplementary movie 12). Quantitative gauging analysis confirmed recapitulation of the complex internal structures with deviation of −23.8 ± 121.9 µm. This example highlights the ability to accurately print and image collagen anatomic constructs from medical imaging data using our FRESH 3D bioprinting system, and validates that in situ OCT imaging in the iodixanol cleared gelatin microparticle support bath does not, in any measurable way, impact print fidelity compared to previously published results [4, 5, 45].
4. Discussion
One major challenge for 3D bioprinting has been monitoring the printing of soft and deformable hydrogels and creating a complete 3D reconstruction for dimensional validation and error detection [6]. For 3D bioprinting to become a viable biomanufacturing platform, this limitation must be addressed to enable the quality control and non-destructive testing often required for regulatory approval and translation. Here, we use a broad definition of the term bioink to include biomaterial inks, cell slurries, and cell-laden hydrogel bioinks, and demonstrate that our OCT imaging approach works across these ink types. We make this distinction to avoid any confusion, as a number of researchers refer to biomaterial inks and cell-laden bioinks separately [46]. In FRESH 3D bioprinting the gelatin microparticle support bath has limited visualization due to opacity resulting from light scattering of the particles themselves [3, 4]. However, even when using transparent support baths (e.g. Carbopol), it has been difficult to use digital cameras to monitor print quality due to having to image through the support bath [47, 48]. Many prints of interest have micrometer-scale features, but overall dimensions on the order of tens of millimeters, which is a challenging range for many optical imaging techniques [3–5]. Brightfield imaging can capture the entire printed object in one acquisition and be integrated into a 3D printer but does not collect a 3D image. Other imaging modalities such as confocal and multiphoton microscopy have high resolution and optical sectioning for 3D reconstruction but require long acquisition times and tile-scanning to capture larger volumes, and have limited imaging depth. Implementing these techniques for in situ imaging would require either the construction of a custom confocal microscope or a shuttle system to transfer samples between the printer and microscope. Imaging techniques designed for acquisition of larger volumes such as µCT provide high resolution and fast capture times, but also require the incorporation of contrast agents into the bioinks and have long reconstruction times that are not suitable for real-time analysis [4]. For these reasons, we looked to OCT because it combines the large imaging volumes (cubic centimeters) and high-resolution (∼20 µm) of µCT, the optical sectioning of confocal imaging, and fast 3D acquisition times (5 s up to 3 min) similar to brightfield imaging.
Here we have shown that OCT can be effectively integrated into a 3D bioprinter system. The custom 3D bioprinter built here uses precision translation stages to provide easy mounting of the OCT scan head, the repeatable positioning (∼8 µm) for sequential imaging, and high printing speeds (up to 40 mm s−1) [27]. Commercial OCT scan heads are compact and light weight, with scanning mirrors, laser line and control inputs, and objective packaged with height, width, and depth dimensions less than 10 cm. If the printing platform has sufficient space to mount this scan head, then incorporating OCT into a commercially available 3D bioprinter should be possible. With different printer configurations it would also be possible to have a stationary OCT scan head, to which the sample was moved (allowing for custom OCT systems), or beneath the sample for continuous, live, in situ imaging (figure S8, supplementary movie 7). Such a configuration, combined with higher-speed OCT imaging systems, could enable simultaneous OCT imaging and FRESH printing to minimize any effect of the imaging step on total print duration.
To date, FRESH and other embedded 3D bioprinting have used pre-filled containers of support material, whether the gelatin microparticle support bath or some other support bath such as alginate microparticles [4, 6, 10]. However, for prints larger than ∼5 mm tall the deflection of the fine 34-gauge, 6.35 mm long needle tips limits resolution. We have previously overcome this by building custom needle tips with long, larger diameter and rigid tips terminated in a smaller diameter tip [5, 32]. However, printing into deep dishes of gelatin microparticle support bath presents other challenges such as dehydration and skinning of the upper layer of the gelatin microparticle support bath. Here we developed a new alternative approach by printing the gelatin microparticle support bath itself in order to minimize the deflection of the needle tip and without a limitation on construct height. In addition to high-resolution printing of larger constructs, this makes OCT imaging of an embedded print possible, as the thickness of support that must be imaged through is minimal (a few hundred micrometers versus millimeters). A potential limitation of this technique could be the volume of the gelatin microparticle support bath syringe. Here we utilized a 10 ml syringe for our gelatin microparticle support bath, but a larger syringe could be adapted and used in a different configuration for greater support volumes.
OCT imaging within the clear gelatin microparticle support bath enables analysis of 3D printed structures without perturbing the soft and deformable hydrogel bioinks. This is an advance compared to previous work, where OCT imaging required melting away the gelatin microparticle support bath and either submerging the construct in water to maintain shape or embedding it in another clear hydrogel [31, 45, 49]. In both cases, deviations in construct shape and size occurred due to the soft deformable nature of the hydrogel bioinks. Acquiring OCT images in situ while the construct is still embedded in clear gelatin microparticle support eliminates these deformations. The 3D structure can be measured across multiple length scales to provide quantitative feedback to optimize print settings. For example, the diameter of printed filaments can be compared to the nominal filament diameter (as determined by the needle tip diameter) to determine if the bioink swells, shrinks or maintains shape during printing. Knowing this is a key setting for the slicing software and producing predictable and reproducible 3D bioprinted scaffolds. With our high contrast collagen bioink and clear gelatin microparticle support bath we show that filament diameter can match needle inner diameter (figure S5). Using the techniques we have laid out, these filament measurements can be acquired for any combination of bioink and support bath that possess two different refractive indexes to improve print quality and accuracy.
More sophisticated dimensional analysis is made possible by using the integrated OCT and sequential imaging during printing. The imaging data allows us to create 3D reconstructions to directly gauge the printed construct with the original digital model [29, 30]. This type of gauging is important if 3D bioprinting is to become a mainstream manufacturing technology; gauging is already used extensively in subtractive manufacturing where coordinate measuring machines verify that the machined parts meet the required specifications [50]. An important aspect of our approach is the use of automatic segmentation in the reconstruction of the 3D models, which prevents bias from manual intervention but can alter the results depending on the image SNR and algorithm used [51]. In the future, machine learning algorithms could be trained on bioprinted constructs to improve automatic segmentation and provide higher accuracy when creating 3D reconstructions [52]. As our system with integrated OCT is an extrusion based platform, it is also feasible to use this approach for imaging in air for direct ink writing or other 3D printing techniques [53].
The clear gelatin microparticle support bath also provides unique capabilities for FRESH 3D bioprinting of cellularized constructs. Specifically, the increased transparency enables live fluorescence imaging of the embedded prints, which can be used to quantitatively assess viability via Live/Dead stains or potentially adapted to evaluate cell metabolism or other readouts. Here we used this to validate that the clear gelatin microparticle support bath is cell compatible and that the iodixanol does not increase cell death or interfere with the Thrombin-mediated enzymatic gelation of fibrinogen into fibrin. Importantly, iodixanol has been shown to be biocompatible due to its iso-osmolar properties and has been used for live cell tissue clearing of organoids and cell monolayers [43].
To enhance OCT SNR and improve contrast we added TiO2 to our high contrast collagen bioink. TiO2 is a common additive to improve OCT image quality and has been extensively used as an FDA-approved additive for use in both pharmaceuticals and cosmetics [36, 37]. However, there has been recent concern that it could pose cytotoxic effects at some concentrations [54, 55]. While an in depth characterization of TiO2 toxicity is beyond the scope of the current work, if TiO2 is deemed an issue then alternative contrast agents can be used such as gold nanoparticles [56] or even pigments found within the human body such as melanin [57]. Moreover, we demonstrated here that when incorporating cells into a fibrin bioink we observe a substantial increase in the OCT signal, which improves image quality similar to the addition of TiO2. This eliminates the need to add TiO2 to a cellularized print due to the improved image quality afforded by the light scattering of individual cells within the cell-laden fibrin bioink.
As 3D bioprinting advances there is a growing need for an in situ 3D imaging and validation system to determine dimensional accuracy and detect print errors. In all CAD and biologically derived 3D models the FRESH printed constructs had average deviations of <50 µm by gauging analysis, demonstrating high-fidelity printing and sensitivity to micron scale error. This provides detection of surface deviations but can also be used to perform more advanced pass/fail error detection including blocked channels, walls that are too thick or thin, defects caused by bubbles, and over extrusion of material. Indeed, in the future we intend to automate the routine analysis of 3D bioprinted constructs. For example, this would be useful in a microfluidic or vascular system where a hole could cause a leak, or for a tricuspid heart valve where fusion of the leaflets would block flow. These structural measurements of print quality are important because they impact functional performance and represent the type of quality control that will be necessary to comply with FDA and other regulatory agencies for clinical translation.
Data availability statement
The data that support the findings of this study are available upon reasonable request from the authors.
Funding
This work is supported by the Food & Drug Administration (R01FD006582), the Juvenile Diabetes Research Foundation (2-SRA-2021-1024-S-B), and the National Heart, Lung, And Blood Institute of the National Institutes of Health (F32HL142229, F30HL154728, K99HL155777).
Author contributions
All authors conceived the experiments and contributed to the scientific planning and discussions. J W T and D J S prepared final figures and text. J W T and D J S conducted all bioprinting of constructs with in situ imaging. J W T and D J S developed OCT imaging protocols and optical clearing protocols. J W T wrote custom code in MATLAB for G-code editing. J W T and D J S performed image analysis in FIJI, and D J S performed image analysis in Imaris. D J S and B C performed bioprinting of cells and fibrinogen. J W T, D J S, B C, and A W F wrote the paper and interpreted the data.
Conflict of interest
A W F has an equity stake in FluidForm Inc., which is a startup company commercializing FRESH 3D printing. FRESH 3D printing is the subject of patent protection including U.S. Patent 10150258 and provisional patent No. 63/082621.
Data and materials availability
All STL and STP files for the Replistruder 5 syringe pump extruder are available at https://doi.org/10.5281/zenodo.7135874. All files for the 3D printed and reconstructed 3D models are available at https://doi.org/10.5281/zenodo.7135930. Any raw data not presented in the main and supplemental text is available on request.
Supplementary Movie 1 (4.0 MB MP4)
Supplementary Movie 2 (3.7 MB MP4)
Supplementary Movie 3 (3.6 MB MP4)
Supplementary Movie 4 (3.6 MB MP4)
Supplementary Movie 5 (3.8 MB MP4)
Supplementary Movie 6 (2.0 MB MP4)
Supplementary Movie 7 (5.3 MB MP4)
Supplementary Movie 8 (3.8 MB MP4)
Supplementary Movie 9 (2.1 MB MP4)
Supplementary Movie 10 (3.0 MB MP4)
Supplementary Movie 11 (3.4 MB MP4)
Supplementary Movie 12 (3.6 MB MP4)
Supplementary data (7.5 MB PDF)