

Abstract
Seasonal snow is an integral part of the global water supply and storage system. Snow droughts impact ecological, agricultural, and urban systems by altering the amount and timing of meltwater delivery. These droughts are characterized by a lack of on-the-ground snow (snow water equivalent, SWE) that can be caused by low total precipitation (dry drought) or low proportion of precipitation falling as snowfall (warm drought), often combined with an early melt. The standardized SWE index (SWEI) ranks the current status of SWE for a given location compared to a baseline condition and identifies the existence, but not the cause, of snow drought. In this work, we use estimates of SWE, temperature, and precipitation from nine coupled model intercomparison project phase 6 (CMIP6) models to quantify the frequency, severity, and type of snow droughts globally for historical and future scenarios. Compared to a historical baseline (1850–1900) total snow drought frequency more than doubles under socio-economic pathway (SSP)2-4.5 and SSP5-8.5; all of the increase in snow drought frequency comes from an increase in warm droughts. The probability distribution of future SWEI in major snowy basins around the world are likely to be centered on more negative values, which corresponds to more severe drought and, with only moderate changes in distribution spread, more frequent drought. CMIP6 simulations pinpoint snow drought as an emerging global threat to water resources and highlight the need to explore higher resolution future models that better capture complex mountain topography, wildland fires, and snow-forest interactions.
Export citation and abstract BibTeX RIS

Original content from this work may be used under the terms of the Creative Commons Attribution 4.0 license. Any further distribution of this work must maintain attribution to the author(s) and the title of the work, journal citation and DOI.
1. Introduction
The direct importance of snow as a water source is concentrated in high-latitude and mid-to-high-elevation watersheds (Barnett et al 2005) which feed 1–2 billion people (Immerzeel et al 2020, Qin et al 2020). In contrast to rainfall, snowfall experiences hysteresis between precipitation and runoff, during which it provides two primary services: self-storage of water and indirect global climate control by increasing global albedo and insulating methane-storing peatlands. Estimates of the economic value of snow are on the order of trillions of dollars in the Western United States alone (Sturm et al 2017).
However, global climate change threatens the future global snow resource by altering precipitation patterns in space and time and by increasing temperature, which shifts precipitation from snow to rain and advances melt timing (Daly et al 2010, Mudryk et al 2020, Zhu et al 2021). Observations of trends to date and modeling of future land-climate interactions demonstrate the threat of climate change to all of the world's major mountain water towers: the Western US (e.g. Marshall et al 2019, Cho et al 2021, Rhoades et al 2018, 2022), the Andes (Bozkurt et al 2018, Rhoades et al 2022), the European Alps (e.g. Coppola et al 2018), the Pan-Tibetan Highlands (e.g. Immerzeel et al 2010, Kraaijenbrink et al 2021), and the Australian Alps (e.g. McGowan et al 2018). Models also predict an increase in the interannual variability of the timing of peak snow water equivalent (SWE), which corresponds to decreased consistency in melt and streamflow timing, as well as a decreased ability of water managers to predict season-long water availability (Marshall et al 2019).
Snow droughts are periods of anomalously low snow defined in relation to local historical SWE volume (Harpold et al 2017). Snow droughts threaten the water security of snow-fed watersheds around the world by changing the amount and timing of snowmelt (Siirila-Woodburn et al 2021). In conjunction with low total water supply from a meteorological drought, a snow drought imparts additional challenges by changing the timing of downstream water availability, often advancing spring melt, especially in lower-elevation regions of a watershed (Segura 2021). Snow droughts may also coincide with and contribute to other types of droughts such as meteorological droughts (i.e. lack of precipitation) and hydrological droughts (i.e. lack of water in a system). However, when compared with other drought types, snow droughts present a unique challenge in that the occurrence of the drought and the impact of the drought may be separated in time. Further, multi-year snow droughts have compounding impacts, and snow droughts interact with other ecological processes, including temperature-mediated evaporation rates and vegetation death from drought and wildland fires (Bales et al 2018).
Snow drought is the result of the many processes involved in snow accumulation and ablation, making some common metrics for drought, such as total precipitation and soil or streamflow water deficit, necessary but insufficient for identifying snow drought. Understanding the proximate cause of snow drought leads to insight into mechanisms for preventing and managing future droughts. However, precise and unanimous definitions of snow drought, including how to best describe its existence, cause, and impacts, vary between science applications. Gottlieb and Mankin (2021) conducted an intercomparison of snow drought metrics based on a suite of observational and reanalysis snow products to show differences in identification of commonly used metrics. Namely, while all definitions of snow drought use local SWE as the sole value of interest, some definitions use metrics including peak SWE percentile (Siirila-Woodburn et al 2021, Rhoades et al 2022), binary peak SWE comparison to the climatological mean (Dierauer et al 2019), April 1 SWE comparison to the climatological mean (Harpold et al 2017), snow water equivalent index (SWEI) score on the US Drought Monitor scale (Huning and AghaKouchak 2020), and peak SWE amount and timing (Margulis et al 2016, Marshall et al 2019).
Global observations of SWE from satellite remote sensing are available with global coverage beginning in the late 1980's and regional reanalysis-based estimates are available from the mid 1900s (e.g. Muñoz-Sabater et al 2021). From these records, a global trend of increasing snow droughts, especially in some mountainous regions with large agricultural importance, is clear, although there is large variation between high-snow regions (Huning and AghaKouchak 2020). Extending the observed global spatial variations from the recent past to the modeled future places regional snow drought trends (e.g. Immerzeel et al 2020, Dierauer et al 2021, Siirila-Woodburn et al 2021, Rhoades et al 2022) in the context of global change.
Observations of snow droughts in the late 1900s and early 2000s indicate three primary categories of snow drought: warm, dry, and warm and dry (Harpold et al 2017, Dierauer et al 2019). Warm snow droughts occur when precipitation falls as rain rather than snow and is characterized by low on-the-ground SWE in years or months with non-drought levels of total precipitation (Harpold et al 2017, Hatchett and McEvoy 2018). Warm droughts may not trigger drought ratings on standard meteorological drought metrics, such as the standardized precipitation index (SPI). However, more of the watershed's precipitation will run off, infiltrate, or evaporate rapidly after falling, rather than being stored in-place as snowpack until melt, which leads to early flows in streams and increased reliance on dams for storage (Flint et al 2018). Dry snow droughts occur when abnormally low SWE results from low overall precipitation (Harpold et al 2017). The snow percentage may be normal or even high, but the overall low total precipitation leads to snow drought. Dry snow droughts are often also identified by SPI and other precipitation-based drought metrics. Defining snow drought is particularly important when comparing classifications from disparate data sources, including satellite observations, in situ monitoring, and climate models in the context of known biases and random error.
The global warming trend, particularly the potential elevated warming at higher altitudes (e.g. Palazzi et al 2019, You et al 2019), and expected approximately monotonic continuation of that trend into the future provide a clear mechanism for increasing warm snow droughts in the future. The speed of this increase in different regions as well as changing spatial and temporal patterns, however, is uncertain. Identifying the characteristics of the expected drought increase, including spatial patterns, frequency, magnitude, and duration of future snow droughts, lends additional nuance and provides a framework for response to hydrologic change at the level at which it is managed.
In this study, we leverage a suite of coupled model intercomparison project phase 6 (CMIP6) SWE simulations (Eyring et al 2016) to track and describe the emergence of snow droughts around the world in the recent past (1850–2015) and in future (2015–2100) climate scenarios. We apply frameworks for describing warm and dry snow droughts (Huning and AghaKouchak 2020, Dierauer et al 2021, Heldmyer et al 2023) to CMIP6 model outputs and use a multi-model ensemble to track trends in global and regional SWE and identify changes in the frequency and character of snow droughts in major basins around the world.
2. Methods
2.1. Data
We use CMIP6 climate model data from nine models that provide historical and future simulations under both socio-economic pathway (SSP)2-4.5 and SSP5-8.5. The list of models and data citations are in table 1. The historical runs of CMIP6 models simulate global climate variables from 1850 to 2014 using prescribed CO2 from recorded data and other natural and anthropogenic forcings, and each model is evaluated against relevant observational and reanalysis datasets (references in table 1). Future climate scenarios (from 2015–2100) for each model are forced by CO2 levels and other forcings from the shared SSP standard (Gidden et al 2019, Meinshausen et al 2020). The equilibrium climate sensitivity (in table 1) represents the change in temperature predicted from a doubling in the atmospheric CO2 concentration and can be used to compare climate models. In this work, we use data from two SSPs representing a range of possible future climates: SSP2-4.5 and SSP5-8.5. SSP2-4.5 is an intermediate emissions scenario in which greenhouse gas emissions maintain current levels through 2050 and then decrease. SSP5-8.5 is a very high-emissions, high-fossil fuel development scenario for the global climate that would result in approximately 4 ∘C warming by 2100. Both SSP2-4.5 and SSP5-8.5 contain assumptions about how human activity in the future will impact the global environment; the selection of these two scenarios here explores a range of possible future snow drought conditions and demonstrates the sensitivity of model–generated predictions to these assumptions. To maintain consistency between models, we only analyzed CMIP6 simulations through the end of the century (2100) even if longer-term simulations were available for some of the models.
Table 1. List of models used in this study for all variables and all of the historical, SSP2-4.5, and SSP5-8.5 experiments. The model name shown is the full CMIP6 acronym for the specific model version. All model outputs are monthly resolution.
| Institution | Model | ECS (∘C) | Citation |
|---|---|---|---|
|
CSIRO | ACCESS–CM2 | 3.3 | Dix et al (2019a, 2019b, 2019c) |
| BCC | BCC–CSM2–MR | 4.1 | Wu et al (2018), Xin et al (2019a, 2019b) |
| NCAR | CESM2–WACCM | 5.3 | Danabasoglu (2019a, 2019b, 2019c) |
| NOAA | GFDL–ESM4 | 4.1 | Krasting et al (2018), John et al (2018a, 2018b) |
| NOAA | GFDL–CM4 | 5.0 | Guo et al (2018a, 2018b, 2018c) |
| IPSL | IPSL–CM6A–LR | 5.0 | Boucher et al (2019a, 2019b, 2021) |
| MIROC | MIROC6 | 3.7 | Tatebe et al (2018), Shiogama et al (2019a, 2019b) |
| MRI | MRI–ESM2–0 | 4.0 | Yukimoto et al (2019a, 2019b, 2019c) |
| JWCRP | UKESM–1–0–LL | 5.3 | Tang et al (2019), Shim et al (2020, 2021) |
aCommonwealth Scientific and Industrial Research Organisation. bBeijing Climate Center. cNational Center for Atmospheric Research. dNational Oceanographic and Atmospheric Administration Geophysical Fluid Dynamics Laboratory. eInstitut Pierre-Simon Laplace. fJapan Agency for Marine-Earth Science and Technology, Atmosphere and Ocean Research Institute (The University of Tokyo), and National Institute for Environmental Studies. gMeteorological Research Institute. hJoint Weather and Climate Program: Met Office and National Environmental Research Council.
Kouki et al (2022) show a wet bias in SWE across the CMIP6 models when compared to satellite and observational data, with large inter-model variance in the size of the bias. Temperature and precipitation bias explain some, but not all of the wet bias in SWE. Despite biases in modeling SWE, the impacts of a warming climate may still be credibly simulated by CMIP6 models because of the established link between temperature and SWE in the historical data. Using absolute measures of SWE combined with relative drought statistics allows the impacts of global change to be examined through comparisons to an established baseline.
For the snow drought analysis, we used monthly values of the standard CMIP6 variables for SWE ('snw', in kg m−2, equivalent to mm), precipitation ('pr', in kg m−2 s−1), and near-surface (2 m) air temperature ('tas', in K). For each model, we computed the average of all ensemble members available at download time. Intra-model variability of SWE (i.e. the standard deviation of all parallel ensemble runs) of the SWE variable is small relative to intra-model variability (Kouki et al
2022), long-term trends, and the absolute values of the model results. All model outputs were accessed using Pangeo software tools in python and regridded from the native resolution to a  -pixel (1.125
 ) global grid using the conservative regridding algorithm in the xESMF package in python. Native resolution of model outputs varies slightly between models.
2.2. Drought definitions
We collate SWE from each of the CMIP6 models listed in table 1 to compute snow drought statistics globally from 1850 to 2100 and under each SSP2-4.5 and SSP5-8.5 for each model individually and compute the multi-model mean. Regions with low ( 10 mm cumulative SWE per year) SWE were masked, as were glaciated or ice sheet-covered regions with more than 10% land ice covered (from the 'stfgif' variable in CMIP6 outputs). We then calculate SWEI for each pixel to characterize the existence of snow drought in a given location at a given month. SWEI is a statistical metric calculated from monthly SWE values (Huning and AghaKouchak 2020):
where φ−1 is the inverse normal distribution and p is the Gringorten plotting position (Gringorten 1963):
where i is the ith term in the ranked list of all three-month cumulative SWE summations, and N is the total number of summations in the sample. This produces a scaled value representative of the relative extremity of the snowpack water storage at a given pixel for a given time frame. For further analysis of trends, distributions, and classification, we selected the SWEI for the month of peak SWE for the year for each pixel; all further mention of annual SWEI refers to this. In this study, we construct the plotting distribution with respect to a baseline time period of 1850–1900 for a given pixel, i.e. the mean SWEI in that period is 0 and all other years are relative to that period. The value of SWEI for a year is sensitive to the selection of a baseline time frame; the baseline time frame in this case was selected to illustrate the trend in SWE starting in the 1900s. Acknowledging this non-stationarity permits comparisons on the magnitude and direction of change over time, not the exact predicted values for on-the-ground snow mass.
Classifications of snow drought categories, following Dierauer et al (2019) and Shrestha et al (2021) assign a category to a given snow drought. The three month cumulative temperature anomaly ( ) and three month cumulative precipitation anomaly (
 ) are pixel-wise difference from the 1850–1900 monthly mean, where the value for each month is the cumulative sum of the preceding three month period. We set −0.8 as the cutoff for defining a snow drought, as in Shrestha et al (2021) and use sign of (
 ) and (
 ) to categorize droughts as warm and/or dry:
For each model, we conduct classification on a yearly basis, using the SWEI,  and anom(T) for the month of peak SWE for each year. This peak annual metric was selected to match the time scale of snow water management while allowing each pixel to have an independent climatology. Classifications are computed separately for each model (i.e. the SWEI computed from a model are classified using that model's
  and
and  ), and resulting statistics are averaged to produce multi-model statistics.
3. Results and discussion
Under SSP2-4.5 and SSP5-8.5, annual SWEI is predicted to decrease and the frequency of snow droughts is predicted to increase in most regions of the world. Figure 1 shows the multi-model mean SWEI in historical and future scenarios with 1850–1900 as the baseline distribution of SWE in a given grid cell. The SWEI values within the baseline thus, by construction, oscillate around zero. While both climate scenarios show a continuation of the decrease in SWEI that historical simulations indicate starting around 1980, the two model scenarios diverge in SWEI predictions for the first time around 2040 and continue diverging through the end of the model era in 2100. In addition, global, annual means do not predict snow drought occurrence at a given location or month, but rather predict distributions of SWEI values in the future global climate.

Figure 1. Global average snow water equivalent index (SWEI) multi-model mean for nine CMIP6 models for historical (black), SSP2-4.5 (blue), and SSP5-8.5 (red). The 95% confidence interval in the multi-model mean for each experimental era is shaded.
Download figure:
Standard image High-resolution imageThe global SWEI trends in figure 1 have a smaller confidence interval (i.e. more agreement between models) than the SWE values in the models, as the change over time is related to each model's sensitivity to climate in driving changes in snow processes, separate from the time-independent biases known in many models.
Figure 2 shows the distribution of SWEI for each decade from 1850 to 2100 in major global snow-dominated basins. There are no major trends over the historical period, as shown by the overlap of black lines in all panels. The mean SWEI values for the end of each time period—baseline, historical, SSP2-4.5, and SSP5-8.5—are indicated by crosses above the distributions and show a small shift in distributions between the baseline and historical periods followed by significant shifts by end-of-century in future climate scenarios. In all basins, the distribution of SWEI values shifts to a more negative mean in both SSP2-4.5 and SSP5-8.5. Four basins, the Pacific Northwest, Alps, California Basin, and Colorado Basin, show no meaningful change to the width of the SWEI distribution (i.e. standard deviation), while the Pan-Tibetan Highlands show an increased spread and the Andes show a decreased spread. Individual models (not shown) predict similar patterns, but with more variance in the change in width of SWEI distributions.
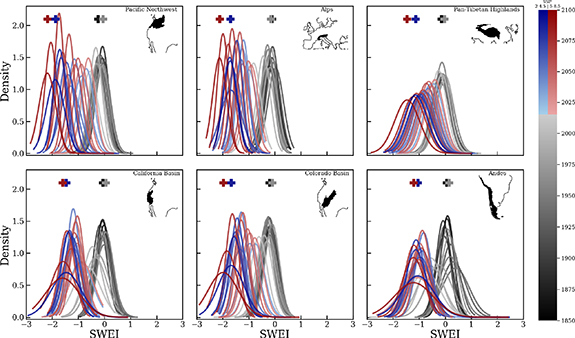
Figure 2. Distribution of SWEI in major global water tower basins (maps inset) from the multi-model mean of historical (black, 1850–2014), SSP2-4.5 (blue, 2015–2100), and SSP5-8.5 (red, 2015–2100) simulations. Each distribution is a fitted normal distribution to the values of SWEI for grid cells within the basin for the ten year period inclusive of the first year and exclusive of the terminal year. The location of the mean of the distribution for the decades that include the end of the baseline period (1850–1900; black), the end of the historical experiment (2005–2015; gray), and the end of the future climate scenarios (2090–2100; blue and red for SSP2-4.5 and SSP5-8.5, respectively) are indicated as crosses above the distributions.
Download figure:
Standard image High-resolution imageFigure 3 shows averages of snow drought frequency for the Northern Hemisphere and the Andes for the baseline period of 1850–1900 (left) and the change between the baseline and 1960–2010 (center left), 2050–2100 under SSP2-4.5 (center right), and 2050–2100 under SSP5-8.5 (right). The total snow drought distribution (panels m–p) is the sum of the warm (panels 1-d), warm and dry (panels e–h), and dry (panels i–l) columns. The baseline frequencies are shown as occurrence per year of single-year snow drought while subsequent time periods are the difference (i.e.  SWEI
SWEI SWEI
SWEI for time period t). The frequency of snow droughts is predicted to increase in all snowy regions of the northern hemisphere and the Andes, by an average of 0.31 ± 0.25 (0.39 ± 0.22, error is the intermodel standard deviation) by 2100 for SSP2-4.5 (SSP5-8.5) compared with the historical baseline. The global increase in snow droughts represents an increase over most of the area of historical seasonal snow, with the notable exception of northeast Asia, which shows a decrease in all forms of snow drought in both future climate scenarios. That region had the highest historical rate of snow drought and is also projected to have increased snow in the future due to precipitation increases and protection from above-0 warming at high latitudes. Finnegan et al (2022) found increases in snowfall and snow cover extent between 60 and 70∘N in this region in RCP8.5 climate projections, despite general warming trends and threats to permafrost insulation.

Figure 3. Frequency (occurrence per year) for the baseline period (left) and difference from this frequency in 1965–2015 (left center), 2050–2100 under SSP2-4.5 (right center), and 2050–2100 under SSP5-8.5 (right). Each row corresponds to a category of snow drought: warm (a)–(d), warm and dry (e)–(h), dry (i)–(l), and all categories (m)–(p) from the intermodel mean of snow, temperature, and precipitation as in equation (3). Snow droughts with neither warm nor dry conditions accounted for a small proportion of total snow droughts ( 3%) and are not shown.
Download figure:
Standard image High-resolution imageThe majority ( 99%) of this modeled increase is due to an increase in warm drought or warm and dry drought. Dry drought alone is predicted to decrease by an average of 3.2 (3.5)%. Of the increase in drought, 68% ± 16 (87% ± 22) is attributed to warm drought alone. Warm and dry droughts account for the remaining increase in drought, although the spatial distribution of warm and dry drought is much more varied than of warm or dry drought, with the majority of the warm and dry drought increase occurring in the Alps and parts of the Himalaya, with decreases in northern North America and eastern Asia. The Pan-Tibetan Highlands are the only region to see an increase in dry drought, possibly due to historical very low rates of dry drought. In historical model runs, more than 95% of snow droughts fit at least one of these criteria (i.e. very few snow droughts are in a year which is not anomalously warm and/or dry). The remaining ∼5% occurred in regions with extremely low total snowfall and therefore the drought classification is likely the result of the plotting position method's use of relative ranking, rather than relative magnitude to identify droughts. The largest increases in drought frequency occur in the northern latitudes in the northern hemisphere and in the extreme north and south regions of the Andes. The Pan-Tibetan Highlands, which to date have not had large snow droughts in historical observations or simulations, show more snow droughts in more than half of the years by the end of the century in the SSP5-8.5 scenario. The spatial patterns of frequency increase are consistent between SSP2-4.5 and SSP5-8.5, with a moderate range expansion in SSP5-8.5 compared to SSP2-4.5, especially as both show significant frequency increases in mountainous areas around the world. Work on previous versions of the CMIP6 models used in this study, when used to drive local hydrologic models in the American Southwest (i.e. overlapping the Colorado and California basins) show increases in below-tenth–percentile snow years of more than 200% by end of century (Cayan et al
2010).
99%) of this modeled increase is due to an increase in warm drought or warm and dry drought. Dry drought alone is predicted to decrease by an average of 3.2 (3.5)%. Of the increase in drought, 68% ± 16 (87% ± 22) is attributed to warm drought alone. Warm and dry droughts account for the remaining increase in drought, although the spatial distribution of warm and dry drought is much more varied than of warm or dry drought, with the majority of the warm and dry drought increase occurring in the Alps and parts of the Himalaya, with decreases in northern North America and eastern Asia. The Pan-Tibetan Highlands are the only region to see an increase in dry drought, possibly due to historical very low rates of dry drought. In historical model runs, more than 95% of snow droughts fit at least one of these criteria (i.e. very few snow droughts are in a year which is not anomalously warm and/or dry). The remaining ∼5% occurred in regions with extremely low total snowfall and therefore the drought classification is likely the result of the plotting position method's use of relative ranking, rather than relative magnitude to identify droughts. The largest increases in drought frequency occur in the northern latitudes in the northern hemisphere and in the extreme north and south regions of the Andes. The Pan-Tibetan Highlands, which to date have not had large snow droughts in historical observations or simulations, show more snow droughts in more than half of the years by the end of the century in the SSP5-8.5 scenario. The spatial patterns of frequency increase are consistent between SSP2-4.5 and SSP5-8.5, with a moderate range expansion in SSP5-8.5 compared to SSP2-4.5, especially as both show significant frequency increases in mountainous areas around the world. Work on previous versions of the CMIP6 models used in this study, when used to drive local hydrologic models in the American Southwest (i.e. overlapping the Colorado and California basins) show increases in below-tenth–percentile snow years of more than 200% by end of century (Cayan et al
2010).
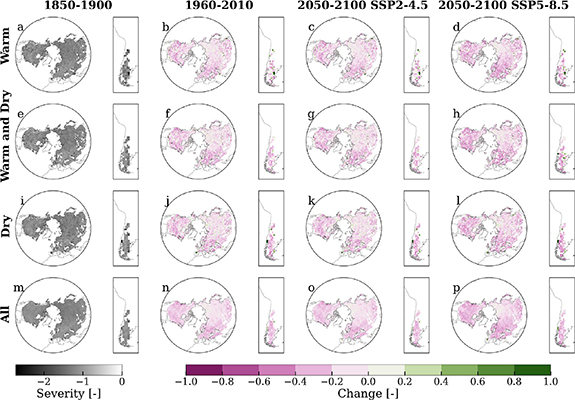
Figure 4 shows the average severity of snow droughts in the baseline period and the difference between each subsequent time period and the baseline, as in figure 3. Average severity indicates the expected SWEI value for a year given that there is a drought of the relevant category while frequency (figure 3) implies the probability of drought of the category. Negative change in severity (pink) indicates that the average snow drought is more severe than the average snow drought in the same pixel in the baseline period. Only years in which a snow drought occurs (i.e. SWEI  0.8 and of the specified type) are included in severity metrics. Snow droughts historically have been approximately equally severe whether dry or warm. Under SSP2-4.5 and SSP5-8.5, warm and warm and dry droughts increase in severity more than dry droughts. SSP2-4.5 shows smaller increases in all parts of the world than SSP5-8.5. Notably, regions with expected increases in frequency (figure 3) show a corresponding increase in severity; these patterns are similar in SSP2-4.5 and SSP5-8.5, but larger magnitude in SSP5-8.5. By end-of-century, the average change in snow drought severity is
  (
( ) in SSP2-4.5 (SSP5-8.5). As with frequency, there is no notable increase in the severity of dry snow droughts but there is an increase in warm and dry droughts and warm droughts, with hotspots in North American mountains and northern latitudes, the Andes, and the Pan–Tibetan highlands, and moderate increases in severity in the Alps. When combined, figures 3 and 4 show an increase in the frequency and severity in snow droughts in the Northern Hemisphere and Andes since the 1850–1900 period, with the largest changes in severity and frequency occurring in the same locations. Table 2 shows the average of all pixels considered for each panel in figures 3 and 4. The relative frequency of snow drought types over time has transitioned from slightly more dry than warm (1850–1900) to slightly more warm than dry (1960–2010), and is predicted to continue to much more warm than dry in both future climate scenarios. The severity of snow droughts of all types is approximately equal, with warm droughts increasing in severity slightly faster than other types.
Figure 4. Average SWEI of drought years for the baseline period (left) and difference from this in 1965–2015 (left center), 2050–2100 under SSP2-4.5 (right center), and 2050–2100 under SSP5-8.5 (right); i.e. P(snow drought) —P(snow drought)
 for each time period t. Negative change (pink) indicates more severe snow droughts in the relevant period than in the baseline period. Each row corresponds to a category of snow drought: warm (a)–(d), warm and dry (e)–(h), dry (i)–(l), and all categories (m)–(p) snow droughts from the intermodel mean of snow, temperature, and precipitation as in equation (3). Only values that are classified as drought (i.e. SWEI
  0.8) are included.
Download figure:
Standard image High-resolution image
Table 2. Frequency and severity of warm , warm and dry, dry, and all snow droughts for each era and experiment shown in figures 3 and 4. Neither warm nor dry snow droughts compose a small proportion of snow droughts and are not shown in the table.
| 1850–1900 | 1960–2010 | SSP2-4.5 | SSP5-8.5 | |
|---|---|---|---|---|
| Frequency | ||||
| Warm | 0.038 | 0.041 | 0.297 | 0.453 |
| Warm and dry | 0.027 | 0.027 | 0.120 | 0.062 |
| Dry | 0.043 | 0.035 | 0.010 | 0.002 |
| All | 0.133 | 0.124 | 0.438 | 0.519 |
| Severity | ||||
| Warm | −1.200 | −1.207 | −1.462 | −1.478 |
| Warm and dry | −1.203 | −1.216 | −1.459 | −1.437 |
| Dry | −1.218 | −1.201 | −1.426 | −1.385 |
| All | −1.180 | −1.179 | −1.457 | −1.477 |
The coarse resolution of global models precludes sensitivity to local patterns, including fine-scale response to topography within the model. However, multi-scale modeling work has shown that coarse-resolution models generally reproduce regional patterns in precipitation and temperature (Ukkola et al 2020). Further, SWEI is a relative index, not a predictor of a specific value of SWE on a certain date at a location.
4. Conclusions
Global fully coupled models in CMIP6 predict consistently, dramatically decreasing SWEI. In most regions, including the world's major water towers, SWEI distributions were relatively stationary from 1850–1900; satellite and in situ data from some of these regions over some time frames supports a general historical stationarity. Since 1950, snow drought severity and frequency has slightly increased and SWEI distributions are predicted to shift further negative, toward more frequent and severe snow drought, in 2015–2100. This trend, while not surprising given the known global temperature increase, motivates the consideration of defining a drought in the context of an evolving baseline. In this study, we put current and future changes in the context of a static historical baseline rather than the moving-window approach that, while frequently used operationally, can obscure long-term trends in favor of highlighting short-term variability (Milly et al 2008).
Previous work on snow disappearance rates has focused on high-resolution predictions that accurately represent the role of topography in distribution of precipitation and energy transfer. This global, low-resolution analysis contextualizes local predictions in global and regional trends. In particular, the emergence of warm droughts as a dominant snow drought category in most regions of the world in the future indicates that the snow droughts of the future may have different characteristics than those of the past. Historically, snow droughts have been more dry than warm in continental climate zones (Dierauer et al 2019). In maritime climates, where the elevation of the snow-rain transition has larger variability, snow droughts have historically been warm or both warm and dry, but at lower frequency than in future predictions. In recent decades, dry and warm snow droughts contribute approximately equally to snow drought frequency in most regions, although warm snow droughts are more severe on average. Under SSP2-4.5 and SSP5-8.5, dry snow droughts are predicted to slightly decrease in most areas while warm snow droughts significantly increase in the majority of the historically snowy areas of the world. This analysis of climate models shows that from 1850 to the present day, snow droughts have shifted from drier to warmer, and that trend is predicted to continue in the future.
Snow drought should be considered parallel to meteorological drought, i.e. meteorological drought can produce snow drought but it is not necessary for snow drought. Meteorological droughts are predicted to increase in CMIP6 simulations with similar trends as the snow drought trends shown here (Ukkola et al 2020). Warm snow droughts create both a challenge and an opportunity: lack of concurrent meteorological drought may lead to underestimation of the severity of the drought, but the water missing from snowpack is more likely to be locally available than in the case of a dry snow drought. Further, warm snow droughts have been observed to produce lower precipitation–streamflow ratios in the United States (Berghuijs et al 2014) and Central Asia (Li et al 2020). The low-precipitation high-temperature conditions that cause warm and dry snow droughts also correspond to more extreme streamflow deficits than either condition in isolation (Dierauer et al 2018). In other words, snow droughts in the future may be less likely to co-occur with meteorological droughts, but are likely to be more frequent and severe, with potentially higher streamflow impacts. The impacts of climate change on water storage within the hydrological system are many and strong (Christensen et al 2004). Whether a snow drought is warm, dry, or both, is important in the context of interactions with other types of droughts and therefore the agricultural and societal impacts of drought.
Acknowledgment
M C was supported by the U.S. Department of Energy, Office of Science, Office of Advanced Scientific Computing Research, Department of Energy Computational Science Graduate Fellowship under Award Number DE-SC0022158. M G was supported by NASA HiMAT team program, Grant No. 80NSSC20K1301. R L was supported by the U.S. Department of Energy, Office of Science, Biological and Environmental Research as part of the Regional and Global Model Analysis program area. PNNL is operated by Battelle Memorial Institute for the U.S. Department of Energy under contract DE-AC05-76RL01830. The views and opinions of authors expressed herein do not necessarily state or reflect those of the United States Government or any agency thereof. The authors declare no conflict of interest. The authors are grateful to two anonymous reviewers, whose comments improved the quality of this manuscript.
Data availability statement
No new data were created or analyzed in this study.
Open research
The CMIP6 model results used in this work are available from the Earth System Grid Federation and were accessed using the pangeo package for python. The code for this project is available at https://github.com/mariannecowherd/snow_drought.