

Abstract
Forests mitigate climate change by sequestering massive amounts of carbon, but recent increases in wildfire activity are threatening carbon storage. Currently, our understanding of wildfire impacts on forest resilience and the mechanisms controlling post-fire recovery remains unresolved due to a lack of empirical data on mature trees in natural settings. Here, we quantify the physiological mechanisms controlling carbon uptake immediately following wildfire in mature individuals of ponderosa pine (Pinus ponderosa), a wide-spread and canopy-dominant tree species in fire-prone forests. While photosynthetic capacity was lower in burned than unburned trees due to an overall depletion of resources, we show that within the burned trees, photosynthetic capacity increases with the severity of damage. Our data reveal that boosts in the efficiency of carbon uptake at the leaf-level may compensate for whole-tree damage, including the loss of leaf area and roots. We further show that heightened photosynthetic capacity in remaining needles on burned trees may be linked with reduced water stress and leaf nitrogen content, providing pivotal information about post-fire physiological processes. Our results have implications for Earth system modeling efforts because measurements of species-level physiological parameters are used in models to predict ecosystem and landscape-level carbon trajectories. Finally, current land management practices do not account for physiological resilience and recovery of severely burned trees. Our results suggest premature harvest may remove individuals that may otherwise survive, irrevocably altering forest carbon balance.
Export citation and abstract BibTeX RIS
1. Introduction
Forests play a critical role in mitigating anthropogenic climate change. They remove ∼30% of global fossil fuel emissions annually (Friedlingstein et al 2021), store ∼45% of terrestrial carbon in biomass and soil (Bonan 2008), and keep ∼170 ppm of CO2 out of the atmosphere (Pan et al 2011). However, recent wildfires and subsequent post-fire management decisions threaten the ability of forests to remain carbon sinks. According to current management strategies, after a wildfire, a tree is assumed dead and marked for logging based solely on visual observations and morphological measurements (Varner et al 2021). This practice ignores the potential for physiological resilience and removes the tree from the ecosystem, permanently eliminating its ability to contribute to the environment as a carbon offset and decreasing the forest's total carbon sink capacity (Hurteau et al 2019). Therefore, to better inform management practices, we must understand how trees respond to wildfire under natural conditions (Hood 2020). This effort requires field-based data on moderate to severely burnt trees that are allowed to persist post-fire.
Previous studies describing post-fire tree impacts have focused on seedlings in laboratory experiments (Smith et al 2016, Sparks et al 2016, Smith et al 2017, Sparks et al 2018, Steady et al 2019, Partelli-Feltrin et al 2021), saplings exposed to low-intensity prescribed fire (Smith et al 2005, Schutz et al 2009, Partelli-Feltrin et al 2020), or on morphological and growth-related metrics (Sparks et al 2017, Westlind and Kerns 2021). Post-fire carbon stocks for ecosystem-level productivity estimates are often quantified (Irvine et al 2007, Hurteau and Brooks 2011), but the immediate impacts to tree physiological function have not been comprehensively measured after wildfire (Hood et al 2018, Hood 2020). Efforts to quantify physiological responses to prescribed burns have been documented in mature Pinus palustris (Varner et al 2007, Morgan Varner et al 2009, O'Brien et al 2010, Clinton et al 2011, Renninger et al 2013, Schafer et al 2014, Starr et al 2015), but are constricted to eastern North American forests, which have a much higher year-round moisture content—a buffer to fire stress not available to western trees (Buotte et al 2019). Physiological performance has been observed in mature western ponderosa pines after a low-intensity prescribed burn (Sala et al 2005), but controlled burns do not reflect the complexity of damage inflicted by a heterogeneous wildfire (Sparks et al 2018).
The studies that have observed physiological parameters in fire-prone conifers after wildfire (not prescribed burns), have focused on aboveground hydraulic measurements (Bär et al 2018) or carbon and nitrogen allocation (Alexander and Mack 2016, Song et al 2022) but not both, which are inextricably linked during tree stress (McDowell 2011, Sevanto et al 2014). Because of the inherent logistics with experimentally replicating severe wildfires and measuring mature, canopy-dominant trees, comprehensive data describing physiological responses post-fire are notably lacking. The absence of these data has caused a critical gap in our understanding of the mechanisms involved during recovery from wildfire (Hood 2020), which inevitably impacts modeling of forest carbon trajectories (Hood et al 2018, Yi et al 2022) as well as post-fire management efforts (Hudiburg et al 2013, Hurteau et al 2019).
In August 2020, a wildfire burned through a long-term measurement site, providing a unique opportunity to monitor the post-fire stress response of mature conifers. Patterns of fire intensity were mixed across the landscape, inducing different physiological responses among individual trees with variable degrees of fire damage. Within weeks, we collected measurements detailing mechanisms involved in initial tree recovery. Our overall goal was to quantitatively describe the physiological responses of mature conifers to varying fire damage, which is crucial for accurately predicting post-fire tree recovery and informing forest ecosystem management.
2. Materials and methods
2.1. Site description
The study site (Metolius 2, Me-2) is a mature conifer forest located east of the Cascade Range in central Oregon (44°4ʹN, 121°55 W) and is a long-term AmeriFlux site, providing 20 years of eddy-covariance data prior to the fire. The overstory is dominated by ponderosa pine (Pinus ponderosa), with a mean tree age of 60–80 years (Irvine et al 2008). Prior to the fire, incense cedar (Calocedrus decurrens) was intermittently dispersed in the sub-canopy, but not prevalent. Understory shrubs consisted mainly of bitterbrush (Purshia tridentata) and greenleaf manzanita (Arctostaphylos patula) preceding the fire (Irvine et al 2008), and were completely consumed with no re-sprout. Average tree height was approximately 21 m and average diameter at breast height (DBH) was approximately 40 cm (height and DBH recorded in 2020 during initial measurements post-fire). Total basal area was ca. 33 m2 ha−1 post-fire. The climate is semiarid with warm, dry summers and cool, wet winters that provide the majority of the annual precipitation (300–600 mm). Prolonged summer drought is typical for these forests, but substantial water availability from winter snow melt sustains the trees through dry summers. The site sits on a flat plain at 1255 m elevation with sandy loam and well-drained soils and is located just east of the north-south oriented Green Ridge.
The area is classified as Northern Rocky Mountain Ponderosa Pine Woodland and Savanna. Prior to European colonization, this region burned with primarily low-severity surface fire at a mean fire return interval of 16–20 years, likely from lightning ignition or purposely induced by indigenous cultures. Absent evidence of recent fire and given the age of trees, this ecosystem has likely 'missed' two to six (or more) fire return intervals. The associated increase in understory fuels (in the shrub component) and ladder fuels (introduction of a substantial Calocedrus decurrens component) likely increased the potential for higher-than-normal fire intensity and burn severity at this site.
2.2. Fire behavior
On 20 August 2020, the Green Ridge Fire burned through the study site. The fire was ignited by lightning on 16 August and grew rapidly to the east over several days driven by strong, downslope (westerly) afternoon winds off Green Ridge. In the area of the study site, fire behavior and subsequent observed fire effects were highly heterogeneous due to both the localized wind pattern carrying the flaming front and efforts made by suppression resources to contain the fire. Suppression efforts included an aerial fire-retardant drop for approximately 80 m immediately west of the AmeriFlux eddy-covariance tower that inhibited crown fire in the affected stand of trees. The study site experienced the full range of fire effects (figure 1(a)), from surface fire with flame lengths <1 m tall that charred litter and duff and only consumed shrubs and herbaceous material, to full tree (>15 m) active crown fire that consumed 100% of needles, small limbs, and surface fuels (understory) at high intensity, leaving only ash and bare soil post-fire.
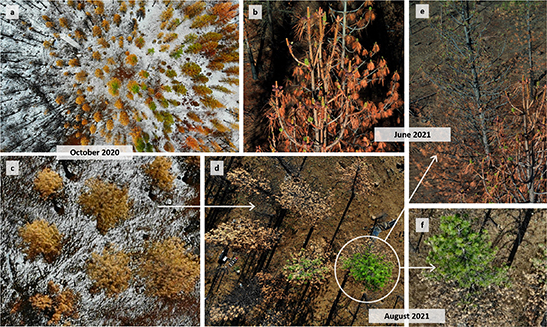
Figure 1. (a) Aerial drone image taken October 2020 (two-months post-fire) showing gradient of fire effects. (b) Despite severe tree damage, new growth was evident in canopies of burnt trees in June 2021 (10 months post-fire). The change in new canopy growth was extensive from (c) October 2020 to (d) August 2021, but budburst in severely burned trees was delayed from June (e) until August (f) in 2021.
Download figure:
Standard image High-resolution image2.3. Climate and environmental data
At the time of the fire, the site was experiencing above-normal temperatures and below-normal precipitation (figure S2), conditions that enable fire growth and higher energy release. In this region, climatological autumn (September–October–November; SON) is associated with a short growing season (Law et al 2001), and autumn 2020 experienced the second highest fall vapor pressure deficit (VPD) on record (figure S3(a)). Similarly, in spring and summer 2021, the area again observed the highest (since 1985) growing-season-VPD (March—August) on record (figure S3(b)). The combination of the near-record high VPD in fall, with a record-high VPD the following growing season was unprecedented in the climatic record for the location (Huntington et al 2017).
Meteorological measurements are continuously collected through the AmeriFlux tower (Kwon et al 2018) and include net radiation (model CNR1, Kipp & Zonen, Delft, The Netherlands), photosynthetic active radiation (model PARlite, Kipp & Zonen), air temperature, relative humidity (model HMP45, Vaisala, Helsinki, Finland), and precipitation (model TE525WS, Texas Electronics, Dallas, TX, USA). Soil water content was measured and recorded every 30 min (Matric Potential Sensor-6 Dielectric Water Potential Sensors; Decagon Devices Inc.); sensors were installed at depths of 10, 20 and 30 cm in three separate areas representing low, moderate, and severely burned forest floor. The severity of soil damage was assessed (Parsons et al 2010) within a week after the fire was completely extinguished at the site and determined by the fire-induced changes in ground and soil conditions (char depth, altered color and structure, and inferred organic matter loss). Average soil water content increased over winter and into early spring, as expected from snow melt, but then steadily decreased during the 2021 growing season (figure S2).
2.4. Post-fire physiological measurements
2.4.1. Tree damage
Fire damage to trees is difficult to quantify and as a result, tree damage has typically been described qualitatively primarily based on ocular estimates (O'Brien et al 2018, Varner et al 2021), which can be subjective if lacking pre-fire data quantifying the crown. These metrics are particularly problematic in conifer species that drop needles from lower branches. We therefore contextualize our results as a function of tree damage to directly compare physiological responses in mature trees across a range of fire effects.
In Fall 2020, fire impacts on trees were characterized with height measurements of crown and stem damage using a Laser Rangefinder. For each tree, we measured the height of the lowest green needles, lowest red needles, highest red needles, highest bole char, and total tree height. We calculated tree damage as the ratio of the highest red needle to the total height of the tree. While there were trees on the Metolius site that exhibited 100% crown consumption, we did not measure any of these because all needles were consumed by fire, so the maximum value for tree damage refers to canopies that received 100% scorch (all needles red). Additionally, bole char height, which is the height of visible fire damage on the tree trunk, increased linearly with tree damage (p < 0.001; figure S5). Tree height was not related to tree damage (p = 0.15; figure S6).
2.4.2. Leaf water potential
In 2021, we measured leaf water potential in five unburned control trees and 12 trees that varied in burn severity (DBH > 30 cm for all trees). Mid-day (∼1100–1400) leaf water potential measurements were collected over a three-day period in June (ten-months post-fire), and again in August of 2021 (one-year post-fire). Branches were harvested either by the shotgun method or by climbing the trees, depending on tree damage and accessibility of sun-level branches. We harvested only green sun needles; a laser rangefinder was used to ensure the climber was within three meters of the top of the tree and only accessing sun needles. Two branches were harvested from each tree, from opposite sides but at the same height within and among trees. The branches were brought to the bottom of the tree, where the samples were measured for water potential with a pressure chamber (PMS Instrument Co., Corvallis, Oregon, USA) following established protocols (Scholander et al 1964, Verryckt et al 2020). All measurements were made within 15 min from branch excision. We measured two needles per branch and measured a third if the measurements differed by >0.2 MPa.
2.4.3. Gas exchange
Leaf-level gas exchange was measured in September, October, and November 2020 (one-, two-, and three-months post-fire), and again in June and August 2021, (10-months and one-year post-fire). In 2021, gas exchange measurements were completed on the same branches obtained for leaf water potential (collected during midday: ∼1100–1400); however, leaves for the water potential measurements were removed prior to rehydration of the branch. Branches were recut under water within five minutes of branch excision and remained submerged in water until gas exchange measurements were completed (Verryckt et al 2020). We measured gas exchange in three replicates for each tree, using an open system portable infrared gas analyzer (LI-6400, Li-Cor Biosciences, Lincoln, Nebraska, USA). For maximum photosynthetic rate (Amax) survey measurements, air flow was kept constant at 500 µmol CO2 s−1, light was set at 1500 µmol m−2 s−1, block temperature was set to 20 °C, and reference CO2 was kept at 400 ppm. For each measurement, we spread the three needles of a single fascicle across the cuvette and later corrected for leaf area. The needles were placed in plastic bags and kept in a freezer until they were measured for projected area with a leaf area meter (LI-3100, Li-Cor Biosciences). Because P. ponderosa have stomata on all sides, we used the 2.36 conversion factor to convert from projected leaf area to all-sided leaf area.
We measured photosynthesis as a function of the carbon dioxide concentration inside the leaf (A/Ci curves) on the samples collected in June and August 2021 to characterize the photosynthetic capacity of the burned trees (Panek and Goldstein 2001). A/Ci curves were collected and processed following established protocols (Long and Bernacchi 2003). During the A/Ci measurements, parameters were kept similar to those set during the Amax survey measurements: air flow was kept constant at 500 µmol CO2 s−1, light was set at 1500 µmol m−2 s−1, and block temperature was set to 20 °C. Carbon dioxide concentrations were started at 415 ppm to reflect current ambient conditions, then decreased to 300 ppm, 200 ppm, 100 ppm, and 50 ppm then brought back to 415 ppm, before being increased to 600 ppm, 800 ppm, 1000 ppm, 1500 ppm and 2000 ppm. We simulated and fit the A/Ci curves using the plantecophys package in R statistical software (Duursma 2015). We used the fitaci function to fit the Farquhar-Berry-von Caemmerer model, producing estimates of the maximum rates of carboxylation (VCmax) for each tree.
2.4.4. Leaf nitrogen
After measuring leaf area, each needle was dried at 60 °C in a drying oven for 72 h before being homogenized and ground with a ball-mill grinder. The dried, ground samples were then weighed (0.8–1.0 mg) into tin capsules and analyzed for total carbon and nitrogen contents with an elemental analyzer.
2.4.5. Root density
In August 2021, we used a 5.7 cm diameter galvanized steel soil core sampler to collect four ca. 970 cm3 intact soil cores, including fine (<2 mm and 2–5 mm diameter) and coarse (>5 mm diameter) roots, from the area directly surrounding the base of 17 variously burned trees plus three unburned control trees. There were no other tree species or vegetation in this area, so we did not need to differentiate between roots. We first removed the organic layer from each soil sampling location, after which we collected an intact soil core from the top 25 cm of the mineral horizon (unless prevented by shallow bedrock). Soils were then frozen within 24 h and returned to the lab for further processing. In the lab, soils were sieved to filter out live fine and coarse roots using progressively finer mesh filters, starting with a U.S. Standard #5 (4000 µm) and ending with a #35 (500 µm) filter. Sieved roots were washed with deionized water, dried for 48 h at 65 °C, and weighed to characterize total fine root biomass on a volume basis (grams of root cm−3 soil−1).
2.4.6. Soil respiration
Soil respiration was measured on areas with varying degrees of soil damage (low, moderate, and high), which was assessed within a week after the fire (Parsons et al 2010) and determined by the fire-induced changes in ground and soil conditions (char depth, altered color and structure, and inferred organic matter loss). Using a LI-6400 equipped with a LI-6400-09 soil chamber (Li-Cor Biosciences), soil respiration was measured on existing root collars (10.7 cm in diameter) in each area of soil damage (n = 3–6 collars per area of soil damage). No living vegetation was present inside any of the collars to ensure measured respiration was from the soil and not aboveground biota. Soil respiration measurements were conducted bi-weekly from August (one-week post-fire) through October 2020 (two-months post-fire) and again in May and June 2021 (nine- to ten-months post-fire) at weekly or biweekly intervals. Monthly post-fire soil respiration was compared with the pre-fire mean for the previous seven years (2012–2019), collected at the same site.
2.4.7. Tree model for sensitivity analysis
We used a process-based tree model that couples carbon uptake with tree hydraulic properties (Trugman et al 2018) forced by local environmental conditions (Mathias and Trugman 2022) including temperature, vapor pressure deficit, atmospheric CO2, soil water potential, and tree characteristics (e.g. tree height, tree diameter at breast height, total leaf area, VCmax). Our goal was to simulate the impact of tree damage on cumulative annual carbon uptake potential at the tree level to determine the sensitivity of possible outputs to varying photosynthetic capacity (VCmax). We first simulated three scenarios: (a) an unburned tree, (b) reduced leaf tree leaf area resulting from fire damage (current Earth system model assumptions), and (c) reduced leaf area AND dynamic VCmax resulting from fire damage (novel model development). We performed a modeling exercise where we parameterized the model using site-specific tree characteristics and validated model-predicted, tree-level carbon uptake against GPP estimates from the Me-2 eddy covariance flux tower (R2 = 0.66, p < 0.001).
2.4.8. Statistical analysis
Statistical analyses were performed in R statistical software. We used linear regression and mixed-effect models to analyze differences in leaf water potential, maximum photosynthetic rate (Amax), and maximum rate of carboxylation (VCmax) among trees. Tree identification was treated as a random effect. First, we modeled the response variable as a function of burn status (categorical variable). We then subset the burned data and conducted a second regression in which severity of tree damage (continuous variable) was the response variable. We performed type III analysis of variances to test for significance among variables and used the package emmeans to test for post-hoc differences where necessary. We also used linear regression to examine the relationship between tree damage and root density and analysis of covariances to determine whether canopy dripline location (e.g. under or outside of the vertical boundary of the tree crown) influenced the effect of tree damage on root density. We also tested whether mean root density was correlated with bole char height, which varied around each tree. We applied Tukey's honestly significant difference post hoc test to further examine where differences occurred. Linear regression was also used to determine how our metric for tree damage related to tree height and bole char height. Soil water content was averaged among depths and summarized by day of year before being linearly regressed to test for differences in soil water content among areas with different degrees of soil damage (low, moderate, and high).
3. Results and discussion
Prior to the wildfire, the research site (Me-2) was a strong net carbon sink, sequestering over 400 g C m−2 yr−1 (Thomas et al 2009). The fire reduced aboveground carbon densities by ∼17%, primarily by consuming downed woody detritus and surface organic matter pools. Despite fire impacts (figure 1(a)), more than 90% of the 155 ponderosa pine study trees were still alive in the second-year post-fire, displaying considerable physiological activity and visible evidence of new growth (figure 1(b)). During the following growing season, many trees with fully scorched (but not consumed) foliage (figure 1(c)) displayed budburst (figure 1(d)) and replacement of green needles across their prior canopy height (figures 1(e) and (f)). Though a promising and unexpected start to recovery, long-term survival will depend on tree capacity to replace lost roots and leaf area while simultaneously withstanding climate stress over multiple growing seasons (Sparks et al 2017, Partelli-Feltrin et al 2020). The ability to balance these needs depends on carbon uptake, which is governed by a tree's stress response.
Immediate physiological responses to stress occur at the leaf level but result from a suite of tree-specific traits that optimize carbon uptake and minimize water loss. Trees can quickly close their stomata in response to direct environmental stimuli, including drought (Misson et al 2004, Poulos et al 2020). Although reducing stomatal conductance limits carbon uptake, this response is necessary to protect hydraulic function (water uptake) during stressful conditions.
Carbon gain occurs at the leaf level and is ultimately controlled by two metrics: total leaf area of the tree (number of total needles photosynthesizing), and the photosynthetic capacity of those needles (figure 2). Photosynthetic capacity quantifies the amount of photosynthetic 'machinery' (carbon-fixing enzymes, etc) inside the needles and is positively related to the availability of nitrogen (Tissue et al 1999, Long and Bernacchi 2003, Walker et al 2017). Fire is a unique stressor in that it vastly and instantaneously reduces leaf area and fine root biomass, which limits water and carbon uptake, but also pulses nitrogen into the ecosystem (Michaletz and Johnson 2007). Elevated nitrogen in soils and microbial biomass immediately post-fire is typically followed by a decline in nitrogen availability, which may result from increasing plant demand during recovery (DeLuca and Zouhar 2000). Plant uptake of soil nitrogen post-fire would allow trees to build more photosynthetic machinery at the leaf-level, increasing carbon fixation rates.

Figure 2. Conceptual model demonstrating the morphological impacts of fire on needles. Remaining green needles on burned trees (right side) may have a higher photosynthetic capacity (VCmax) than needles on unburned trees (left side) that offset losses in roots and leaf area. Inset: Photosynthetic capacity (VCmax) is derived by measuring photosynthesis as a function of increasing leaf CO2 concentrations. Yellow lines represent typical response for a burned needle (right side) and green lines represents response for an unburned needle (left side). Illustrated by Eric Parrish. © The Authors.
Download figure:
Standard image High-resolution imagePhotosynthetic capacity is an integrative plant trait that can be experimentally derived by measuring photosynthesis at increasing carbon dioxide concentrations (figure 3(a)). The maximum rate at which the needle can fix carbon is defined as VCmax, the maximum velocity of carboxylation. VCmax differs from photosynthetic rate measurements typically conducted in the field, such as maximum or net rate of photosynthesis (Amax, Anet), which provide snapshots of carbon uptake that vary rapidly on short time scales. By representing a time-integrated, rather than instantaneous, view of tree acclimation to a specific environment, VCmax is better able to capture physiological responses in post-fire landscapes. Additionally, VCmax is a widely used parameter in Earth system models, allowing us to directly inform ecosystem-level carbon models from field-based data for a widely distributed and fire-prone species.

Figure 3. (a) Photosynthetic rate as a function of increasing carbon dioxide inside the leaf for trees experiencing various levels of fire damage compared to that of an unburned tree (dashed line). Data are from actual curves measured in the field. A steeper initial slope in photosynthesis corresponds to a higher photosynthetic capacity (VCmax). (b) Among burned trees (n= 12), VCmax increases with tree damage during June (circles) and August (triangles). Dashed lines represent the average photosynthetic capacity of needles in unburned trees. Remarkably, the VCmax of severely burned trees approaches that of unburned trees, suggesting increases in the photosynthetic capacity of surviving needles offsets loss of leaf area.
Download figure:
Standard image High-resolution image3.1. Physiological mechanisms
Here, we show that the photosynthetic capacity (VCmax) of ponderosa pine needles was lower for burned than unburned trees, which is expected following fire damage. However, within burned trees, the photosynthetic capacity of surviving needles increased with the severity of tree damage (p< 0.05, R2 = 0.26; figure 3(b)). Our results suggest that live needles on severely burnt trees can fix up to 40% more carbon than needles on trees with minimal fire damage, compensating for the greater reduction in leaf area.
We also found that burned trees maintained similar photosynthetic rates as unburned trees (figure S1) but surviving needles had significantly higher leaf water potentials during late summer drought (p = 0.02; figure 4(a)), indicating less water stress. Our post-fire results echo previous studies on tree responses to drought (Panek and Goldstein 2001, Law et al 2001), where ponderosa pine displayed lower stomatal conductance during periods of water scarcity (Misson et al 2004, Poulos et al 2020). We also found that leaf water potential significantly increased with photosynthetic capacity in burned trees (p < 0.001; figure 4(b)), providing a quantitative link between the capacity for carbon uptake (VCmax) and the degree of water stress (water potential). Furthermore, we found that photosynthetic capacity was positively correlated with leaf nitrogen concentrations (p < 0.001; figure 4(c)), suggesting that fire-deposited soil nitrogen enables the enhanced capacity for carbon uptake in needles (DeLuca and Zouhar 2000). Needle nitrogen (p = 0.03) increased with the severity of tree damage post-fire (figure S2). Our results suggest that increasing leaf-level photosynthetic capacity (VCmax) may be a critical stress-response mechanism (Renninger et al 2013, Poulos et al 2020) that enables burned P. ponderosa trees to withstand climate stress following wildfire, and that nitrogen deposited from fire most likely contributes to this process.

Figure 4. (a) Average leaf water potential (Megapascals) was similar between burned (n = 12) and unburned (n = 5) trees in June but higher in August; (b) within burned trees, leaf water potential increased with photosynthetic capacity (VCmax); (c) photosynthetic capacity (VCmax) was significantly correlated with needle nitrogen content in burned trees; (d) Root density (mg of root per cm3 of soil) declined as tree damage increased (n = 20). All error bars represent standard error within an individual tree at the 0.95 confidence interval.
Download figure:
Standard image High-resolution imageConservative leaf water potentials protect the water reserves of burned trees with damaged root systems and reduced capacity for water uptake. Supporting this rationale, we found that root density declined as the severity of tree damage from fire increased (p < 0.01, R2= 0.14; figure 4(d)). Moreover, the most severely damaged areas of the study site were associated with higher soil water content (p < 0.001; figure S3) and lower soil respiration (p < 0.05; figure S4), indicating that fire severity reduced tree water uptake and belowground activity. Intriguingly, our findings suggest the loss of belowground function may catalyze compensatory physiological responses aboveground.
Our data provide empirical support for relationships between observed tree damage and coupled above- and belowground function. As expected, photosynthetic capacity was reduced in remaining needles of burned trees, likely due to the overall reduction of leaf area and fine roots caused by fire. However, despite delayed budburst the following season (figures 1(e) and (f)), burned trees exhibited boosts in the photosynthetic capacity of remaining live needles, which increased with the severity of fire damage (figure 3(b)). Enhanced leaf-level photosynthetic capacity may therefore be a primary mechanism contributing to tree recovery following wildfire that permits continued carbon uptake (figure S1) while minimizing water stress (figure 4(a)) for severely burned trees.
3.2. Larger carbon cycling implications
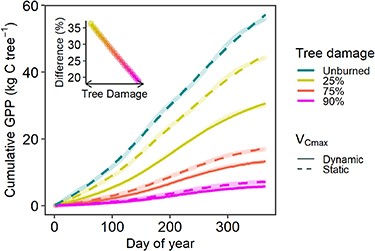
Process-based physiological models that simulate tree responses to disturbances (i.e. fire or drought) are currently limited in the ways in which physiological traits, such as VCmax, are parameterized (White et al 2000). In Earth system models, VCmax can vary across plant species or functional types (Lu et al 2022), but not in response to disturbances such as wildfire. Parameters such as VCmax are often derived from physiological literature, so providing detailed information for an ecologically important species such as P. ponderosa can significantly aid model development. We used a tree-level model (Trugman et al 2018, Mathias and Trugman 2022) to determine the potential sensitivity of typical carbon outputs to changes in post-fire VCmax values. Previous studies show that varying VCmax across seasons (Wang et al 2019) and with climate stress (Lombardozzi et al 2013) improves modeled estimates of GPP (Walker et al 2017) by ∼50% (Lu et al 2022). Our sensitivity analysis showed that models could overestimate gross primary production (GPP) for all burned trees, and by as much as 35% for the least-damaged trees (figure 5). We emphasize that models need to first reduce leaf-level photosynthetic capacity (VCmax), in addition to total tree leaf area, to accurately represent the loss of ecosystem-level carbon uptake following fire. Second, because the majority of wildfire burns forests at low- to moderate-severity (Parks and Abatzoglou 2020), where the overestimation in GPP may be largest, photosynthetic capacity should be allowed to vary by the degree of tree damage.
Figure 5. Annual cumulative tree-level gross primary production (GPP) as a function of the severity of tree damage (color scale). When VCmax is modeled as a static parameter (dashed line, representing only the reduction in leaf area), the model overpredicts GPP. VCmax should be modeled as a dynamic parameter (solid line) that varies with remaining leaf area following disturbance. Inset: the % change in predicted GPP if VCmax is dynamic rather than static.
Download figure:
Standard image High-resolution image
4. Conclusions
Current models estimate the carbon uptake potential of trees and incentivize forest management practices that generate saleable carbon offsets (Hurteau et al 2009). However, we do not adequately model wildfire damage to trees (Buchholz et al 2022), leading to management practices (e.g. salvage logging) that unintentionally result in substantial, long-term carbon losses (Hudiburg et al 2011). Our data highlight specific mechanisms for increased carbon uptake that may allow burned trees to recover and continue contributing as carbon offsets if permitted to remain in the ecosystem post-fire. We must consider the immense capacity for physiological resilience in burned trees to maintain the integrity of critical forest carbon sinks. Representing dynamic physiological mechanisms that allow trees to survive after disturbance will fundamentally improve modeled estimates of long-term forest carbon trajectories.
Acknowledgments and funding sources
The authors would like to thank Chad Hanson at Oregon State University for helping with site access, experimental design, and equipment. We sincerely thank Dr Beverly Law for establishment of the Metolius AmeriFlux site, and Dr Chris Still for continued oversight and development. Funding for this project was provided through the National Science Foundation (RAPID Response Grant No. DEB-2052571, CAREER Grant No. DEB-1553049, Collaborative Research Grant No. DEB-1655183), as well as the Office of Science (BER), U.S. Department of Energy (Grant No. DE-FG02-06ER64318).
Data and materials availability
The data that support the findings of this study are openly available at the following URL/DOI: https://doi.org/10.7923/CN15-JW37.
Author Contributions
T H and C K conceived of and designed the experiment with input from L L K B, C K, T H, J S, H K, and J M performed research and collected data. K B, J M, H K, and J S completed data analyses, and T H, C K and L L helped with interpretation. K B wrote the manuscript and all authors revised.
Supplementary data (0.6 MB PDF)