

Abstract
A growing number of studies seek to identify global priority areas for conservation and restoration. These studies often produce maps that highlight the benefits of concentrating such activity in the tropics. However, the potential equity implications of using these prioritization exercises to guide global policy are less often explored and articulated. We highlight those equity issues by examining a widely publicized restoration priority map as an illustrative case. This map is based on a prioritization analysis that sought to identify places where restoration of agricultural land might provide the greatest biodiversity and carbon sequestration benefits at the lowest cost. First, we calculate the proportion of agricultural land in countries around the world that the map classifies as a top 15% restoration priority. A regression analysis shows that this map prioritizes restoration in countries where displacing agriculture may be most detrimental to livelihoods: countries that are poorer, more populated, more economically unequal, less food secure, and that employ more people in agriculture. Second, we show through another regression analysis that a similar pattern appears sub-nationally within the tropics: 5 km × 5 km parcels of land in the tropics that are less economically developed or more populated are more likely to be top 15% restoration priorities. In other words, equity concerns persist at a subnational scale even after putting aside comparisons between the tropics and the Global North. Restorative activity may be beneficial or harmful to local livelihoods depending on its conceptualization, implementation, and management. Our findings underline a need for prioritization exercises to better attend to the risks of concentrating potentially negative livelihood impacts in vulnerable regions. We join other scholars calling for greater integration of social data into restoration science.
Export citation and abstract BibTeX RIS

Original content from this work may be used under the terms of the Creative Commons Attribution 4.0 license. Any further distribution of this work must maintain attribution to the author(s) and the title of the work, journal citation and DOI.
1. Introduction
Ecosystem restoration seeks to recover degraded ecosystems through interventions like assisted natural regeneration, tree planting and species reintroduction [1, 2]. The New York Declaration on Forests, the Bonn Challenge [3], and the UN Decade on Ecosystem Restoration [4] illustrate the high profile of restoration in global environmental discourse. When implemented effectively, restoration may provide a variety of benefits [5]. These benefits include carbon sequestration, habitat protection, improving the availability of resources that support local livelihoods [1, 2, 6, 7], erosion control, flood reduction, and pollination [8–12]. However, these benefits are not guaranteed [13–15], there may be spatial disparities in their distribution, and there may be negative impacts of restoration as well [16, 17].
A growing number of studies seek to identify restoration and conservation priorities spatially [18–24]. The maps these studies produce may be used by policymakers to inform decision-making [25]. Such studies can be valuable for improving the effectiveness of environmental policy [24, 26], identifying spaces with climate mitigation potential [18, 20, 27], and identifying synergies between biodiversity conservation and carbon sequestration goals [28–30]. These studies can also be useful for weighing the costs and benefits of land use change in different areas [19, 21].
However, these prioritization analyses and the maps they produce have attracted criticism. For example, a study of global tree restoration potential [18] was criticized for projecting tree restoration onto grasslands [31, 32]. Wyborn and Evans discuss how mapping exercises might oversimplify complex decision-making problems or crowd out information about local contexts [23]. Meyer and Pebesma point out that accuracy assessments of some global ecological maps are disputable, and that such maps may rely on inadequate reference data [33]. In contrast, others contend that despite such problems, the outputs of these prioritization exercises provide broader context for local decisions and help encourage global co-ordination [25].
To date, there are few empirical analyses of the equity issues raised by the data and processes commonly used to produce global priority maps. We argue that a better understanding of equity in this area is crucial, on both normative and feasibility grounds [34]. We understand equity as an ethical requirement to take fair and just steps to support the sustainability of socio-ecological systems [35]. Four dimensions of equity are often underscored in environmental planning [35–37]. First, procedural equity requires that decision-making procedures are inclusive and democratic, with effective participation of relevant voices. Second, distributional equity speaks to how resources, costs, responsibilities, and benefits are allocated and shared. Third, recognitional equity requires acknowledging and respecting diverse rights, values, and identities. Finally, contextual equity refers to the consideration of historical and structural socio-cultural, economic, and policy contexts.
Our study focuses most on distributional equity concerns, which have been at the forefront of environmental justice debates for decades, and are possibly easier to demonstrate quantitatively [36]. We provide an illustrative analysis of a recent, well-publicized priority mapping exercise [21] that exemplifies the challenges faced by other studies in this literature. First, we show that an output map from this study concentrates top priority restoration areas in countries that are poorer, more densely populated, more reliant on agriculture, and more food insecure. Though restoration and conservation interventions may support local livelihoods [10], they can also have negative impacts on the poor [38–40]. Restoration can involve the loss of agricultural lands [21]. It may lead to increased competition for remaining land [41, 42], the displacement of customary land uses [11, 43], or the displacement of communities themselves [44]. It can also increase the risk of detrimental human-wildlife interactions [45, 46]. A prioritization analysis that leads policymakers to concentrate restoration in lower-income countries could have serious distributional consequences depending on subsequent decisions about design, implementation, and monitoring.
Second, we show that similar distributional equity concerns persist at a subnational scale: areas within tropical countries that are less developed or more populated are more likely to be top restoration priorities. Even when cross-national comparisons between the Global South and the Global North are set aside, using extant prioritization analyses to guide policy still risks concentrating any negative impacts of restoration on communities that are less prepared to bear them.
Though our empirical analyses highlight distributional equity, we emphasize that priority setting analyses also raise potential procedural, recognitional, and contextual equity concerns. Proponents of restoration mapping may suggest that their outputs are not concrete proposals, but rather starting points for debate [25]. However, this argument sidesteps the threat such analyses pose to fair decision-making. Priority-setting exercises may shape future policy implementation, yet they often do not incorporate information on the values and interests of communities who would be most affected by restoration [37]. These communities are often overlooked in subsequent steps of the restoration policymaking process as well [47, 48]. This raises interrelated procedural and recognitional equity concerns, which may reinforce distributional consequences in the future. Meanwhile, a failure to consider aspects of the local social context, such as land tenure security, risks creating a misleading picture of global restoration priorities. This is problematic on contextual equity grounds. In sum, our study reinforces calls for better integration of social data into restoration science.
2. Methods
2.1. Exploring a single map in-depth
As a case study into the equity issues underlying global prioritization analyses, we explore Strassburg et al's restoration priority map [21]. We selected this prioritization analysis and one of its output maps for a few reasons. First, it is a well-publicized global prioritization study 13 . Moreover, it was published in a high-impact journal, represents a clear methodological improvement, and exemplifies important tensions in this literature. We emphasize that our intent is not to critique this study in particular. We are responding to calls for deeper exploration of equity issues in the prioritization literature raised by Strassburg et al themselves, as well as other recent studies [49].
Strassburg et al [21] developed a multi-criteria algorithm for optimally choosing areas for restoration while accounting for biome-specific characteristics of different parcels of land. They use this algorithm to assign restoration priority levels to 'converted lands' around the world (i.e. lands used for crops or pasture). Specifically, they break down the world's surface into 5 km × 5 km 'planning units.' Within each planning unit, they map land cover in 300 m  300 m cells to both identify agricultural lands and estimate the distribution of ecosystem types to which those agricultural lands should be restored. These authors focus on complete land use change, wherein agricultural lands are entirely converted to a natural ecosystem, making opportunity costs easier to define.
Strassburg et al [21] consider two benefits of restoring agricultural land: carbon sequestration and maintaining natural habitat. They estimate the opportunity costs of restoration based on projected profits from livestock or crop production, and they estimate implementation costs globally based on restoration projects in Brazil's Atlantic Forest [22]. Based on these spatial estimates of costs and benefits, the authors use simulations to classify planning units around the world into different restoration priority levels (top 5%, 6%–10%, 11%–15%, etc) under a range of scenarios. These different scenarios assign priorities to minimize costs, maximize carbon storage, maximize biodiversity protection, or combinations of the three. We focus on the restoration priority map for one of their scenarios, visualized in figure 1(e) of Strassburg et al [21], which identifies priority sites for restoration that maximize carbon sequestration and habitat protection whilst minimizing costs.
2.2. Initial descriptive analysis
We begin with some descriptive analysis of Strassburg et al's [21] restoration priority map. We follow an approach outlined by Strassburg et al to produce a map that identifies agricultural ('converted') land around the world at a 300 m resolution (see our supporting information for more detail). A cell is classified as being either converted cropland or pastureland (1), or not (0). We then use the priority levels from the map in figure 1(e) of Strassburg et al's [21] study to classify converted lands by their restoration priority level and calculate the proportion of high priority (global top 15%) agricultural lands that are in the tropics.
Additionally, we estimate the proportion of agricultural land in each Food and Agriculture Organization (FAO) member country that would need to be restored if a global restoration initiative targeted the planning units classified as a top 15% priority by this map. Our estimates assume the complete restoration of all agricultural land cells, as did the original prioritization analysis.
2.3. National-level regression analysis
We use ordinary least squares (OLS) linear regressions to explain variation in the proportion of agricultural land in a country that is classified as a top 15% restoration priority (the dependent variable; 'top priority land'). Our primary regression model includes the following explanatory variables: population, wealth (gross domestic product, GDP), economic inequality (Gini index), governance (democracy and human rights scores), and a country's land area (added as a control) 14 . We include population and wealth in this model to explore whether more populated or less wealthy countries tend to contain more top priority land. We include a measure of economic inequality given past research investigating the relationship between inequality and conservation policymaking [48]. The Gini index is a well-established indicator of economic inequality that measures the dispersion of income in a country, such that a low score indicates a highly equal income distribution while a high score indicates a highly unequal income distribution.
To see the logic for our inclusion of two governance measures, consider that some countries may pursue restoration and conservation in more coercive ways than others, or may be more likely to infringe on communities' rights and implement environmental policies without consideration of local livelihoods. National-level measures of the incidence of conservation-induced displacement, for example, are not readily available, so we can only proxy for these inclinations indirectly. Measures of the extent of liberal democracy—characterized by the protection of individual liberties and limits on state authority [50]—and the extent of human rights protection are some of the better proxies available at a cross-national scale. A previous analysis of the interactions between inequality, democracy and the legal designation of protected areas in a global sample of 137 countries shows that, ceteris paribus, the relationship between inequality and protection varies depending on the strength of democracy: in relatively democratic countries inequality is associated with less land in protected areas, whereas in relatively undemocratic countries the reverse is true [48].
Where appropriate, we log transform variables before including them in our analysis. See our supporting information for more detail on our national-level analysis, data sources (SI sections 1, 2, 4 and table S2), and for a full results table based on our primary regression model (table S3). After estimating our primary model, we estimate four additional regression models that each replace GDP and the Gini index with various alternative economic measures (and also omit the governance measures). The alternative economic measures are: (a) the percent of farms smaller than 5 ha (as a proxy for the prevalence of smallholder farming); (b) a measure of food availability (the percent of an average person's daily caloric needs that can be met by food availability in a country); (c) the percent of a country's citizens employed in agriculture; and (d) a country's average radiance at night (average 'nighttime lights'), which is increasingly used as an indicator of national economic production [51], especially production linked to the manufacturing and service sectors [52–54]. Again, see our supporting information for more detail on data sources, and for a full regression table including each of these additional models (table S4).
2.4. Subnational-level regression analysis
Finally, we analyze approximately 820 000 planning units (parcels) from FAO member countries with at least 20% of their land area in the tropics. Parcels were only included in our sample if they also had a restoration priority level assigned and if they contained at least 10% agricultural land. We first analyze the entire sample of parcels that meet our criteria. Then, to help address possible spatial dependence concerns [55], we repeat our analysis on a randomly chosen 5% of parcels, decreasing the likelihood that remaining parcels will be close together. A similar strategy has been applied, for instance, in work examining the impacts of protected areas [56–58].
Our dependent variable here is binary: whether a parcel is classified as a top 15% priority ( ) or not (
 ). We explain variation in this measure using both logit regression models and linear probability models (LPMs), though we focus on the linear probability model results for ease of interpretation.
Our first explanatory variable is a parcel's level of development, based on nighttime lights data. Nighttime lights data can provide reasonable estimates of economic development at local scales [51, 54], though it becomes especially difficult to link nighttime lights to specific components of development (e.g. urbanization, infrastructure growth, manufacturing sector activity, etc). Nighttime lights are therefore more useful in this analysis as a summary measure of overall economic and infrastructure development [51]. Additionally, note that nighttime lights data struggle to measure the light emissions produced by poorer rural households in lower-income countries [59, 60]. It may be more appropriate to treat these data as measures of development related to sectors of the economy aside from rural smallholder agriculture, rather than presuming they provide a complete picture of local variation in wealth.
Our second explanatory variable is the average population density of a planning unit. To adjust for skew in the distribution of both explanatory variables, as well as an established non-linear relationship between nighttime lights and economic development, we add a constant of 0.01 to both and then log transform them before fitting our models [54, 61]. Our supporting information provides more detailed discussion of our parcel-level data, measurement and transformation choices, and modeling choices (SI appendix sections 1–4). It also includes parcel-level summary statistics (table S5).
We conduct this analysis within a multilevel modeling framework, estimating random country-level intercepts. We also include additional control variables for mean nighttime lights and total population at a country level (both logged and mean-centered). For computational reasons, we approximate multilevel logit models using a generalized additive modeling (GAM) approach (see SI 4, tables S6 and S7).
3. Results
3.1. Targeting the tropics for restoration
Figure 1 shows estimated converted (agricultural) lands around the world, classified by their restoration priority level [21]. As explained above, these priority levels were assigned based on an efficiency criterion (maximizing environmental benefits while minimizing economic costs). Of all the 5 km × 5 km planning units around the world classified as a top 15% priority, we find that approximately 85% are located in the tropics. Importantly, this prioritization analysis is not unique in that regard—due to its high concentrations of biodiversity and carbon sequestration potential [20, 28], other analysts also identify the humid tropics as a place where climate change mitigation strategies could be most efficiently concentrated [18, 27, 62]. We return to this issue below.
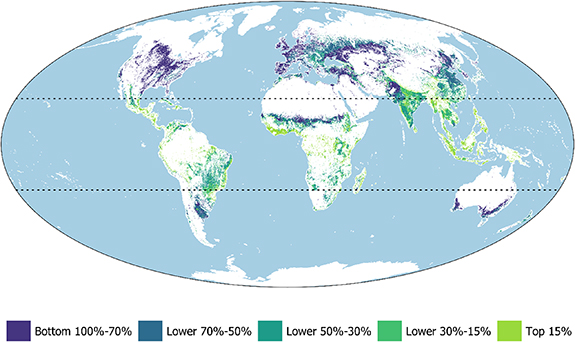
Figure 1. Estimated agricultural lands by their restoration priority. We mapped agricultural (i.e. converted) land in each FAO member country following a procedure described by Strassburg et al [21]. We then used their map of priority scores to classify these lands based on their restoration priority percentage and aggregated these percentages into five categories (see the legend). Figure 1e in their study presents similar information.
Download figure:
Standard image High-resolution imageNext, for every FAO member state, we calculated the proportion of its agricultural land classified as a top 15% restoration priority (i.e. that would be restored under a hypothetical global 15% initiative guided by this map). We provide a sample of these estimates in table 1. Our supplementary information includes an extended version of this table (table S1) and a color-coded map that visualizes these estimates for every FAO member state (figure S1). Indeed, many tropical countries would need to restore substantial portions of their agricultural land to natural ecosystems, whereas most countries outside the tropics would not.
Table 1. Agricultural land to restore under a global 15% plan following Strassburg et al [21].
| Country | Proportion of agricultural land to restore |
|---|---|
| Equatorial Guinea | 99.6% |
| Philippines | 96.7% |
| Nicaragua | 87.2% |
| Nepal | 83.9% |
| Indonesia | 82.5% |
| El Salvador | 62.4% |
| Uganda | 34.1% |
| Tanzania | 31.5% |
| Brazil | 16.7% |
| India | 12.6% |
| Malawi | 10.6% |
| New Zealand | 1.4% |
| United States | 0.1% |
| Ukraine | 0.1% |
| Germany | <0.1% |
If Strassburg et al [21] map from figure 1(e) of their study was followed to implement a 15% global restoration target, the estimates in this table represent the percent of agricultural land that 15 select countries would need to restore to a natural state. We selected countries for this table based on the expertise of members of our research team and with an eye towards representing different continents.
3.2. The national implications of a prominent restoration map
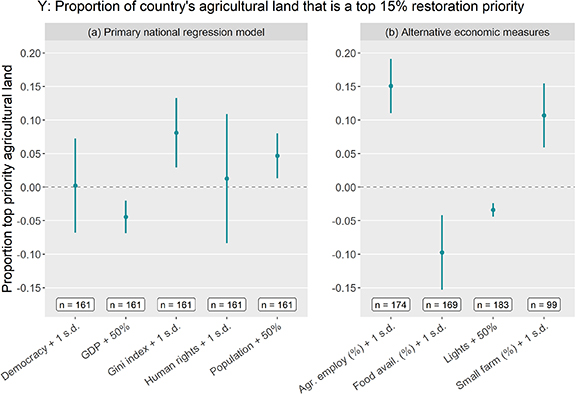
Results from our primary national-level regression model (table S3), visualized in panel (a) of figure 2, show that countries have less of their agricultural land classified as a top 15% restoration priority ('top priority land') if they are wealthier, less populated, and have less economic inequality. Panel (b) visualizes the additional results for our regression models that use alternative economic measures (table S4). It shows that countries have more top priority restoration land if they have higher employment in the agricultural sector and if farms are smaller (less than 5 ha). Countries have less top priority land if they have more food availability (% daily dietary energy available), or if they are brighter at night (a proxy for economic development).
Figure 2. Country-level correlates of expected restoration on agricultural land. Results in panel (a) are based on coefficient estimates from a country-level regression model that also controls for a country's land area. Results in panel (b) are based on coefficients from four separate linear regression models, each controlling for a country's population and land area. For explanatory variables included in these regressions on a log scale, we use a 50% increase as a benchmark, and 1 s.d. increase otherwise. We present normal-theory 95% confidence intervals for these estimates based on HC2 robust errors. Sample size is based on data availability. Units are FAO member countries (out of 194 total).
Download figure:
Standard image High-resolution image
3.3. Subnational implications within the tropics
On average, 5 km × 5 km parcels of land in a tropical country that are darker at night are more likely to be top 15% restoration priorities. For instance, per the linear approximations in Model 1 of table 2, when (logged) parcel lights increase by one standard deviation (+1.65), the probability that a parcel is a top 15% restoration priority declines by 3.47%. Further, the average within-country difference between the brightest and dimmest (logged) parcel light value is 7.03. Model 1 therefore suggests that the brightest parcels in an average tropical country are approximately 14.7% less likely to be top restoration priorities than the dimmest parcels. Moving to the result for population, our analysis shows that more populated parcels are more likely to be top restoration priorities. A one standard deviation increase in logged population (+2.55) is associated with a 3.06% increase in the probability of being a top restoration priority, while the average within-country range of logged population (8.46) implies a 10.15% increase.
Table 2. Parcel level regression results (tropical countries).
| Dependent variable | ||||
|---|---|---|---|---|
| Top 15% priority planning unit? (0/1) | ||||
| LPM | LPM | Logit | Logit | |
| (1) | (2) | (3) | (4) | |
| Parcel lights (log) | −0.021*** | −0.020*** | −0.139*** | −0.133*** |
| (0.0004) | (0.002) | (0.003) | (0.012) | |
| Parcel population (log) | 0.012*** | 0.011*** | 0.085*** | 0.073*** |
| (0.0003) | (0.001) | (0.002) | (0.010) | |
| Country lights (log) | 0.051*** | 0.048** | 0.411** | 0.359** |
| (0.016) | (0.019) | (0.164) | (0.154) | |
| Country population (log) | −0.075*** | −0.067*** | −0.670*** | −0.415** |
| (0.016) | (0.021) | (0.176) | (0.175) | |
| Constant | 0.240*** | 0.256*** | −2.093*** | −1.673*** |
| (0.052) | (0.057) | (0.518) | (0.455) | |
| Random sample (5%) | No | Yes | No | Yes |
| GAM | No | No | Yes | Yes |
| sd (constant) | 0.318 | 0.327 | 3.117 | 2.599 |
| Countries | 97 | 89 | 97 | 89 |
| Observations | 837 468 | 41 860 | 837 468 | 41 860 |
Note: **
p < 0.05 ***
p < 0.01.This table presents coefficients from two multilevel linear probability models and two multilevel logit models (estimated using a generalized additive modeling approach). All models include a country-level random intercept and country-level controls for development and population (logged and mean-centered). Models 1 and 3 are fit for all parcels that satisfy our inclusion criteria (in a tropical country, at least 10% agricultural land, and a non-missing restoration priority score), while Models 2 and 4 are fit on a dataset produced by randomly sampling 5% of these parcels. Coefficients for the linear probability models represent average changes in  associated with
  . Coefficients for the logit models instead represent changes in log odds.
4. Discussion
We provide an illustrative case study of a prioritization analysis that sought to locate the restoration of agricultural land in areas where it would provide the greatest ecological benefits (in terms of habitat protection and carbon storage) at the lowest cost [21]. We show that the map produced by this analysis concentrates top priority restoration areas in the global tropics. Moreover, we show that many tropical countries have substantial portions of their agricultural land classified as a top restoration priority, while countries outside the tropics largely do not. It is worth emphasizing that countries at the top of table 1, for example, would not be able to restore so much agricultural land—food needs, employment needs, and the cultural value of agricultural lands would clearly prohibit it. Moreover, earning the cooperation of decision-makers in many countries with a restoration initiative that involves substantial loss of agricultural land would require a complicated political process, as would developing a program to compensate communities whose livelihoods are displaced [24]. Similar compensation programs have struggled in the past [63–65], and it is not clear how an initiative to substantially increase restoration in the tropics would overcome this hurdle.
Of course, many other analysts also point out the possible benefits of concentrating restoration and conservation interventions in the tropics. For instance, Bastin et al argue that loss of forest habitat in the tropics presents the greatest threat to global potential canopy cover [18]. Similarly, Walker et al seek to map the global distribution of carbon storage opportunities, and in particular the distribution of unrealized opportunities for carbon storage [27]. These authors argue that a majority of unrealized carbon storage potential is found in tropical regions. Lewis et al provide a commentary which argues that expanding natural forest restoration in the Tropics and Subtropics is essential to fighting climate change, given the quick pace at which trees grow and sequester carbon, and this region's cheaper land prices [62].
Our regression analyses help better illustrate the distributional equity issues that such arguments raise. First, our national level regression results imply that countries with more agricultural land classified as a top restoration priority are also those whose populations are most dependent on agriculture. While the restoration of nature can facilitate human well-being, these benefits may not outweigh the costs incurred where activities like farming are the main source of food security and income. Plans that do not explicitly call for restoring agricultural land could still threaten communities in highly populated, agriculturally reliant countries due to increased competition for land or land-use displacement [11, 41, 42].
This finding may seem obvious, in that the economies of tropical countries are known to be relatively more dependent on agriculture. However, that obviousness raises a troubling question: why have the possible negative impacts of concentrating restorative activity in lower-income countries been an infrequent consideration in priority setting analyses?
Second, our subnational regression analyses suggest that areas of the tropics with relatively fewer livelihood opportunities besides agriculture (i.e. with less light-emitting economic activity) are also more likely to be targeted for restoration. Again, it could also be argued that this finding is not surprising. Unpopulated parcels, or those with a low population, may represent existing natural ecosystems that need less restorative activity. Meanwhile, parcels that are brighter at night may represent areas where expensive infrastructure is more concentrated, leading to higher restoration opportunity costs. However, again, this supposed obviousness is part of our point. Prioritization analyses may often locate restoration and conservation priorities in places where these activities raise greater social equity concerns. Seemingly rational prioritization criteria may obscure equity issues that need to be discussed more openly.
More broadly, we reiterate that restoration interventions have the potential to benefit or harm local livelihoods depending on their consideration of social equity [35–37, 66]. This includes the distributional concerns that we highlight above, but also inter-related procedural and recognitional concerns regarding whose interests are acknowledged and incorporated into restoration decision-making. Additionally, it includes contextual concerns regarding how interventions are adapted to their circumstances.
In turn, whether it is problematic to allow optimization exercises to guide global restoration priorities also depends on their engagement with these issues. For example, it depends on analysts' decisions about what constitutes 'restoration.' Mapping exercises often estimate the benefits of restoration by assuming complete land use change [19, 21, 22]; e.g. restoring a pasture entirely to natural forest. However, it is also possible to integrate restoration into existing agrarian landscapes, which requires less displacement of local land uses [10, 67, 68]. Making an informed choice between complete and partial land use change requires weighing the different social impacts of these strategies, as well as their relative contributions to carbon storage and biodiversity protection. Extant prioritization analyses often do not provide sufficient information on these tradeoffs. As another example, prioritization analysis also requires making decisions about how the human population of an area should influence its status as a restoration or conservation priority. While Strassburg et al [21] focus on restoring agricultural land, other studies rule out crop lands, grazing lands, and areas of human habitation ex ante on the grounds of equity and feasibility [27, 69].
Relatedly, it is important to critically evaluate the data inputs to global environmental assessments [70]. The various decisions we highlight above should, on equity grounds, consider the interests and welfare of affected communities [35, 71], but omitting relevant social data makes doing so impossible. Moreover, restoration and conservation prioritization analyses may not properly account for the spatial distribution of various costs [72–74], the extent of feasible land area [69], or important spatial variation in the probability of success [75]. Information on land tenure, local socio-economic conditions, and the priorities of government officials may be important to understanding restoration's true costs in a given locale, or the probability that its intended benefits will materialize [14, 76]. But prioritization studies do not commonly include this information in their analyses.
As we point out above, Strassburg et al call attention to several of the issues we discuss, including the large proportion of agricultural land in some countries that is classified as a top 15% restoration priority [21]. They also discuss the need for deeper consideration of equity issues. Our exploration of one of their output maps takes this call further. Incorporating more social data into prioritization analyses will help re-orient those who create such maps towards a broader conceptualization of sustainability [35, 49] and aid in the search for compromise solutions between opponents and supporters of global mapping exercises. Ideally, prioritization analyses should provide opportunities for affected communities to participate in the mapping process, helping these analyses to better consider local knowledge, experiences, and aspirations. Examples include mapping done through the Restoration Opportunities Assessment Methodology [77, 78], as well as a recently developed systems approach to evaluating tree-restoration interventions which incorporates indicators of social and wellbeing outcomes alongside indicators of biodiversity and climate change mitigation [79]. Participatory mapping processes can be further strengthened with land tenure diagnostic tools [80]. Assessing the tradeoffs that restoration may imply under varying governance and land use arrangements should become a more foundational aspect of restoration planning [79].
In conclusion, we underscore the importance of engaging in critical discussions about the goals of prioritization maps. Recent defenses of restoration mapping move in the right direction by laying out some possible benefits of these exercises more precisely [25]. But there is also a need for more discussion about whether these benefits outweigh the possible consequences of prioritization exercises: first, a risk of concentrating restoration in regions where possible negative livelihood impacts would be the most severe [39, 43, 44, 81, 82]; and second, a risk of crowding-out other strategies for identifying more just and pragmatic policy goals [23] or undermining the ability of local stakeholders to participate in land use decisions [47]. Both consequences point to a need for complementary, bottom-up approaches to setting restoration priorities.
Data availability statement
The data that support the findings of this study are available upon reasonable request from the authors.
Acknowledgments
The authors are grateful for generous support from Formas, a Swedish government research council focused on sustainable development (grant numbers 2020-02781 and 2020-02872).
Author contributions
E C, F F, and P K conceived the study. B S led the writing process and conducted the analyses. All authors contributed to writing and the development of our arguments.
Conflict of interest
We have no competing interests to disclose.
Footnotes
- 13
For instance, it was referenced in an article of the New York Times [83], and as of 8 February 2022, the study had an Altmetric score of 1867.
- 14
Though land area is of less substantive interest, it may still be important to include in our models. Larger countries tend, for instance, to have a greater GDP and a greater population. They may also tend to contain more top priority land, simply by virtue of their size.
Supplementary data (0.1 MB PDF)
Supporting Information (0.3 MB PDF)