


Abstract
Heat has become a central concern for cities everywhere, but heat governance has historically lagged behind other climate change hazards. This study examines 175 municipal plans from the 50 most populous cities in the United States to understand which aspects of urban heat are included or not in city plans and what factors explain inclusion. We find that a majority of plans mention heat, but few include strategies to address it and even fewer cite sources of information. The term 'extreme heat event' (EHE) is significantly more likely to be paired with institutional actions as a part of hazard planning, while 'urban heat island' (UHI) is more likely to be paired with green and grey infrastructure interventions as a part of general planning. Disparity and thermal comfort framings are not significantly related to any solutions and are used least. Plan type, followed by environmental networks (e.g. C40, Urban Sustainability Directors Network, Rockefeller 100 Resilient Cities), explain variation in plan content; social and environmental context do not. Findings point to the emergence of two independent heat governance systems, EHE and UHI, and several gaps in heat planning: integration, specificity, solutions, disparity, economy, and thermal comfort.
Export citation and abstract BibTeX RIS

Original content from this work may be used under the terms of the Creative Commons Attribution 4.0 license. Any further distribution of this work must maintain attribution to the author(s) and the title of the work, journal citation and DOI.
1. Introduction
Heat is a central concern for cities everywhere. Fundamentally, the term 'heat' 7 describes a thermal state determined by multiple climate-related variables including air temperature, radiation, humidity, and air movement that have consequences for the human body and biophysical systems (Oke 1982, Parsons 2002, Kuras et al 2017). Those thermal states are consequential to cities as a set of impacts on people and places. For instance, extreme heat—a thermal state that has negative consequences for human bodies—is one of the deadliest climate change impacts globally and predicted to increase with future urban population growth and an extreme heat event (EHE) frequency and severity (WHO, C40, Madge 2011, Mora 2017, Buchanan 2021, Tuholske et al 2021). Impervious surfaces such as asphalt and other attributes of the built environment contribute to states such as local warming and the regional urban heat island (UHI) in most urbanized regions (Oke 1982, Grimm et al 2008, Imhoff et al 2010, Stewart and Oke 2012, Lazzarini et al 2013, Hardin et al 2018). The combined effects of global and urban-scale warming are disproportionately felt by marginalized groups due to higher heat exposure and lesser capacity to cope with hot conditions (Harlan et al 2006, Eisenman et al 2016, Hoffman et al 2020, Dialesandro et al 2021). Excess heat can amplify other environmental problems, worsening air and water quality, increasing wildfire risk, and greenhouse gas emissions through higher energy demand for cooling (Santamouris 2020). Heat has consequences for every aspect of urban life: it compromises critical urban infrastructure (Chapman et al 2013), lowers educational outcomes (Park et al 2020), increases pre-term births (Barrecca et al 2018, Barecca and Schaller 2020), and reduces labor productivity (Park 2021). Given that urban heat is a multi-faceted problem, cities will need to pursue a suite of different approaches to effectively govern a hotter future.
Few governing institutions at any jurisdictional scale have historically formally, directly, or comprehensively managed heat (Nordgren et al 2016, DeShazo et al 2021, Gabbe et al 2021, Keith et al 2021, Meerow and Keith 2021). Some of the first efforts to mainstream heat response and management by government and international non-government actors 8 laid the foundation for a current acceleration in action 9 . The distributed network of response to heat suggests that nascent urban heat governance systems are emerging. Environmental governance refers to the 'set of regulatory processes, mechanisms and organizations through which political actors influence environmental actions and outcomes' (Lemos and Agrawal 2006, p 298). Problem framing is a critical function in environmental governance, because it constrains what solution sets are deemed critical and which institutions take ownership of governance (Adger et al 2011, Whittemore and BenDor 2018), with downstream implications for what aspects of a problem are addressed or not. Heat governance framing directs attention to particular consequences of elevated temperature for people and places, with implications for what constitutes a desirable state and if and how to address it.
Municipal plans provide insight into prevailing problem framings through inclusion of particular policies, programs, and initiatives and alignment with a specific high-level 'vision' (e.g. sustainability, resilience) (Berke and Godschalk 2009). Those broad visions are an amalgamation of policy agendas set in consultation with environmental networks and local innovations (Broto and Bulkeley 2013, Nordgren et al 2016). Plans—or networks of plans—do not encompass the full variety of actors, tools, and narratives present in a governance system, but do signal which environmental agendas are included and prioritized in formal in city governance (e.g. Berke et al 2000, Tennoy 2010, Berke et al 2019).
This study characterizes priorities in urban heat governance as articulated in formal municipal planning documents. Specifically, we ask: How is the problem of urban heat framed? What solutions are included, and how do solutions relate to problem framing? What characteristics of plans or cities that the plans originate from explain variation in plan content? We answer these questions through a content analysis and compare the results of the plan analysis to major themes identified in a recent systematic review of the 539 peer reviewed articles on heat, which confirms that EHE, UHI and, increasingly, heat disparity and thermal comfort are emphasized (Stewart 2011, Rupp 2015, Horton 2016, Wilson 2020, Keith et al 2021). We conclude with a discussion of potential knowledge-action gaps apparent in heat plans.
2. Methods
2.1. Plan database
This study draws from a published database analysis of heat-related content in municipal plans (n = 175) adopted between 2006 and May 2020 in the most populous cities (n = 50) in the United States (2005–2020) (appendix
2.2. Content analysis
We focused our analysis on output on plans (n = 175) that mention heat, summing frequency and occurrence of primary plan content variables and calculating Kendall correlation coefficients for non-normally distributed data on all primary and secondary variables to determine the relationship among coded content variables within plans and between coded content variables in plans and characteristics of the cities from which the plans originated. Non-parametric Kruskal–Wallace (KW) tests were used to determine if occurrence of primary coded variables varied significantly by plan type and region, which were independent (mutually exclusive) samples. We conducted non-parametric Mann–Whitney tests for our network memberships which were non-independent samples because plans could be from cities that were members of more than one environmental action network (C40, Urban Sustainability Directors Network, Rockefeller 100 Resilient Cities). To determine if our secondary social and environmental variables predicted plan content, we ran a series of stepwise regressions using heat problem framings dominant in science literature: general heat, EHE, UHI, thermal comfort, and disparity (a combined indicator: general vulnerability, exposure, sensitivity, adaptive capacity, and equity).
3. Results
3.1. Frequency and occurrence of coded variables
Heat was mentioned at least once in most plans (n = 153, 87%). On average, plans mentioned heat 43 times (min = 1, max = 250), with a larger number of plans mentioning heat fewer times. There was no clear pattern (e.g. population size, region) across cities with plans that did not mention heat. Only 33% of the plans mentioned any data source related to heat.
Among plans mentioning heat, a general heat framing (n = 121, 79%) with no further clarification was most pervasive (figure 2). The most common heat problem framings in the plans were UHI (n = 116, 76%) and EHE (n = 116, 76%). Other framings appearing in more than half of the plans included health (n = 100, 65%), ecology (n = 95, 62%), and energy (n = 91, 59%). No disparity framing appeared in more than half of the plans and equity appeared in less than one third (n = 47, 31%). All other framings inclusive of co-occurring environmental problems and municipal services appeared in fewer than half of the plans. Few plans included human thermal comfort framings (n = 29, 19%).

Figure 1. Cities included in analysis by climate region.
Download figure:
Standard image High-resolution image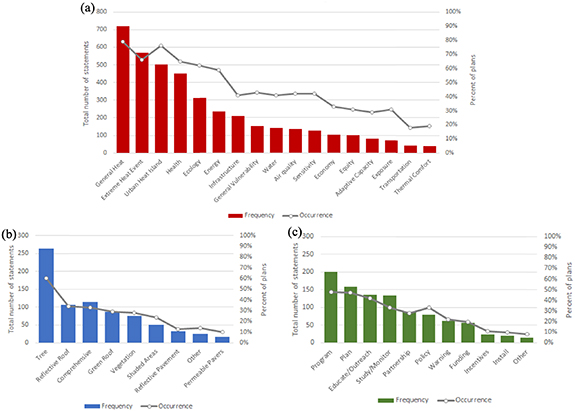
Figure 2. Plan content summary. Frequency of statements (bars) and percent occurrence in plans (lines) of primary coded variables: framings (red), hard interventions (blue), soft interventions (green).
Download figure:
Standard image High-resolution image
Soft interventions (n = 982) were mentioned more frequently than hard interventions (n = 788), which mostly included trees (n = 525, 67%). Trees (n = 92, 60%) were included in more than twice as many plans as any other hard intervention. No other hard or soft intervention was included in more than half of the plans that mentioned heat.
3.2. Relationships between plan content variables
None of the primary heat framings in the academic literature—EHE, UHI, thermal comfort, and equity—were strongly correlated with one another (appendix
3.3. Explaining differences in plan content
The KW tests reveal variation in content by plan type (appendix
Region explained some differences in plan content, but never with more than 95% confidence (appendix
Results of the Mann–Whitney test revealed that cities with membership in environmental networks were more likely to include several heat content variables—mostly a wider range of framings and soft interventions as opposed to hard interventions—with some minor differences across networks (appendix
In the stepwise regression models (table 1), none of the models based on secondary social and environmental variables predicted substantial percentages of variation in plan content. The models did reveal some similarities and differences in the factors that predicted inclusion of different framings. Larger population predicted inclusion of general heat, EHE, and disparity framings (all p < 0.001) and newer plans were modestly more likely to include general heat, UHI, and disparity framings (p < 0.05). Higher spending per capita predicted inclusion of a disparity framing (p < 0.001), which was the model with the highest overall predictive power (adjusted R2 0.234). Other than population, no variable predicted inclusion of EHE framing. Demographic and environment variables had mixed and modest predictive power in the remaining framing models. For instance, higher percent Asian population predicted inclusion of a disparity framing (p < 0.01), but no other racial or demographic category predicted inclusion of any framing with more than 95% confidence. Similarly, the only environmental variables that predicted inclusion of framings with more than 95% confidence were historic summer high temperatures, which predicted inclusion of thermal comfort (p < 0.01), and higher mid-century (p < 0.01) but lower late century (p < 0.01) summer high temperatures, which predicted inclusion of a disparity framing.
Table 1. Municipal context factors explaining key frame inclusion. Stepwise regression models including coefficient estimates, 95% confidence intervals (CI), and significance level.
| Disparity | Extreme heat event | General heat | Thermal comfort | Urban heat island | ||||||
|---|---|---|---|---|---|---|---|---|---|---|
| Coefficient | Estimates | CI | Estimates | CI | Estimates | CI | Estimates | CI | Estimates | CI |
| Intercept | 1.78 | −2.71–6.27 | 0.64 | −0.50–1.78 | 2.37 | −6.30–11.03 | −0.61 | −1.62–0.41 | 5.54 | −8.99–20.08 |
| Population | 0.00 *** | 0.00–0.00 | 0.00 *** | 0.00–0.00 | 0.00 *** | 0.00–0.00 | ||||
| Age | −0.11 * | −0.21 to −0.01 | −0.30 * | −0.54 to −0.07 | −0.02 | −0.05–0.00 | −0.20 * | −0.36 to −0.04 | ||
| Spending per capita | 0.06 *** | 0.03–0.10 | −0.13 | −0.27–0.00 | ||||||
| % Asian | 0.07 ** | 0.03–0.11 | ||||||||
| % Black | 0.31 | −0.07–0.69 | 0.85 | −0.02–1.71 | 0.07 | −0.02–0.16 | ||||
| %LatinX | −0.12 | −0.26–0.02 | ||||||||
| % Native | −0.24 | −0.54–0.06 | ||||||||
| % Non White | −0.21 * | −0.39 to −0.02 | ||||||||
| %White | 0 | −0.00–0.00 | ||||||||
| % Under 18 | −0.37 * | −0.71 to −0.02 | 0.24 | −0.00–0.47 | ||||||
| % Over 65 | −0.12 ** | −0.20 to −0.04 | −0.59 * | −1.14 to −0.05 | ||||||
| Mid century Tmax | 0.05 ** | 0.01–0.09 | ||||||||
| Late century Tmax | −0.07 ** | −0.12 to −0.03 | ||||||||
| NOAA precip annual | 0.13 * | 0.02–0.24 | −0.02 * | −0.03 to −0.00 | ||||||
| Summer Tmax 1971–2000 | 0.14 ** | 0.05–0.23 | 0.64 * | 0.06–1.22 | ||||||
| Current summer Tmax | 0.05 | −0.01–0.10 | ||||||||
| Observations | 175 | 175 | 175 | 175 | 175 | |||||
| R2/R2 adjusted | 0.269/0.234 | 0.217/0.213 | 0.205/0.177 | 0.092/0.065 | 0.121/0.079 | |||||
*p < 0.05, **p < 0.01, ***p < 0.001.
4. Discussion
Heat was mentioned in almost all of the plans we analyzed, indicating that most cities at least include it among the environmental problems they need to address. Although a 2015 study of climate adaptation plans and other resources in the United States found that only 4% targeted extreme heat (Nordgren et al 2016). Just five years later, our study found that 78% of the climate plans (inclusive of mitigation and adaptation) in our study made such a reference. This result may signal that heat is a rising priority, but change over time is difficult to assess with certainty because few studies have examined heat specifically; most plan analysis focus more broadly on climate adaptation planning (e.g. O'Neill et al 2010, Pietrapertosa et al 2019, Berrang-Ford et al 2021). There were no clear patterns among plans that did not mention heat. However, a recent national survey found that small and mid-sized cities were less likely to have planning staff devoted to heat (Keith et al 2020). Our study only examined large cities, so we were unable to confirm disparities based on city-size. Our results suggest that the inclusion of heat, however numerous the mentions, may not be substantive given that no framing ('general heat') was most prevalent and invocation of solutions or data were scant. This finding aligns with assertions in recent studies that heat governance is not yet well developed in cities (e.g. Gabbe et al 2021, Keith and Meerow 2021, Keith et al 2021).
Plans do not include a wide variety of interventions. Similar to other studies we found that one intervention—trees—was by far the most prevalent hard or soft intervention mentioned (Gabbe et al 2021, Meerow and Keith 2021). Many cities may already have forestry initiatives (e.g. Million Tree Programs), and trees are commonly associated with heat mitigation and adaptation co-benefits (e.g. Pincetl 2010, Rahman et al 2020, Werbin et al 2020, Roman et al 2021, Sharifi 2021, Angelo et al 2022). Disambiguating whether heat-specific action was a primary or co-benefit of tree-programs was beyond the scope of this study, but future studies should investigate this further, since tree placement may need to be different to effectively provide shading versus stormwater runoff control, for instance (e.g. Depietri et al 2012, Demuzere et al 2014, Haase et al 2014, Bodnaruk et al 2017, Depietri 2022). 'Plans' as a soft intervention, were the only other strategy mentioned more than half of the time. It is likely that references to plans and other soft intervention categories such as 'programs' in high level planning documents cite municipal initiatives that are more fully formulated in external documents. While a closer look at municipal heat programs and initiatives is warranted, a recent survey found that fewer than a quarter of cities had any policy on heat (Keith et al 2021), and a recent comprehensive report on state-level initiatives in California found that heat is rarely the central feature of policies, the consequence of which is large gaps in overall heat governance (LCI report). Moreover, we confirm that the most plans fail to frame the problem of heat with any level of specificity (Gabbe et al 2021). It would be difficult to formulate an effective response to a problem without more specific discussion of the causes and consequences of the problem. Taken together, these findings lend credence to the assertion that cities could be doing far more to govern heat (Keith et al 2021).
If heat was framed as a particular problem, the two most prevalent heat framings in our study were UHI and EHE, in alignment with peer reviewed literature recently summarized by Keith et al (2020). Scientific perspectives are shifting, for instance, skepticism that UHI is relevant to local planning compared to paradigms such as Local Climate Zones that take into account a variety of land morphology features (Stewart and Oke 2012, Martilli et al 2020, Venter et al 2021, Turner et al 2022, Wang 2022). EHE and UHI were not correlated with one another, correlated with distinct sets of interventions, and mentioned in different plan types. The EHE narrative appears to be more ubiquitous across plan types—especially Hazard plans that are required at the county level—and is associated with a variety of other problem framings, but only soft interventions. Interestingly, warning systems were among the least mentioned soft interventions in plans, perhaps because these are issued by Federal entities. UHI, on the other hand, was associated with hard interventions but not soft, and appeared in most general plans (more often than EHE). This finding supports the observation that two, distinct heat governance systems emerge—heat-as-hazard and heat-as-land-planning—that emphasize acute and chronic aspects of heat separately (Keith et al 2020). This finding underscores the need for integrated planning across the two domains (Keith et al 2021).
Our results suggest that plans do not include key framings we would expect to find in robust plans to protect people from heat. Thermal comfort, and its primary outdoor antidote, shade, were largely absent from the plans. The everyday lived experience of heat is one of the most direct ways that cities can influence urban climate by providing shade (Middel et al 2016). Recent work even provides cities with guidance on the relative effectiveness of different shade interventions (Rahman et al 2020, Middel et al 2021). This study focused on outdoor interventions and, potentially, plans might include indoor interventions like air conditioning as the central strategy for addressing thermal comfort. A recent study found, however, that most plans fail to link issues of housing to climate impacts in Climate Action Plans (Angelo et al 2022). The prioritization of heat as an acute risk (e.g. EHE, 'heatwave') and focus on mortality as a public health outcome may, inadvertently, diminished the role of heat exposure as a chronic stress in municipal responses (Bolitho and Miller 2017). Even the term 'thermal comfort,' which is widely used in the academic literature, frames thermal conditions in the positive. Terms such as 'heat stress' and 'thermal burden' better reflect the myriad problems that occur due to exposure to chronically hot conditions. The scant use of thermal comfort and shade in the plans we analyzed is somewhat unsurprising given shade is not a central means to mitigate UHI, nor is it the most effective means to save lives during EHEs if core body temperatures reach dangerous thresholds (e.g. Eisenman et al 2016). The gap between scholarship on thermal comfort, which is growing (Rupp et al 2015), and prevalence in the plans analyzed in this study, which is small, is one of the largest knowledge-action rifts we observed.
Disparity was another significant knowledge-action gap. A preponderance of evidence has demonstrated that heat disproportionately burdens communities of color (Harlan et al 2006, Eisenman et al 2016, Hoffman et al 2020, Dialesandro 2021), but heat was only framed as an equity issue one third of the time. Vulnerability was more likely to be deployed as a disparity framing (Keith et al 2020). When an equity framing was deployed, it was more likely to co-occur with extreme heat and health framings, which aligns with other research finding that social equity is most often framed as a public health risk or impacts (Fiack et al 2021). This aligns with other studies reporting that equity is often missing in climate planning (Schrock et al 2015). Moreover, none of the disparity framings were related to any hard or soft interventions. The lack of high-level prioritization of equity or vulnerability in plans may have tangible implications for heat governance in action. Few planners reported using vulnerability assessments or mapping tools (Meerow and Keith 2021).
Economic framings were also rarely deployed. A recent national survey of municipal planners returned similar findings (Meerow and Keith 2021). Yet, decision makers have reported that evidence of economic impacts and costs of inaction are critical for spurring action (AGCI 2020). A recent report found that in the United States extreme heat is projected to cost nearly half a trillion dollars and will likely disproportionately impact sectors that employ people of color and the South and Southeastern regions (Arsht-Rockefeller report). The economics of urban heat—especially city-specific characteristics—are, therefore, an important gap in both heat scholarship and planning (The Nature Conservancy 2021).
We did not find evidence that heat content was tailored to regional differences. Rather, plan type explained differences in plan content, meaning that which plans are included among a city's 'network of plans' will have implications for which aspects of heat are governed (Berke et al 2019). For instance, all cities have Hazard plans, which were more likely to include an EHE framing, but far fewer cities had resilience plans, which are more likely to include a disparity framing. Indeed, the EHE framing was more prevalent than disparity in our analysis. Our finding linking resilience plans to the inclusion of disparity framings aligns with a recent study that found that resilience plans are more likely to include equity and social justice goals (Lambrou and Loukaitou-Sideris 2021). Yet, recent studies also find that inclusion of equity is typically not robustly interated into plans (Angelo et al 2022, Lambrou and Loukaitou-Sideris 2022). Future qualitative analysis should investigate the robustness of plan content, which we are unable to assess in our quantitative analysis.
A recent study examined city characteristics that influenced planning professional's concern about heat and assessment of the number of plans and heat strategies implemented in their city (Meerow and Keith 2021). Although both studies found mostly weak relationships, and the nature of the analysis (number of plans versus plan content) are different, a few patterns emerge. For instance, both studies found that support that general municipal resources matter: city capacity related to number of heat plans in their study and, as rough proxies for city capacity used in climate adaptation plan analysis, population and, to a lesser extent, spending per capita did predict plan content in our study (Shi et al 2015, Angelou 2022). Both heat planning studies found a relationship between historic experience of heat and inclusion of heat content in plans; although, this relationship was limited to thermal comfort and UHI framings in our study. Both studies found relationships with projected heat: late century projections predicted disparity framing in our study, and projected heat predicted concern and number of heat strategies in theirs. Their study found that access to heat information predicted concern and number of heat plans and strategies. Our results do not show a relationship between inclusion of data and heat plan content, but inclusion of data was rare and may not be synonymous with use of data. Unlike Meerow and Keith (2021) we found that network membership was predictive, although mostly of inclusion of a disparity framing. Both studies found only modest relationships between heat vulnerable populations and plan content and neither study found a relationship between politics and heat planning.
Future research should examine changes since 2020, strategies such as indoor cooling, and emergent strategies such as heatwave naming, ranking, or insurance. Addressing relationships between indoor and outdoor heat exposure and homeless and mobile home residents, is also needed (Kidd et al 2021, Phillips et al 2021). Expanding the study to other countries and multiple scales of governance is needed and qualitative analysis to contextualize findings.
5. Conclusions
Heat and its many consequences for urban life are a paramount concern for cities, but concrete actions in plans appear to lag behind the severity and complexity of the problem. We examined plan content as one high-level indicator of municipal intentions to govern heat and found evidence that acute and chronic aspects of the problem are not well integrated and that there are gaps in heat problem framing, especially pertaining to disparity and thermal comfort, which have downstream implications for the uneven lived experience of heat. While our analysis did not examine the full range of formal and informal institutional responses to heat, the results do contain broad insights as action on heat increases. A need exists for greater integration across sectors impacted by heat and more robust and tailored consideration of how cities can intervene to address it.
Acknowledgments
This study was funded by the Luskin Center for Innovation and Graduate Division at the University of California Los Angeles and publication of the database was funded by the Natural Hazards Research Center at the University of Colorado, Boulder.
Data availability statement
The data that support the findings of this study are available through the NSF's Natural Hazards Engineering Research Infrastructure DesignSafe Data Depot.
The data that support the findings of this study are openly available at the following URL/DOI: https://doi.org/10.17603/ds2-xc9j-3054.
Appendix A.: City and environmental network membership data (French et al 2018)
.
| City data | Environmental network memberships | ||||||
|---|---|---|---|---|---|---|---|
| City | Population 2019 | Climate region | USDN | Rockefeller 100 | Climate majors | C40 | NLC |
| Albuquerque | 559 374 | Southwest | Yes | No | Yes | No | No |
| Arlington | 395 477 | Southeast | No | No | No | No | Yes |
| Atlanta | 488 800 | Southeast | Yes | Yes | Yes | No | Yes |
| Austin | 950 807 | Great Plains | Yes | No | Yes | Yes | Yes |
| Baltimore | 609 302 | Northeast | Yes | No | Yes | No | Yes |
| Boston | 684 379 | Northeast | Yes | Yes | Yes | Yes | Yes |
| Charlotte | 857 425 | Southeast | Yes | No | Yes | No | Yes |
| Chicago | 2709 534 | Midwest | Yes | Yes | Yes | Yes | Yes |
| Colorado Springs | 464 871 | Southwest | No | No | No | No | Yes |
| Columbus | 878 553 | Midwest | Yes | No | Yes | No | Yes |
| Dallas | 1330 612 | Great Plains | Yes | Yes | Yes | No | Yes |
| Denver | 705 576 | Southwest | Yes | No | Yes | No | Yes |
| Detroit | 674 841 | Midwest | Yes | No | Yes | No | Yes |
| El Paso | 679 813 | Southeast | Yes | Yes | No | No | Yes |
| Fort Worth | 874 401 | Great Plains | No | No | No | No | Yes |
| Fresno | 525 010 | Southwest | Yes | No | No | No | Yes |
| Houston | 2310 432 | Great Plains | Yes | Yes | Yes | Yes | Yes |
| Indianapolis | 864 447 | Midwest | Yes | No | Yes | No | Yes |
| Jacksonville | 890 467 | Southeast | No | No | No | No | Yes |
| Kansas City | 486 404 | Great Plains | Yes | No | Yes | No | Yes |
| Las Vegas | 634 773 | Southwest | No | No | Yes | No | Yes |
| Long Beach | 466 776 | Southwest | No | No | Yes | No | Yes |
| Los Angeles | 3966 936 | Southwest | Yes | Yes | Yes | Yes | Yes |
| Louisville | 617 790 | Southeast | Yes | Yes | Yes | No | Yes |
| Memphis | 651 932 | Southeast | Yes | No | Yes | No | Yes |
| Mesa | 499 720 | Southwest | No | No | No | No | Yes |
| Miami | 454 279 | Southeast | Yes | Yes | Yes | Yes | Yes |
| Milwaukee | 594 548 | Midwest | Yes | No | Yes | No | Yes |
| Minneapolis | 420 324 | Midwest | Yes | Yes | Yes | No | Yes |
| Nashville | 663 750 | Southeast | Yes | Yes | Yes | No | Yes |
| New Orleans | 390 845 | Southeast | Yes | Yes | Yes | Yes | Yes |
| New York | 8419 316 | Northeast | Yes | Yes | Yes | Yes | Yes |
| Oakland | 425 097 | Southwest | Yes | Yes | Yes | No | Yes |
| Oklahoma City | 643 692 | Great Plains | No | No | No | No | Yes |
| Omaha | 475 862 | Great Plains | No | No | No | No | Yes |
| Philadelphia | 1579 075 | Northeast | Yes | No | Yes | Yes | Yes |
| Phoenix | 1633 017 | Southwest | Yes | No | Yes | Yes | Yes |
| Portland | 645 291 | Northwest | Yes | No | Yes | Yes | Yes |
| Raleigh | 464 485 | Southeast | Yes | No | Yes | No | Yes |
| Sacramento | 500 930 | Southwest | Yes | No | No | Yes | No |
| San Antonio | 1508 083 | Great Plains | Yes | No | Yes | No | Yes |
| San Diego | 1409 573 | Southwest | Yes | No | Yes | No | Yes |
| San Francisco | 874 961 | Southwest | Yes | Yes | Yes | Yes | Yes |
| San Jose | 1000 280 | Southwest | Yes | No | Yes | No | Yes |
| Seattle | 724 305 | Northwest | Yes | Yes | Yes | Yes | Yes |
| Tampa | 387 916 | Southeast | No | No | Yes | No | Yes |
| Tucson | 541 482 | Southwest | Yes | No | Yes | No | Yes |
| Tulsa | 402 324 | Great Plains | No | Yes | No | No | Yes |
| Virginia Beach | 450 201 | Southeast | No | No | Yes | No | Yes |
| Washington D.C. | 692 683 | Northeast | Yes | Yes | Yes | Yes | Yes |
Appendix B.: List of 50 variables published in the original data set (Turner et al 2021). The following terms were used to search for heat-specific statements: heat, hot, cool, thermal, and temperature
Problem framing
- General heat. Statement frames the problem as heat in general.
- Thermal comfort. Statement frames the problem around human thermal comfort.
- Urban heat island. Statement frames the problem the UHI effect or elaborates on the temperature differential between the city and rural areas.
- Extreme heat event. Statement frames the problem around EHEs or other cognates such as heat waves or high/extreme heat days.
- Energy. Statement frames the problem around the impacts of heat on energy production or consumption.
- Health. Statement frames the problem around the impacts of heat on human health and public safety.
- Economy. Statement frames the problem around the impacts of heat on economic activities, including labor, costs of production, etc.
- Infrastructure. Statement frames the problem around the impacts of heat on hard infrastructure systems such as roads, buildings, air conditioning units, etc.
- Transportation. Statement frames the problem around the impacts of heat on f transportation systems (e.g. traffic, buckling roads, reduced air travel, etc).
- Ecology. Statement frames the problem around the impacts of heat on the natural environment. This code also includes references to greenhouse gas and other emissions, storms, precipitation, drought, wildfires, biodiversity, etc.
- Water. Statement frames the problem around the impacts of heat on the quantity or quality of water.
- Air quality. Statement frames the problem around the impacts of heat on air quality.
- General vulnerability. Statement frames the problem around the impacts of heat social vulnerability in general.
- Exposure. Statement frames the problem around the impacts of heat in terms of exposure (i.e. it refers to geographical vulnerability associated with certain places and location).
- Sensitivity. Statement frames the problem around the impacts of heat on demographically-sensitive groups such as elderly people or people with chronic health issues.
- Adaptive capacity/resilience. Statement frames the problem around the impacts of heat in terms of individual or systemic coping mechanisms (e.g. people's ability to access cool spaces or to access healthcare services if necessary during a heat wave).
- Equity. Statement frames the problem around the impacts of heat in terms of social equity (i.e. it refers to the uneven distribution of impacts of heat within a population). Cognates often found in these statements include: disparate, uneven, unfair, unequal, unjust, etc.
Hard intervention. A hard intervention refers to the addition, subtraction, or alteration of vegetative or built materials that change the composition and/or configuration of urban morphology.
- Permeable pavement. Statement mentions permeable pavement.
- Green roof. Statement mentions green roofs.
- Reflective roof. Statement mentions reflective roofs.
-
Reflective pavement. Statement mentions reflective pavement.
- Reflective pavement miles. Statement mentions a specific amount of reflective pavement.
-
Tree/canopy. Statement mentions trees or tree canopy.
- Tree number. Statement mentions a specific number of trees.
-
Vegetation. Statement mentions vegetation.
- Vegetation amount. Statement mentions a specific amount of vegetation.
- Green wall. Statement mentions green walls.
- Reflective walls. Statement mentions reflective walls.
- Water features. Statement mentions water features (e.g. fountains, ponds, streams, misters).
- Shaded areas. Statement mentions shaded areas or structures.
- Comprehensive approaches. Statement mentions comprehensive approaches such as complete streets or green infrastructure.
- Other hard. This code is reserved for hard interventions that do not align with the aforementioned action items.
Soft intervention. A soft intervention refers to a programmatic or other action aimed at addressing the cause and/or impacts of heat.
- Policy. Statement mentions city policies or codes.
- Install. Statement mentions a municipal or other initiative to install physical infrastructure or design standards to manage heat.
- Study/monitor. Statement mentions efforts to study or monitor heat, heat impacts, or heat management strategies.
- Educate/outreach. Statement mentions efforts to educate the public about heat and heat management tation strategies.
- Partnerships. Statement mentions partnerships with corporations, community organizations, academia, etc.
- Warn. Statement mentions warning systems such as text alert systems, extreme heat notices, etc.
- Plan. Statement mentions planning efforts related to heat. This code also includes emergency services and management.
- Programs. Statement mentions temporary or ongoing initiatives (e.g. cooling centers, buddy heat programs, transport to cooling centers).
- Incentives. Statement mentions reward-based programs such as monetary and non-monetary incentives for businesses/citizens to practice heat-friendly design and behavior.
-
Funding. Statement mentions funding for heat-related interventions.
- Funding amount. Statement mentions a specified dollar amount.
- Ownership. Statement mentions ownership of infrastructure related to heat management.
- Other. This code is reserved for soft interventions that do not align with the aforementioned action items.
Other variables
- Maps. Statement includes a map.
- Figures. Statement includes a figure.
- Pictures. Statement includes a picture.
- Data sources. Statement mentions a specific data source (e.g. NOAA).
- Temperature. Statement mentions temperature as a metric for studying or managing heat.
Appendix C.: Kendall correlation matrix for all primary coded variables in the data set
.
| General-heat | Thermal comfort | Urban heat island | Extreme heat event | Equity | Energy | Health | Economy | Infrastructure | Transportation | Ecology | Water | Air quality | General-Vulnerability | Exposure | Sensitivity | Adaptive capacity/resilience | Green roof | Reflective roof | Reflective pavement | Tree/canopy | Vegetation | Shaded areas | Comprehensive approaches | Other-hard | Policy | Install | Study/monitor | Educate/outreach | Partnerships | Warn | Plan | Programs | Incentives | Funding | |
|---|---|---|---|---|---|---|---|---|---|---|---|---|---|---|---|---|---|---|---|---|---|---|---|---|---|---|---|---|---|---|---|---|---|---|---|
| General-heat | 1.000 | ||||||||||||||||||||||||||||||||||
| Thermal comfort | 0.193 | 1.000 | |||||||||||||||||||||||||||||||||
| Urban heat island | 0.407 | 0.313 | 1.000 | ||||||||||||||||||||||||||||||||
| Extreme heat event | 0.626 | 0.149 | 0.330 | 1.000 | |||||||||||||||||||||||||||||||
| Equity | 0.234 | −0.002 | 0.262 | 0.261 | 1.000 | ||||||||||||||||||||||||||||||
| Energy | 0.554 | 0.104 | 0.415 | 0.811 | 0.115 | 1.000 | |||||||||||||||||||||||||||||
| Health | 0.677 | 0.145 | 0.424 | 0.686 | 0.422 | 0.558 | 1.000 | ||||||||||||||||||||||||||||
| Economy | 0.414 | 0.063 | 0.159 | 0.372 | 0.035 | 0.385 | 0.695 | 1.000 | |||||||||||||||||||||||||||
| Infrastructure | 0.582 | 0.048 | 0.245 | 0.822 | 0.083 | 0.818 | 0.539 | 0.370 | 1.000 | ||||||||||||||||||||||||||
| Transportation | 0.476 | 0.167 | 0.258 | 0.477 | 0.022 | 0.483 | 0.449 | 0.386 | 0.587 | 1.000 | |||||||||||||||||||||||||
| Ecology | 0.612 | 0.315 | 0.352 | 0.572 | 0.215 | 0.439 | 0.760 | 0.624 | 0.443 | 0.440 | 1.000 | ||||||||||||||||||||||||
| Water | 0.501 | 0.077 | 0.379 | 0.568 | 0.185 | 0.532 | 0.589 | 0.439 | 0.434 | 0.365 | 0.532 | 1.000 | |||||||||||||||||||||||
| Air quality | 0.338 | 0.150 | 0.523 | 0.416 | 0.183 | 0.398 | 0.425 | 0.350 | 0.220 | 0.193 | 0.419 | 0.603 | 1.000 | ||||||||||||||||||||||
| Gen vulnerability | 0.441 | 0.090 | 0.360 | 0.628 | 0.513 | 0.438 | 0.591 | 0.289 | 0.482 | 0.359 | 0.365 | 0.318 | 0.340 | 1.000 | |||||||||||||||||||||
| Exposure | 0.426 | 0.078 | 0.335 | 0.455 | 0.336 | 0.308 | 0.603 | 0.419 | 0.342 | 0.269 | 0.442 | 0.295 | 0.418 | 0.660 | 1.000 | ||||||||||||||||||||
| Sensitivity | 0.406 | 0.127 | 0.375 | 0.565 | 0.446 | 0.344 | 0.683 | 0.528 | 0.426 | 0.326 | 0.501 | 0.347 | 0.449 | 0.696 | 0.680 | 1.000 | |||||||||||||||||||
| Adaptive capacity | 0.390 | 0.044 | 0.255 | 0.442 | 0.631 | 0.237 | 0.468 | 0.083 | 0.244 | 0.139 | 0.260 | 0.364 | 0.330 | 0.522 | 0.391 | 0.436 | 1.000 | ||||||||||||||||||
| Green roof | 0.233 | 0.018 | 0.502 | 0.139 | 0.087 | 0.360 | 0.233 | 0.142 | 0.169 | 0.284 | 0.212 | 0.066 | 0.213 | 0.156 | 0.172 | 0.092 | 0.079 | 1.000 | |||||||||||||||||
| Reflective roof | 0.311 | 0.132 | 0.543 | 0.177 | 0.169 | 0.343 | 0.273 | 0.057 | 0.175 | 0.276 | 0.180 | 0.024 | 0.183 | 0.198 | 0.219 | 0.153 | 0.174 | 0.732 | 1.000 | ||||||||||||||||
| Reflective pavement | 0.221 | 0.065 | 0.327 | 0.127 | 0.153 | 0.061 | 0.109 | −0.014 | 0.011 | 0.020 | 0.124 | 0.086 | 0.193 | 0.181 | 0.218 | 0.076 | 0.184 | 0.157 | 0.362 | 1.000 | |||||||||||||||
| Tree/canopy | 0.321 | 0.173 | 0.711 | 0.116 | 0.318 | 0.273 | 0.212 | 0.061 | 0.076 | 0.207 | 0.186 | 0.099 | 0.326 | 0.234 | 0.221 | 0.231 | 0.177 | 0.524 | 0.487 | 0.261 | 1.000 | ||||||||||||||
| Vegetation | 0.165 | 0.226 | 0.422 | 0.058 | 0.263 | 0.124 | 0.091 | −0.010 | 0.045 | 0.018 | 0.205 | 0.095 | 0.352 | 0.228 | 0.189 | 0.118 | 0.241 | 0.200 | 0.162 | 0.223 | 0.467 | 1.000 | |||||||||||||
| Shaded areas | 0.099 | 0.316 | 0.241 | 0.052 | −0.021 | 0.063 | 0.013 | 0.004 | 0.000 | 0.144 | 0.145 | 0.056 | 0.138 | 0.016 | 0.037 | −0.031 | −0.015 | 0.186 | 0.150 | 0.298 | 0.333 | 0.374 | 1.000 | ||||||||||||
| Comprehensive | 0.254 | 0.049 | 0.443 | 0.220 | 0.402 | 0.230 | 0.200 | 0.044 | 0.177 | 0.100 | 0.096 | 0.113 | 0.063 | 0.302 | 0.134 | 0.161 | 0.347 | 0.136 | 0.192 | 0.280 | 0.353 | 0.208 | 0.113 | 1.000 | |||||||||||
| Other-hard | 0.091 | 0.150 | 0.138 | 0.099 | 0.018 | 0.061 | 0.247 | 0.226 | 0.077 | 0.085 | 0.189 | 0.089 | 0.099 | 0.072 | 0.050 | 0.146 | 0.029 | 0.043 | 0.008 | −0.036 | 0.119 | 0.156 | 0.154 | −0.033 | 1.000 | ||||||||||
| Policy | 0.241 | 0.053 | 0.481 | 0.167 | 0.153 | 0.205 | 0.242 | 0.062 | 0.174 | 0.196 | 0.253 | 0.146 | 0.183 | 0.166 | 0.132 | 0.151 | 0.087 | 0.514 | 0.479 | 0.217 | 0.473 | 0.232 | 0.279 | 0.179 | 0.162 | 1.000 | |||||||||
| Install | 0.281 | 0.048 | 0.095 | 0.255 | 0.090 | 0.183 | 0.405 | 0.385 | 0.118 | 0.036 | 0.213 | 0.166 | 0.247 | 0.306 | 0.492 | 0.347 | 0.150 | 0.094 | 0.078 | −0.013 | 0.041 | 0.013 | 0.057 | 0.043 | 0.048 | 0.038 | 1.000 | ||||||||
| Study/monitor | 0.400 | 0.103 | 0.290 | 0.443 | 0.206 | 0.388 | 0.391 | 0.352 | 0.457 | 0.383 | 0.324 | 0.274 | 0.368 | 0.618 | 0.491 | 0.516 | 0.278 | 0.208 | 0.209 | 0.192 | 0.249 | 0.268 | 0.138 | 0.180 | 0.072 | 0.400 | 0.158 | 1.000 | |||||||
| Educate/outreach | 0.612 | 0.118 | 0.255 | 0.414 | 0.330 | 0.221 | 0.591 | 0.426 | 0.262 | 0.196 | 0.407 | 0.330 | 0.311 | 0.534 | 0.480 | 0.479 | 0.512 | 0.146 | 0.235 | 0.252 | 0.105 | 0.153 | 0.069 | 0.180 | 0.044 | 0.144 | 0.454 | 0.416 | 1.000 | ||||||
| Partnerships | 0.537 | −0.063 | 0.406 | 0.518 | 0.280 | 0.494 | 0.420 | 0.273 | 0.445 | 0.301 | 0.389 | 0.317 | 0.233 | 0.403 | 0.286 | 0.280 | 0.306 | 0.352 | 0.351 | 0.333 | 0.364 | 0.213 | 0.218 | 0.419 | 0.081 | 0.407 | 0.178 | 0.458 | 0.529 | 1.000 | |||||
| Warn | 0.511 | 0.068 | 0.166 | 0.371 | 0.084 | 0.185 | 0.547 | 0.407 | 0.248 | 0.227 | 0.355 | 0.254 | 0.201 | 0.297 | 0.268 | 0.383 | 0.257 | 0.003 | 0.105 | −0.085 | −0.017 | −0.003 | 0.011 | −0.054 | 0.062 | 0.071 | 0.447 | 0.292 | 0.687 | 0.345 | 1.000 | ||||
| Plan | 0.482 | 0.124 | 0.299 | 0.644 | 0.363 | 0.476 | 0.685 | 0.563 | 0.536 | 0.375 | 0.556 | 0.441 | 0.454 | 0.669 | 0.528 | 0.672 | 0.556 | 0.204 | 0.172 | 0.181 | 0.179 | 0.216 | 0.133 | 0.203 | 0.123 | 0.245 | 0.331 | 0.605 | 0.519 | 0.450 | 0.391 | 1.000 | |||
| Programs | 0.611 | 0.088 | 0.341 | 0.508 | 0.281 | 0.352 | 0.577 | 0.393 | 0.390 | 0.373 | 0.416 | 0.373 | 0.336 | 0.544 | 0.489 | 0.520 | 0.461 | 0.288 | 0.379 | 0.299 | 0.219 | 0.066 | 0.094 | 0.225 | −0.012 | 0.317 | 0.295 | 0.544 | 0.762 | 0.602 | 0.533 | 0.624 | 1.000 | ||
| Incentives | 0.262 | 0.108 | 0.423 | 0.108 | 0.017 | 0.308 | 0.144 | 0.059 | 0.229 | 0.346 | 0.079 | −0.002 | 0.061 | 0.073 | 0.085 | 0.079 | 0.024 | 0.648 | 0.768 | 0.090 | 0.405 | 0.060 | 0.014 | 0.081 | −0.032 | 0.313 | −0.068 | 0.129 | 0.070 | 0.237 | 0.067 | 0.055 | 0.216 | 1.000 | |
| Funding | 0.489 | 0.072 | 0.140 | 0.464 | 0.296 | 0.372 | 0.597 | 0.457 | 0.436 | 0.357 | 0.417 | 0.357 | 0.174 | 0.261 | 0.429 | 0.337 | 0.323 | 0.081 | 0.166 | 0.175 | 0.149 | 0.047 | 0.052 | 0.113 | 0.261 | 0.068 | 0.341 | 0.129 | 0.323 | 0.270 | 0.248 | 0.434 | 0.308 | 0.067 | 1.000 |
Appendix D.: Total/percent content and KW test for plan type
.
| Hazard (n = 44) | General (n = 43) | Climate (n = 32) | Sustainability (n = 20) | Resilience (n = 20) | ||||||||||||||||
| Framing | n | % | Dir. | Sig. | n | % | Dir. | Sig. | n | % | Dir. | Sig. | n | % | Dir. | Sig. | n | % | Dir. | Sig. |
| General heat | 40 | 91% | + | *** | 27 | 63% | + | ** | 19 | 59% | Na | Na | 13 | 65% | Na | Na | 15 | 75% | Na | Na |
| Thermal comfort | 12 | 27% | + | * | 5 | 12% | Na | Na | 7 | 22% | Na | Na | 2 | 10% | Na | Na | 1 | 5% | Na | Na |
| Urban heat island | 24 | 55% | + | * | 32 | 74% | Na | Na | 26 | 81% | Na | Na | 11 | 55% | Na | Na | 15 | 75% | Na | Na |
| Extreme heat event | 36 | 82% | + | *** | 17 | 40% | (−) | *** | 26 | 81% | + | ** | 8 | 40% | Na | Na | 15 | 75% | Na | Na |
| Equity | 11 | 25% | Na | Na | 6 | 14% | (−) | ** | 15 | 47% | + | ** | 5 | 25% | Na | Na | 9 | 45% | + | * |
| Energy | 29 | 66% | Na | Na | 20 | 47% | Na | Na | 21 | 66% | + | * | 7 | 35% | Na | Na | 12 | 60% | Na | Na |
| Health | 37 | 84% | + | *** | 15 | 35% | (−) | *** | 21 | 66% | Na | Na | 9 | 45% | Na | Na | 15 | 75% | Na | Na |
| Economy | 25 | 57% | + | *** | 8 | 19% | Na | Na | 8 | 25% | Na | Na | 1 | 5% | (−) | ** | 7 | 35% | Na | Na |
| Infrastructure | 26 | 59% | + | *** | 6 | 14% | (−) | ** | 12 | 38% | Na | Na | 5 | 25% | Na | Na | 13 | 65% | + | ** |
| Transportation | 11 | 25% | + | * | 6 | 14% | Na | Na | 5 | 16% | Na | Na | 0 | 0% | (−) | * | 5 | 25% | Na | Na |
| Ecology | 35 | 80% | + | *** | 21 | 49% | Na | Na | 20 | 63% | Na | Na | 6 | 30% | (−) | ** | 10 | 50% | Na | Na |
| Water | 23 | 52% | + | ** | 12 | 28% | Na | Na | 12 | 38% | Na | Na | 3 | 15% | − | * | 9 | 45% | Na | Na |
| Air quality | 17 | 39% | Na | Na | 17 | 40% | Na | Na | 14 | 44% | Na | Na | 6 | 30% | Na | Na | 9 | 45% | Na | Na |
| General-vulnerability | 22 | 50% | Na | Na | 6 | 14% | (−) | ** | 17 | 53% | + | * | 6 | 30% | Na | Na | 14 | 70% | + | ** |
| Exposure | 20 | 45% | Na | Na | 2 | 5% | (−) | *** | 13 | 41% | + | * | 5 | 25% | Na | Na | 7 | 35% | Na | Na |
| Sensitivity | 31 | 70% | Na | Na | 5 | 12% | (−) | *** | 13 | 41% | Na | Na | 5 | 25% | Na | Na | 10 | 50% | Na | Na |
| Adaptive capacity | 17 | 39% | + | * | 4 | 9% | (−) | ** | 11 | 34% | Na | Na | 3 | 15% | Na | Na | 9 | 45% | + | * |
| Hazard (n = 44) | General (n = 43) | Climate (n = 32) | Sustainability (n = 20) | Resilience (n = 20) | ||||||||||||||||
| Hard interventions | n | % | Dir. | Sig. | n | % | Dir. | Sig. | n | % | Dir. | Sig. | n | % | Dir. | Sig. | n | % | Dir. | Sig. |
| Green roof | 6 | 14% | + | ** | 11 | 26% | Na | Na | 11 | 34% | Na | Na | 9 | 45% | Na | Na | 7 | 35% | Na | Na |
| Reflective roof | 9 | 20% | + | * | 11 | 26% | Na | Na | 15 | 47% | + | *** | 9 | 45% | Na | Na | 8 | 40% | Na | Na |
| Reflective pavement | 2 | 5% | Na | Na | 4 | 9% | Na | Na | 8 | 25% | + | *** | 2 | 10% | Na | Na | 4 | 20% | Na | Na |
| Tree/canopy | 10 | 23% | (−) | *** | 32 | 74% | + | ** | 21 | 66% | Na | Na | 12 | 60% | Na | Na | 12 | 60% | Na | Na |
| Vegetation | 3 | 7% | (−) | *** | 20 | 47% | + | *** | 10 | 31% | Na | Na | 4 | 20% | Na | Na | 5 | 25% | Na | Na |
| Shaded areas | 4 | 9% | (−) | ** | 15 | 35% | + | ** | 8 | 25% | Na | Na | 2 | 10% | Na | Na | 3 | 15% | Na | Na |
| Comprehensive | 4 | 9% | (−) | *** | 15 | 35% | Na | Na | 12 | 38% | Na | Na | 4 | 20% | Na | Na | 11 | 55% | + | ** |
| Other-hard | 5 | 11% | Na | Na | 7 | 16% | Na | Na | 3 | 9% | Na | Na | 5 | 25% | Na | Na | 1 | 5% | Na | Na |
| Soft interventions | n | % | Dir. | Sig. | n | % | Dir. | Sig. | n | % | Dir. | Sig. | n | % | Dir. | Sig. | n | % | Dir. | Sig. |
| Policy | 9 | 20% | Na | Na | 13 | 30% | Na | Na | 12 | 38% | Na | Na | 6 | 30% | Na | Na | 8 | 40% | Na | Na |
| Install | 7 | 16% | Na | Na | 1 | 2% | Na | Na | 5 | 16% | Na | Na | 2 | 10% | Na | Na | 1 | 5% | Na | Na |
| Study/monitor | 11 | 25% | Na | Na | 6 | 14% | (−) | ** | 13 | 41% | Na | Na | 7 | 35% | Na | Na | 11 | 55% | Na | Na |
| Educate/outreach | 30 | 68% | + | ** | 8 | 19% | (−) | *** | 10 | 31% | Na | Na | 6 | 30% | Na | Na | 11 | 55% | Na | Na |
| Partnerships | 9 | 20% | Na | Na | 7 | 16% | Na | Na | 12 | 38% | + | * | 7 | 35% | Na | Na | 8 | 40% | + | * |
| Warn | 20 | 45% | + | * | 4 | 9% | Na | Na | 5 | 16% | Na | Na | 1 | 5% | Na | Na | 3 | 15% | Na | Na |
| Plan | 23 | 52% | Na | Na | 14 | 33% | + | * | 17 | 53% | + | * | 5 | 25% | Na | Na | 10 | 50% | Na | Na |
| Programs | 29 | 66% | + | *** | 12 | 28% | + | ** | 14 | 44% | Na | Na | 8 | 40% | Na | Na | 11 | 55% | Na | Na |
| Incentives | 2 | 5% | Na | Na | 1 | 2% | Na | Na | 5 | 16% | Na | Na | 2 | 10% | Na | Na | 6 | 30% | + | *** |
| Funding | 11 | 25% | Na | Na | 4 | 9% | Na | Na | 8 | 25% | Na | Na | 1 | 5% | Na | Na | 5 | 25% | Na | Na |
| Data sourcs | 31 | 70% | + | *** | 5 | 12% | − | *** | 9 | 28% | Na | Na | 3 | 15% | Na | Na | 6 | 30% | Na | Na |
*p<0.05, ** p<0.01*** p<0.001.
Appendix E.: Total/percent content and KW test for region
.
| Midwest (n = 27) | Northeast (n = 22) | Great Plains (n = 34) | Northwest (n = 10) | Southeast (n = 34) | Southwest (n = 49) | |||||||||||||||||||
| Framing | n | % | Dir. | Sig. | n | % | Dir. | Sig. | n | % | Dir. | Sig. | n | % | Dir. | Sig. | n | % | Dir. | Sig. | n | % | Dir. | Sig. |
| General-heat | 17 | 63% | Na | Na | 15 | 68% | Na | Na | 28 | 82% | Na | Na | 5 | 50% | Na | Na | 23 | 68% | Na | Na | 33 | 67% | Na | Na |
| Thermal comfort | 3 | 11% | Na | Na | 2 | 9% | Na | Na | 8 | 24% | Na | Na | 1 | 10% | Na | Na | 4 | 12% | Na | Na | 11 | 22% | Na | Na |
| Urban heat island | 19 | 70% | Na | Na | 15 | 68% | Na | Na | 24 | 71% | (−) | * | 5 | 50% | Na | Na | 23 | 68% | + | * | 30 | 61% | Na | Na |
| Extreme heat event | 16 | 59% | Na | Na | 14 | 64% | Na | Na | 20 | 59% | Na | Na | 6 | 60% | Na | Na | 16 | 47% | Na | Na | 29 | 59% | Na | Na |
| Equity | 9 | 33% | Na | Na | 7 | 32% | Na | Na | 9 | 26% | Na | Na | 3 | 30% | Na | Na | 5 | 15% | Na | Na | 14 | 29% | + | * |
| Energy | 14 | 52% | Na | Na | 13 | 59% | Na | Na | 21 | 62% | Na | Na | 3 | 30% | Na | Na | 17 | 50% | Na | Na | 23 | 47% | Na | Na |
| Health | 17 | 63% | Na | Na | 13 | 59% | Na | Na | 19 | 56% | Na | Na | 6 | 60% | Na | Na | 17 | 50% | Na | Na | 28 | 57% | Na | Na |
| Economy | 8 | 30% | Na | Na | 8 | 36% | Na | Na | 15 | 44% | Na | Na | 2 | 20% | Na | Na | 6 | 18% | Na | Na | 11 | 22% | Na | Na |
| Infrastructure | 15 | 56% | Na | Na | 9 | 41% | Na | Na | 15 | 44% | + | * | 2 | 20% | Na | Na | 9 | 26% | Na | Na | 12 | 24% | Na | Na |
| Transportation | 4 | 15% | Na | Na | 7 | 32% | Na | Na | 9 | 26% | Na | Na | 0 | 0% | Na | Na | 2 | 6% | Na | Na | 5 | 10% | Na | Na |
| Ecology | 14 | 52% | Na | Na | 14 | 64% | Na | Na | 19 | 56% | Na | Na | 5 | 50% | Na | Na | 11 | 32% | Na | Na | 32 | 65% | Na | Na |
| Water | 9 | 33% | Na | Na | 7 | 32% | Na | Na | 8 | 24% | Na | Na | 5 | 50% | Na | Na | 5 | 15% | Na | Na | 19 | 39% | Na | Na |
| Air quality | 12 | 44% | Na | Na | 10 | 45% | Na | Na | 16 | 47% | Na | Na | 3 | 30% | Na | Na | 8 | 24% | Na | Na | 15 | 31% | Na | Na |
| General-vulnerability | 15 | 56% | Na | Na | 14 | 64% | Na | Na | 11 | 32% | Na | Na | 2 | 20% | Na | Na | 7 | 21% | Na | Na | 17 | 35% | Na | Na |
| Exposure | 6 | 22% | Na | Na | 10 | 45% | Na | Na | 12 | 35% | Na | Na | 2 | 20% | Na | Na | 4 | 12% | Na | Na | 13 | 27% | Na | Na |
| Sensitivity | 12 | 44% | Na | Na | 11 | 50% | Na | Na | 15 | 44% | Na | Na | 3 | 30% | Na | Na | 8 | 24% | Na | Na | 15 | 31% | Na | Na |
| Adaptive capacity | 6 | 22% | Na | Na | 9 | 41% | Na | Na | 11 | 32% | Na | Na | 2 | 20% | Na | Na | 3 | 9% | Na | Na | 13 | 27% | Na | Na |
| Midwest (n = 27) | Northeast (n = 22) | Great Plains (n = 34) | Northwest (n = 10) | Southeast (n = 34) | Southwest (n = 49) | |||||||||||||||||||
| Hard interventions | n | % | Dir. | Sig. | n | % | Dir. | Sig. | n | % | Dir. | Sig. | n | % | Dir. | Sig. | n | % | Dir. | Sig. | ||||
| Green roof | 6 | 22% | Na | Na | 6 | 27% | Na | Na | 13 | 38% | Na | Na | 1 | 10% | Na | Na | 8 | 24% | Na | Na | 11 | 22% | Na | Na |
| Reflective roof | 5 | 19% | Na | Na | 11 | 50% | Na | Na | 9 | 26% | Na | Na | 0 | 0% | Na | Na | 11 | 32% | Na | Na | 16 | 33% | Na | Na |
| Reflective pavement | 2 | 7% | + | * | 0 | 0% | Na | Na | 5 | 15% | Na | Na | 0 | 0% | Na | Na | 0 | 0% | Na | Na | 7 | 14% | Na | Na |
| Tree/canopy | 14 | 52% | Na | Na | 13 | 59% | Na | Na | 18 | 53% | Na | Na | 3 | 30% | Na | Na | 22 | 65% | Na | Na | 22 | 45% | Na | Na |
| Vegetation | 9 | 33% | Na | Na | 8 | 36% | Na | Na | 9 | 26% | Na | Na | 2 | 20% | Na | Na | 5 | 15% | Na | Na | 10 | 20% | Na | Na |
| Shaded areas | 5 | 19% | Na | Na | 3 | 14% | Na | Na | 6 | 18% | Na | Na | 0 | 0% | Na | Na | 6 | 18% | Na | Na | 16 | 33% | Na | Na |
| Comprehensive | 7 | 26% | Na | Na | 8 | 36% | Na | Na | 12 | 35% | (−) | * | 2 | 20% | Na | Na | 8 | 24% | Na | Na | 13 | 27% | Na | Na |
| Other-hard | 4 | 15% | Na | Na | 2 | 9% | Na | Na | 6 | 18% | Na | Na | 0 | 0% | Na | Na | 5 | 15% | Na | Na | 4 | 8% | Na | Na |
| Policy | 3 | 11% | Na | Na | 6 | 27% | Na | Na | 12 | 35% | Na | Na | 3 | 30% | Na | Na | 10 | 29% | Na | Na | 16 | 33% | Na | Na |
| Soft interventions | n | % | Dir. | Sig. | n | % | Dir. | Sig. | n | % | Dir. | Sig. | n | % | Dir. | Sig. | n | % | Dir. | Sig. | ||||
| Install | 2 | 7% | Na | Na | 3 | 14% | Na | Na | 6 | 18% | Na | Na | 0 | 0% | Na | Na | 0 | 0% | Na | Na | 5 | 10% | Na | Na |
| Study/monitor | 9 | 33% | Na | Na | 17 | 77% | Na | Na | 12 | 35% | Na | Na | 2 | 20% | Na | Na | 5 | 15% | Na | Na | 10 | 20% | Na | Na |
| Educate/outreach | 11 | 41% | Na | Na | 11 | 50% | Na | Na | 13 | 38% | + | * | 2 | 20% | Na | Na | 8 | 24% | Na | Na | 20 | 41% | + | * |
| Partnerships | 5 | 19% | Na | Na | 11 | 50% | Na | Na | 10 | 29% | Na | Na | 2 | 20% | Na | Na | 4 | 12% | Na | Na | 11 | 22% | Na | Na |
| Warn | 5 | 19% | Na | Na | 7 | 32% | Na | Na | 7 | 21% | Na | Na | 1 | 10% | Na | Na | 6 | 18% | Na | Na | 8 | 16% | Na | Na |
| Plan | 10 | 37% | Na | Na | 12 | 55% | Na | Na | 19 | 56% | Na | Na | 3 | 30% | Na | Na | 7 | 21% | Na | Na | 21 | 43% | Na | Na |
| Programs | 10 | 37% | Na | Na | 12 | 55% | Na | Na | 18 | 53% | Na | Na | 4 | 40% | Na | Na | 10 | 29% | Na | Na | 20 | 41% | Na | Na |
| Incentives | 0 | 0% | Na | Na | 4 | 18% | Na | Na | 2 | 6% | Na | Na | 0 | 0% | Na | Na | 6 | 18% | Na | Na | 5 | 10% | Na | Na |
| Funding | 3 | 11% | Na | Na | 5 | 23% | Na | Na | 9 | 26% | + | * | 1 | 10% | Na | Na | 6 | 18% | + | * | 8 | 16% | Na | Na |
| Data sources | 9 | 33% | Na | Na | 2 | 9% | − | * | 8 | 24% | Na | Na | 1 | 10% | Na | Na | 7 | 21% | Na | Na | 31 | 63% | + | * |
*p<0.05, ** p<0.01*** p<0.001.
Appendix F.: Total/percent content and KW test for network membership
.
| USDN (n = 145) | R100 (n = 73) | C40 (n = 61) | Climate mayors (n = 148) | |||||||||||||
| Framing | N | % | Dir. | Sig. | N | % | Dir. | Sig. | N | % | Dir. | Sig. | N | % | Dir. | Sig. |
| General-heat | 100 | 69% | Na | Na | 51 | 70% | Na | Na | 42 | 69% | Na | Na | 99 | 67% | Na | Na |
| Thermal comfort | 27 | 19% | Na | Na | 13 | 18% | Na | Na | 11 | 18% | Na | Na | 26 | 18% | Na | Na |
| Urban heat island | 101 | 70% | + | * | 52 | 71% | Na | Na | 46 | 75% | Na | Na | 103 | 70% | + | * |
| Extreme heat event | 91 | 63% | + | ** | 47 | 64% | Na | Na | 45 | 74% | + | *** | 89 | 60% | Na | Na |
| Equity | 46 | 32% | + | *** | 27 | 37% | + | ** | 22 | 36% | + | * | 44 | 30% | + | * |
| Energy | 76 | 52% | Na | Na | 38 | 52% | Na | Na | 37 | 61% | Na | Na | 78 | 53% | Na | Na |
| Health | 87 | 60% | Na | Na | 43 | 59% | Na | Na | 40 | 66% | Na | Na | 86 | 58% | Na | Na |
| Economy | 42 | 29% | Na | Na | 18 | 25% | Na | Na | 22 | 36% | Na | Na | 41 | 28% | Na | Na |
| Infrastructure | 53 | 37% | Na | Na | 29 | 40% | Na | Na | 28 | 46% | + | * | 54 | 36% | Na | Na |
| Transportation | 23 | 16% | Na | Na | 13 | 18% | Na | Na | 18 | 30% | + | *** | 24 | 16% | Na | Na |
| Ecology | 82 | 57% | Na | Na | 38 | 52% | Na | Na | 39 | 64% | Na | Na | 83 | 56% | Na | Na |
| Water | 54 | 37% | Na | Na | 28 | 38% | Na | Na | 30 | 49% | + | ** | 53 | 36% | Na | Na |
| Air quality | 56 | 39% | Na | Na | 29 | 40% | Na | Na | 26 | 43% | Na | Na | 54 | 36% | Na | Na |
| General-vulnerability | 62 | 43% | + | ** | 31 | 42% | Na | Na | 31 | 51% | + | ** | 62 | 42% | + | ** |
| Exposure | 42 | 29% | Na | Na | 20 | 27% | Na | Na | 19 | 31% | Na | Na | 42 | 28% | Na | Na |
| Sensitivity | 58 | 40% | + | * | 31 | 42% | Na | Na | 27 | 44% | Na | Na | 56 | 38% | Na | Na |
| Adaptive capacity | 41 | 28% | + | * | 24 | 33% | + | * | 22 | 36% | + | * | 39 | 26% | Na | Na |
| USDN (n = 145) | R100 (n = 73) | C40 (n = 61) | Climate mayors (n = 148) | |||||||||||||
| Hard interventions | n | % | Dir. | Sig. | n | % | Dir. | Sig. | n | % | Dir. | Sig. | n | % | Dir. | Sig. |
| Green roof | 37 | 26% | Na | Na | 20 | 27% | Na | Na | 19 | 31% | Na | Na | 39 | 26% | Na | Na |
| Reflective roof | 46 | 32% | Na | Na | 26 | 36% | Na | Na | 23 | 38% | Na | Na | 46 | 31% | Na | Na |
| Reflective pavement | 15 | 10% | Na | Na | 11 | 15% | Na | Na | 8 | 13% | Na | Na | 18 | 12% | Na | Na |
| Tree/canopy | 81 | 56% | Na | Na | 43 | 59% | Na | Na | 33 | 54% | Na | Na | 84 | 57% | + | ** |
| Vegetation | 38 | 26% | Na | Na | 21 | 29% | Na | Na | 15 | 25% | Na | Na | 37 | 25% | Na | Na |
| Shaded areas | 30 | 21% | Na | Na | 18 | 25% | Na | Na | 13 | 21% | Na | Na | 30 | 20% | Na | Na |
| Comprehensive | 48 | 33% | + | ** | 27 | 37% | + | ** | 22 | 36% | Na | Na | 44 | 30% | Na | Na |
| Other-hard | 17 | 12% | Na | Na | 11 | 15% | Na | Na | 8 | 13% | Na | Na | 17 | 11% | Na | Na |
| Soft interventions | n | % | Dir. | Sig. | n | % | Dir. | Sig. | n | % | Dir. | Sig. | n | % | Dir. | Sig. |
| Policy | 45 | 31% | Na | Na | 21 | 29% | Na | Na | 24 | 39% | + | * | 44 | 30% | Na | Na |
| Install | 13 | 9% | Na | Na | 6 | 8% | Na | Na | 5 | 8% | Na | Na | 13 | 9% | Na | Na |
| Study/monitor | 46 | 32% | + | * | 25 | 34% | Na | Na | 25 | 41% | + | ** | 45 | 30% | Na | Na |
| Educate/outreach | 58 | 40% | Na | Na | 32 | 44% | Na | Na | 27 | 44% | Na | Na | 57 | 39% | Na | Na |
| Partnerships | 38 | 26% | Na | Na | 26 | 36% | + | *** | 24 | 39% | + | *** | 38 | 26% | Na | Na |
| Warn | 26 | 18% | Na | Na | 14 | 19% | Na | Na | 15 | 25% | Na | Na | 28 | 19% | Na | Na |
| Plan | 64 | 44% | Na | Na | 36 | 49% | Na | Na | 32 | 52% | + | * | 62 | 42% | Na | Na |
| Programs | 66 | 46% | Na | Na | 35 | 48% | Na | Na | 33 | 54% | + | * | 65 | 44% | Na | Na |
| Incentives | 17 | 12% | + | * | 12 | 16% | + | ** | 9 | 15% | Na | Na | 17 | 11% | Na | Na |
| Funding | 26 | 18% | Na | Na | 18 | 25% | + | * | 13 | 21% | Na | Na | 27 | 18% | Na | Na |
| Data sources | 47 | 32% | Na | Na | 25 | 34% | Na | Na | 21 | 34% | Na | Na | 51 | 34% | Na | Na |
*p<0.05, ** p<0.01*** p<0.001.
Footnotes
- 7
From the AMS glossary: 'Heat, used as a noun, is confusing and controversial in its scientific meaning.'
- 8
For instance, the MET Heat-Health Watch response to the 2003 European heat wave, the Environmental Protection Agencies Excessive Heat Events and Urban Heat Island Guidebook (EPA 2006, 2008), the World Health Organization (WHO) Early Warning Systems (EWS, 2015) and Global Heat Health Information Network, and the National Integrated Heat Health Information System (NIHHIS, NOAA, 2016) in the United States.
- 9
The United States House Science Committee held the first ever federal hearing on extreme heat, the United Kingdom MET Office published a study on the global impacts of extreme heat, and GHHIN held its inaugural forum in 2018 (Madge 2011, PBS 2021). The Adrienne Arsht-Rockefeller Foundation established the Extreme Heat Resilience Alliance (EHRA) and the United Nations' International Labor Organization internationally and efforts by community-based organizations to push heat as a priority in local and state government (EHRA, UN, Guardano et al 2020). As of 2022, Athens, Freetown, Miami, Phoenix, and Santiago have officially established formal roles in local government (e.g. chief heat officers), with more likely soon.