

Abstract
Mapping tree species diversity is increasingly important in the face of environmental change and biodiversity conservation. We explore a potential way of mapping this diversity by relating forest structure to tree species diversity in Gabon. First, we test the relation between canopy height, as a proxy for niche volume, and tree species diversity. Then, we test the relation between vertical canopy structure, as a proxy for vertical niche occupation, and tree species diversity. We use large footprint full-waveform airborne lidar data collected across four study sites in Gabon (Lopé, Mabounié, Mondah, and Rabi) in combination with in situ estimates of species richness (S) and Shannon diversity (H'). Linear models using canopy height explained 44% and 43% of the variation in S and H' at the 0.25 ha resolution. Linear models using canopy height and the plant area volume density profile explained 71% of this variation. We demonstrate applications of these models by mapping S and H' in Mondah using a simulated GEDI-TanDEM-X fusion height product, across the four sites using wall-to-wall airborne lidar data products, and across and between the study sites using ICESat lidar waveforms. The modeling results are encouraging in the context of developing pan-tropical structure-diversity models applicable to data from current and upcoming spaceborne remote sensing missions.
Export citation and abstract BibTeX RIS

Original content from this work may be used under the terms of the Creative Commons Attribution 3.0 licence. Any further distribution of this work must maintain attribution to the author(s) and the title of the work, journal citation and DOI.
1. Introduction
Spatial information on tree species diversity is important to enable effective conservation and biodiversity management (Turner et al 2003) and allow for a better understanding of scale dependent relationships between forest composition and productivity (Luo et al 2019). Information on the local presence, absence, and diversity of tree species has traditionally been collected through in situ forest inventories (Rios-Saldaña et al 2018). Yet, those are time-consuming and expensive, which often prevents extensive and spatially representative coverage. Using such inventories in combination with remotely sensed data is one approach to overcome some of these limitations and relationships between remotely sensed environmental data (e.g. mean annual temperature, annual precipitation, dry season length, etc) and vegetation species have been developed to map Amazonian and Global vascular plant diversity (Ter Steege et al 2003, Mutke and Barthlott 2005). However, these approaches incorporate little information on the vegetation itself and the data products are provided at spatial resolutions (typically ∼100 km grid cells) not optimized for conservation management.
Huston (1979) pointed out that there is a large body of literature regarding the relation between forest structure and the diversity of different taxa, while only few studies explore the relation between forest structure and tree species diversity itself. It has since been argued on several occasions that vegetation structure could be related to tree species diversity via the occupation of vertical niche space. This is the basis of a potential structure-diversity relationship, and three hypotheses have been proposed to explain it (Kohyama 1996, Sheil and Burslem 2003, Marks et al 2016, Gatti et al 2017). First, the forest architecture hypothesis asserts that tree species in the tropics have a higher variance in adult tree height, corresponding to higher species diversity, than in the temperate zone where short-statured stands with trees of uniform adulthood-height demonstrate less diversity (Kohyama 1993, 1996). Second, the gap-size frequency hypothesis, proposed by Sheil and Burslem (2003), asserts that canopy gaps provide a range of light conditions to which different species can be more or less specialized. A changing gap-size frequency distribution would allow different light regimes and thus different species to grow (Denslow 1980). Third, the height-diversity hypothesis asserts that a higher forest volume provides greater niche space and would thus likely result in a higher species diversity. A significant positive relation between tree species diversity and tree height, as a proxy for forest volume, was found, explaining a limited amount of the variance in tree species diversity within the USA and on a global scale (Marks et al 2016, Gatti et al 2017). However, Givnish (2017) objects that the use of just forest height leads to deceptive results since it only provides information on the potential trait space (volume below canopy) that could be occupied, but does not measure the occupation of this trait space. In this study we address this caveat by exploring the relation between tree species diversity and the vertical vegetation structure; hereafter referred to as the structure-diversity relationship.
Active remote sensing systems, such as lidar and radar provide information on the vertical arrangement of the canopy (Bergen et al 2009). Specifically, full-waveform lidar data provide detailed and more direct measurements of the vertical profile of canopy elements, which is available from the previously earth-orbiting GLAS instrument onboard of the ICESat satellite (Tang and Dubayah 2017), NASA's airborne Land Vegetation and Ice Sensor (LVIS) (Blair et al 1999, Tang et al 2012) and the recently launched Global Ecosystem Dynamics Investigation (GEDI). Such vertical canopy profiles providing information on the amount of plant material (leaves and branches) along the vertical axis have previously been used to distinguish successional vegetation types in a tropical savanna-forest mosaic in Gabon (Marselis et al 2018). We expect that these profiles also provide information on the occupation of available niche space between the forest floor and the top of the canopy and can be related to tree species diversity. The implication is that mapping tree species diversity in the tropics may then be feasible due to the launch of GEDI, which is collecting billions of lidar waveforms between 51.6° latitude north and south of the equator, in December 2018. Data from other spaceborne missions, such as the TanDEM-X radar and the ICESat-2 lidar missions, may aid in the mapping process by gap-filling GEDI data products, and increasing the spatial resolution and extent of these data (Qi and Dubayah 2016, Lee et al 2018).
The overall goal of this study is to explore the structure-diversity relationship in a tropical forest and savanna landscape in Gabon. In particular, we seek to understand whether vertical canopy structure explains more of the variance in tropical tree species diversity than canopy height alone and whether we can use this relationship to predict tree species diversity across Gabon using different remote sensing datasets.
The remainder of the study is organized as follows: (i) we first create linear models to relate canopy height from lidar waveforms to tree species diversity from field data; (ii) we then use two sets of metrics describing the vertical canopy profile and relate these to the tree species diversity; (iii) we then compare the performance of these models; (iv) and use the height model to predict tree species diversity from LVIS canopy height and from GEDI-TanDEM-X fusion height products in Mondah; (v) and we apply the vertical structure model to gridded LVIS products and vertical profiles derived from ICESat to predict tree species diversity across and between four study sites.
2. Method
In this section, we introduce the four study sites and the datasets used. We explain the processing of the field and lidar data, followed by the model development for testing the structure-diversity relationship and the application of these models to create spatial predictions of tree species diversity from different active remote sensing data products.
2.1. Field data processing
Gabon was chosen as case-study location because of the large availability of field and remote sensing datasets collected during the AfriSAR campaign (Fatoyinbo et al 2017). The four study sites in Gabon are referred to as Lopé, Mondah, Mabounié and Rabi (figure 1) and each site includes multiple sampling plots. All sites fall within the general classification of tropical terra firme broadleaf forest, but have different species compositions and assemblies, disturbance history, and management regimes. The plots in this analysis are distributed between savanna, successional, degraded and old-growth tropical forest and are situated in climate zones with different annual precipitation and temperature (table 1, see SI1 is available online at stacks.iop.org/ERL/14/094013/mmedia for detailed information). In Lopé twelve stem mapped field plots (nine 1 ha, three 0.5 ha) were established in 2016 as part of the AfriSAR campaign. These data are available through ForestPlots.net (Lopez-Gonzalez et al 2009, 2011, Labrière et al 2018). The Mondah data were also collected during the AfriSAR campaign in 2016 and are publicly available through the NASA Oak Ridge National Laboratory Distributed Active Archive Center (ORNL DAAC) (Fatoyinbo et al 2018). The site comprises fifteen 1 ha stem mapped plots, thirteen of which are coincident with the LVIS lidar data. We excluded three of the thirteen plots from the Mondah site that contained a high percentage of unidentified trees (SI1). Twelve 1 ha field plots were established in Mabounié in 2012 (Labrière et al 2018), of which 10 are coincident with the LVIS lidar data and suitable for this study. A 25 ha plot comprises the Rabi site. These data were collected by the Smithsonian Conservation Biology Institute, National Zoological Park, and the Forest Global Earth Observatory (ForestGEO), and are available on request through the ForestGeo website14 . From the Rabi plot, we selected the thirteen non-adjacent hectares and considered them as separate plots for the analysis. Subsampling kept this study site from dominating the models, as the Rabi site consisted of a total sampled area twice as large as the other sites (figure 2(a)). Field data collection at the four sites was performed by different people and organizations, which led to datasets with varying characteristics (in terms of e.g. plot layout and minimum DBH measured). Details about the study sites and field datasets are described in SI1. For consistency among the sites we only included trees with DBH ≥ 10 cm in our analysis. The availability of stem maps (in Lopé, Mondah, and Rabi) and subplots (in Mabounié) enabled testing of the structure-diversity relation at different resolutions. This was necessary because species diversity and plot size are not linearly related (species-area curve, described by MacArthur and Wilson 1967) and no optimal resolution has been identified for the structure-diversity relation. Smaller plots were created by subdividing each original plot into smaller squares or rectangles to create 5 spatial resolutions: 1, 0.5, 0.25, 0.0625 and 0.04 ha (figure 2(b)). Mabounié data were only used at the 1 ha and 0.04 ha resolution, due to the absence of stem maps. At each resolution only plots with at least one identified tree were included in the analysis. This resulted in respectively 41, 64, 128, 481 and 935 plots for the resolutions 1.0 ha through 0.04 ha. Tree species diversity was then quantified for each of the plots at all resolutions using two variables: the Shannon diversity (H') and tree species richness (S) expressed as the total number of tree species per area (Morris et al 2014).
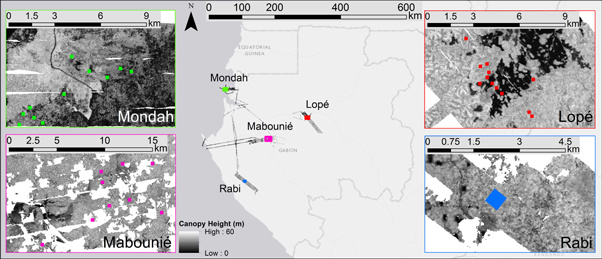
Figure 1. Field and lidar datasets from four regions (Mondah, Mabounié, Rabi and Lopé) in central and west Gabon are used in this study. LVIS lidar acquisitions are displayed as gridded canopy height (m). Insets show distribution of field plots across each study site, markers are not to scale of field plot size.
Download figure:
Standard image High-resolution imageTable 1. Information for each of the study sites regarding the total sampled area, temperature and precipitation, the tree density, species richness and Shannon diversity calculated including only trees with DBH ≥ 10 cm, at the 1 ha resolution.
| Tree density (trees/ha) | Total no. of species | Species richness (S) (No. species/ha) | Shannon diversity (H') (H'/ha) | |||||||||||
|---|---|---|---|---|---|---|---|---|---|---|---|---|---|---|
| Name | Total Area (ha) | Mean annual temperature (°C) | Mean annual precipitation (mm/y) | Total no. of trees | Range | Mean | std | Range | Mean | Std | Range | Mean | Std | |
| Lope | 10.5 | 26–33a | 1500a | 3140 | 9–501 | 308 | 174 | 118 | 2–54 | 32 | 21.6 | 0.64–3.08 | 2.15 | 0.90 |
| Mondah | 10 | 25b | 3000–3500b | 2368 | 26–453 | 237 | 173 | 139 | 7–75 | 32 | 21.3 | 1.46–3.58 | 2.60 | 0.69 |
| Mabounié | 10 | 26b | 2030b | 3537 | 222–444 | 354 | 61 | 183 | 44–68 | 54 | 7.7 | 2.90–3.61 | 3.27 | 0.23 |
| Rabi | 13 | 24–28c | 2300c | 6056 | 231–689 | 466 | 119 | 211 | 55–101 | 82 | 13.5 | 3.35–4.04 | 3.70 | 0.18 |

Figure 2. (a) Thirteen 1 ha plots (dark grey) were selected from the 25 ha Rabi plot and included in this study. (b) Subdivision of 1 ha plots to allow for analyzing the structure-diversity relationship at 5 spatial resolutions led to plots of sizes I. (100 × 100 m), II. (100 × 50 m), III. (50 × 50 m), IV. (25 × 25 m) and V. (20 × 20 m).
Download figure:
Standard image High-resolution image2.2. Lidar data processing
Full waveform lidar data were collected using the LVIS instrument with a 1 km swath width, a 1064 nm wavelength and a nominal footprint diameter of ∼20 m across all study sites as part of the AfriSAR campaign in February and March 2016. The following metrics were derived from all lidar waveforms using mature, validated and published algorithms: Relative Height 100 (RH100), Plant Area Index (PAI) at 5 m vertical resolution forming the Plant Area Volume Density (PAVD) profile and cumulative PAI at 5 m vertical resolution (Blair et al 1999, Tang et al 2012, Marselis et al 2018). These footprint-level metrics are publicly available as part of the AfriSAR deliverables through the NASA ORNL DAAC (Tang et al 2018). RH100 was used to represent canopy top height. We chose the PAVD and cumulative PAI profile because they describe the vertical vegetation structure as a biophysical property that can also be derived from data from other instruments such as ICESat and GEDI, which enables transferability of the models. Additionally, they have previously been used to understand structural and functional differences between vegetation communities (Cuni-Sanchez et al 2016, Decuyper et al 2018, Marselis et al 2018). For each plot, the average of all waveform metrics and the standard deviation of Canopy Height (RH100_sd) were calculated using all waveforms with the footprint center located within the plot boundary.
2.3. Data analysis
The field and lidar data processing resulted in five datasets, one for each spatial resolution, comprised of n samples, with n equivalent to the number of plots at the specific resolution. Each sample had one value for S, H' and each of the lidar metrics. Four sets of lidar metrics were created to test the structure-diversity relationship (table 2). We built linear models using metric sets 1 through 4 at each of the five spatial resolutions. Variable importance could not be rigorously assessed for the individual metrics due to collinearity between the metrics describing the vertical profile, since the existence of plant material higher in the canopy is dependent on the existence of material lower in the canopy. For each model, we performed leave-one-plot-out cross-validation. All plots within a 1 ha plot were kept aside in the cross-validation approach for models built at the 0.5, 0.25, 0.0625 and 0.04 ha resolutions, to avoid overestimation of model performance by the model being trained towards the local variation within the 1 ha plot. For each model, we calculated the R-squared (R2) and the root mean squared difference, as a percentage (RMSD%) of the mean observed S and H', from the cross-validated predictions to evaluate model performance (Piñeiro et al 2008). Bias was evaluated as the intercept of the linear relation between predicted (x-axis) and observed (y-axis) S and H'. An intercept not significantly different from 0 indicated an unbiased prediction. The slope of the linear relation indicated the consistency of the predicted and observed variables. A slope significantly different from 1 indicated no consistency (Piñeiro et al 2008). We used 95% confidence intervals around the R2 to evaluate whether metric sets 3 and 4 (canopy structure) led to significantly better diversity predictions than sets 1 and 2 (canopy height).
Table 2. Sets of metrics used in linear models predicting H' and S.
| Metric set | Model name | Explanatory variables |
|---|---|---|
| 1 | Height | RH100 |
| 2 | Height and standard deviation of height | RH100, RH100_sd |
| 3 | PAVD profile + height | P5a, P10, P15, P20, P25, P30, P35, P40, P45, P50b, RH100 |
| 4 | Cumulative PAI profile + height | CP5c, CP10, CP15, CP20, CP25, CP30, CP35, CP40, CP45, CP50, RH100 |
aP5 = PAI between 0 and 5 m aboveground, subsequently P10 = the PAI between 5 and 10 m etc. bP50 = PAI between 45 and 50 m above ground, in case vegetation is higher than 50 m this value indicates the PAI above 45 m. cCP5 = Cumulative PAI between 0 and 5 m aboveground, subsequently CP10 = the PAI between 0 and 10 m, etc.
We used the canopy height and standard deviation of canopy height model at the 0.25 ha resolution to predict S and H' for Mondah from two datasets: (1) the canopy height product from LVIS gridded at 50 m and (2) a simulated GEDI-TanDEM-X fusion height product at 20 m resolution (Lee et al 2018). TanDEM-X is a twin X-band SAR satellite mission from which the HH polarization was used for the fusion product. GEDI simulations were created from the LVIS waveforms using the GEDI simulator, considering 50% cloud cover (Lee et al 2018, Hancock et al 2019). We resampled the GEDI-TanDEM-X product to 50 m resolution and computed mean and standard deviation of forest height for each cell.
We used the PAVD (starting at P10) and canopy height model at 0.25 ha resolution to predict S and H' for all four regions. We applied these models to (1) LVIS data products gridded at 50 m resolution and (2) ICESat waveforms collected within and between the four study sites. We used all ICESat waveforms collected between 2004 and 2006. P5 was omitted as it has a low accuracy due to the interference of slope with vegetation close to the surface within the nominal footprint of 50 m.
3. Results
We first provide the results of the linear models using canopy height alone to predict S and H'. Then we provide the results of the models using the vertical canopy profile metrics to predict S and H'. Last, we show the spatial predictions of S and H' created using the calibrated and validated models.
3.1. Modeling results using canopy height
The cross-validated linear models using canopy height (set 1) explains a limited percentage of the variance in H' and S. At the 1.0 ha resolution, 28% and 35% of the variation in H' and S is explained (R2 = 0.28 and R2 = 0.35). At the 0.25 ha resolution R2 = 0.43 and 0.44 (figure 3 and SI2). Incorporating information on canopy height variation (set 2) increases R2 to 0.58 and 0.52 at the 0.25 ha resolution. However, the R2 confidence intervals comparing the model performance using metric set 1 and 2 are overlapping at all spatial scales, suggesting that adding information on the variance in canopy height within a plot does not necessarily lead to better predictive models (figure 4, SI2).
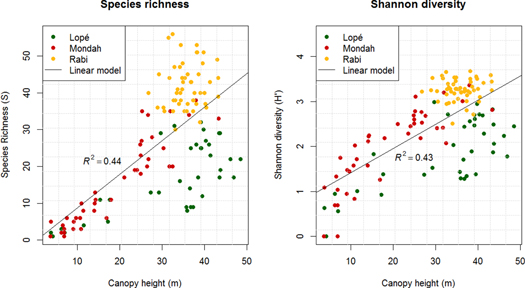
Figure 3. Canopy height explains up to 44% of the variation in tree species richness and 43% of the variation in Shannon diversity across the study sites in Gabon (cross-validated results).
Download figure:
Standard image High-resolution image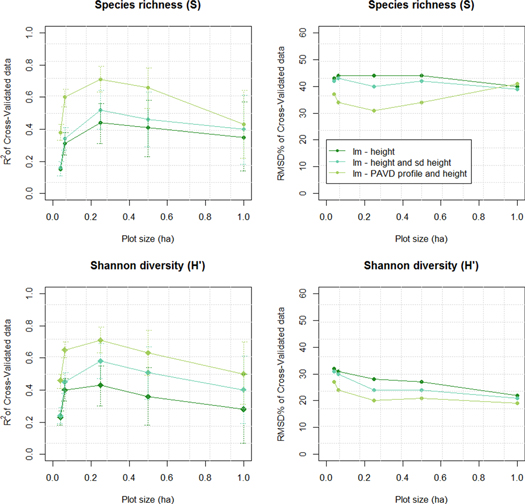
Figure 4 Linear models using height alone as a predictive variable generally show the lowest R2 and highest error (RMSD%). Adding variation in canopy height (RH100_sd) to the model leads to slightly better, but not statistically different, model performance (see overlapping error bars on the R2 plots). Incorporating information on canopy structure significantly improves the S and H models at the 0.04–0.25 ha resolutions, when compared to using height alone. Error bars are larger at larger plot size because of smaller sample sizes.
Download figure:
Standard image High-resolution image3.2. Modeling results using canopy structure
Including information on the vertical canopy profile (set 3) increases the explained variance in both H' and S to 71% at the 0.25 ha resolution, a significant improvement in model performance (figure 4 and SI2). Metric sets 3 and 4, including two different expressions of the vertical canopy profile, generally lead to similar results and only the results of set 3 are discussed in the remainder of the paper (SI2).
Our results show the best model performances for the structure-diversity relation (highest R2, lowest RMSD% and unbiased predictions) at the 0.25 ha resolution, for both H' and S models (figures 4 and 5 and and SI2).
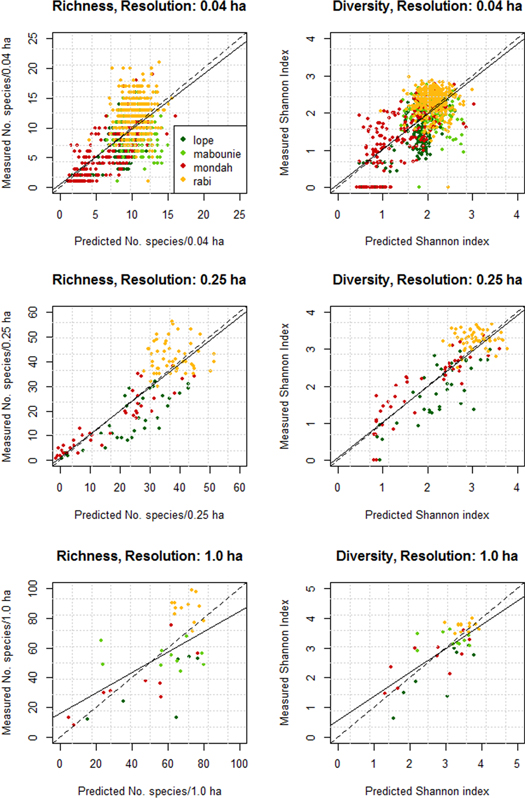
Figure 5. Predicted versus observed species richness and Shannon diversity resulting from the models using metric set 3 (PAVD profiles and height), points are colored by study site. 1.0 ha resolution models for S are significantly biased, 0.25 ha models show highest accuracy and statistically unbiased predictions for both species richness and Shannon diversity.
Download figure:
Standard image High-resolution image3.3. Predictive modeling results
The 0.25 ha linear models using metric set 2 (model performance for H': R2 = 0.58, RMSD = 24%; and S; R2 = 0.52, RMSD = 40%) were used to map H' and S in Mondah from (1) LVIS gridded products and (2) GEDI-TanDEM-X gridded products (figure 6). GEDI-TanDEM-X derived predictions for both species richness and Shannon Diversity are consistent with the LVIS predictions (R2 = 0.68 and R2 = 0.66) but overall biased slightly low (figure 6).
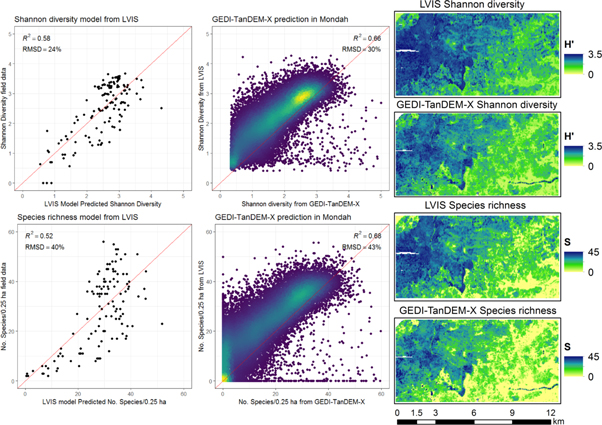
Figure 6. Shannon diversity and species richness predicted in Mondah using canopy height (RH100) and standard deviation of canopy height (RH100_sd). Predictions created from gridded LVIS data products and a simulated GEDI-TanDEM-X fusion product. Points in center panel are colored by density.
Download figure:
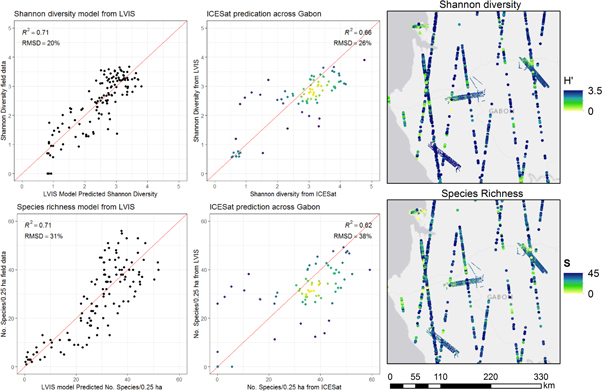
Standard image High-resolution imageSpatial predictions of H' and S for all study sites were created from the LVIS wall-to-wall data products and ICESat waveforms using the 0.25 ha linear models with the PAVD profile starting at P10 to P50 and canopy height (model performance for H': R2 = 0.71, RMSD = 20%; and S; R2 = 0.71, RMSD = 31%) (figure 7). The ICESat footprints overlapping with the wall-to-wall lidar show ICESat predictions of S and H' are slightly higher than predictions from LVIS. Shannon diversity predictions (with R2 = 0.66 and RMSD = 26%) are more accurate than the species richness predictions (with R2 = 0.62 and RMSD = 38%).
Figure 7. ICESat data enabled predictions of H' and S within and between the study sites. ICESat richness predictions were biased slightly high compared to LVIS predictions. Points in center panel are colored by density.
Download figure:
Standard image High-resolution image
4. Discussion
Our study presents regional results relating canopy height and vertical canopy structure, derived from active remote sensing data, to tree species diversity in African tropical forest. We first discuss the modeling results and the relationship between canopy structure and tree species diversity. Then we discuss some limitations to our approach and close with an outlook on the applications of the structure-diversity models.
4.1. Model performance
Canopy height has been hypothesized to be related to tree species diversity by assuming canopy height is a proxy for canopy volume, representing the available niche space. Our study shows a significant relationship between canopy height and the Shannon index and species richness; affirming that canopy height explains a limited percentage of the variation in tree species diversity. These results are in line with previous results found in the USA and globally by Marks et al (2016) and Gatti et al (2017). We expected that including information on the variance in canopy height within a plot might lead to better predictive models as the combination of metrics provides a more accurate proxy for forest volume than canopy height alone. Our models show an increase in R2 across all resolutions, but the improvement is not statistically significant. We then hypothesized that including information about the occupancy of vertical space, implemented by including the PAVD profile in the canopy height model, would lead to better predictions of tree species diversity. The PAVD profile is a direct measure of the degree of occupation of vertical niche space (divided in 5 m height bins) by plant material (PAI index) and thus resembles occupied niche space instead of available niche space. Our results support the hypothesis as we find a statistically significant improvement in model performance at the 0.04–0.25 ha resolutions when including the PAVD profile. At larger plot sizes (0.5 and 1.0 ha) the R2 values increased but not significantly. We tested the structure-diversity relation at different resolutions because neither species richness nor Shannon diversity is linearly related to plot size (MacArthur and Wilson 1967, Hill 1973). Our models performed best at the 0.25 ha resolution (a decrease in performance was found for both smaller and larger plot sizes). We consider two potential explanations for this phenomenon. The first one is related to the quality of measurement: large plots tend to have greater sampling errors caused by a smaller sample size, while smaller plots are less precise due to a higher influence of geolocation error (though minimized by Labrière et al (2018), a small misalignment between plot and lidar data may still result in poorer model performance). The second potential explanation is the maximum natural variation in the structure-diversity relation at an intermediate resolution. In a small plot only a limited number of trees could possibly grow due to space constraints, reducing the total variability or upper boundary of tree species diversity. By contrast, the amount of different tree species may get close to a certain maximum in a large plot (as species-area curves suggest) while similar canopy structure may be found as in smaller plots. In our study, it is at an intermediate resolution that the largest variation in tree species/plot was found, as indicated by the highest coefficient of variation in tree species richness at the 0.25 ha resolution (SI3). This trend is consistent with the trend of canopy structure with its maximum coefficient of variation at the 0.25 ha resolution. Yet, it is difficult to decouple the two factors due to the limited data sets in this study, and additional research would be needed to better identify the ecological mechanisms behind this phenomenon. Nonetheless, the modeling results for predicting Shannon diversity and species richness follow the same trend—for both diversity variables the PAVD profile with height provides a significantly better model than using height alone at the 0.25 ha resolution—strengthening our confidence in the existence of a structure-diversity relationship across these study sites in Gabon.
4.2. Limitations
Time lag between field and lidar data collection was minimized, but we had to accept a maximum time-lag of five years (Rabi) which may have affected the strength of the structure-diversity relationship. The new census of the Rabi field data, which is under collection at the time of writing, may provide more insight on tree species diversity change over time and the effect of time-lag in the structure-diversity relation.
The diversity metrics used to establish the structure-diversity relation rely heavily on the accuracy of species identification in the field. Tree species identification in the tropics can be very complex and highly trained local botanists are needed to provide the most accurate identification. In most of our study sites (Rabi, Mabounié and Lopé) the percentage of trees of unknown species was low, but in Mondah this percentage was much higher because the species identification was carried out by botanists with knowledge of vascular plant taxonomy in Gabon, but not specifically for the Mondah region (SI1). Slik et al (2015) showed that higher percentages of unidentified trees can affect model outcomes, which should be kept in mind when evaluating our results and future research could assess the specific impact of unidentified trees on our models, for example by re-inventory of the trees in Mondah.
In our study, we were not able to include small trees because only two field inventory datasets included trees with DBH ≥ 1 cm, thus we included only trees with DBH ≥ 10 cm to allow for consistency across all study sites. However, Fricker et al (2015) showed that the inclusion of small trees in Barro Colorado Island (Panama) improved their model performance (relating species richness to various metrics describing terrain, hydrology and canopy structure) from R2 = 0.25 when using trees with DBH ≥ 10 cm to R2 = 0.35 when using trees with DBH ≥ 1 cm. More information on small trees will be needed to assess their specific impacts on the models created in this study.
The plots included in the analysis were distributed across different vegetation types: savanna, forest with different degrees of degradation, successional forest and low-disturbance old-growth tropical forest. It is likely that the encountered structure-diversity relationship is driven partly by this gradient in forest types. More undisturbed old-growth tropical forest plots would be needed to study the structure-diversity relationship within old-growth forest. Additionally, it is yet unclear how the structure-diversity relationship holds or changes across different biogeographic regions, with changing limitations to tree growth, and different climatic niches that may change the canopy structure and the use of vertical niche space. Future research should focus on the transferability of the structure-diversity models to other regions and continents to establish the potential of using this method pan-tropically or potentially across multiple biomes. Lastly, studying how the structure-diversity relationship changes between the local-scale, such as in a large plot like BCI (Fricker et al 2015; Wolf et al 2012), and at a regional scale, such as developed here and in Mao et al (2018) and Robinson et al (2018), will be important to ultimately evaluate the structure-diversity relationship pan-tropically.
4.3. Applications and future research
The commissioning of new satellite missions, providing information on vertical canopy structure, is an important incentive to explore the potential applications of the structure-diversity relationship. Here we demonstrated the application of the developed models to wall-to-wall LVIS data products to create predictive maps of diversity and richness in the four study sites. The spatial area covered by these wall-to-wall products is limited due to the airborne nature of the data and data gaps occur as the laser energy does not penetrate clouds, which are often prevalent over Gabon. But, the real strength of our modeling approach lies in its potential to be applied to data from other instruments such as ICESat, GEDI, and TanDEM-X. The ICESat predictions overlapping with the LVIS wall-to-wall products showed S and H' predictions around the 1:1 line. The scatter around the 1:1 line is partly caused by the model accuracy, the time-lag between these two data products (collected 10–12 years before the LVIS data) and the accuracy of the ICESat data products. But, the major drawback for using ICESat is the sparse sampling, leaving tens of kilometers between tracks over Gabon. On the contrary, the recently launched GEDI lidar mission will provide much denser lidar sampling with between-track spacing of 600 m and along-track spacing of 60 m. However, the nominal footprint size (∼22 m diameter) is close to the smallest resolution tested here and our modelling results showed a higher predictive error compared to the models that can be applied directly to ICESat data. On the other hand, fusion of the GEDI waveforms with other active remote sensing data, such as from TanDEM-X radar, has the potential to change this resolution, fill in data gaps and provide wall-to-wall data products allowing for the application of models developed at different resolutions (Qi and Dubayah 2016, Lee et al 2018). It may then also be possible to build structure-diversity models directly on fused GEDI-TanDEM-X data products when these data become available more widely after GEDI's data collection. So far, it has been shown that canopy height can be retrieved using GEDI-TanDEM-X fusion, but, if we would be able to extract more information on the vertical canopy profile using GEDI and TanDEM-X data fusion, or fusion with another interferometric sensor such as on the BIOMASS mission, it may be possible to accomplish true wall-to-wall mapping of tree species diversity in the pan-tropics and beyond.
5. Conclusion
Canopy height alone, used as a proxy for niche volume, can predict a limited percentage of the variation in tree species diversity across a savanna-tropical forest landscape in Gabon, Africa. Including information on the vertical canopy structure, used as a proxy for vertical niche occupation, derived from large footprint full-waveform lidar data improved these models significantly. This structure-diversity relationship and the models developed here show potential for application to data from active remote sensing satellites such as ICESat, TanDEM-X, BIOMASS and GEDI. Further research is encouraged to study the structure-diversity relationship across the tropics to establish the potential of mapping pantropical tree species diversity using measurements of canopy structure.
Acknowledgments
This work is supported by NASA Headquarters under the NASA Earth and Space Science Fellowship Program—Grant 80NSSC17K0321, under the NASA New Investigator Program—Grant 80NSSC18K0708, under NASA's Global Ecosystem Dynamics Investigation (GEDI, Grant NNL15AAO3C) and NASA's AfriSAR campaign. The AfriSAR campaign was conducted in Gabon in collaboration with l'Agence gabonaise d'études et d'observation spatiale (AGEOS) and the Agence Nationale des Parcs Nationaux (ANPN). Research permission was granted by the Centre National de la Recherche Scientifique et Technologique (CENAREST—permit numbers AR0011/17/MESRSFC/CENAREST/CG/CST/CSAR and AR0024/10/MESRDT/CENAREST/CG/ CST/CSAR) and the Agence Nationale des Parcs Nationaux (ANPN). Lidar data collection in Lopé, Mondah, Mabounié and Rabi was carried out by the NASA Land Vegetation and Ice Sensor (LVIS) team led by Bryan Blair, Michelle Hofton and David Rabine and hosted by AGEOS (Ghislain Moussavou, Tanguy Gahouma), we express our sincere gratitude to their team for their effort to collect these data.
We are grateful to ANPN and AGEOS for the provision of logistical support that facilitated both field work and lidar data collection, specifically to Flore Koumba Pambo, Josue Edzang Ndong and David Lehmann from ANPN for their support. The field data collection in Lopé was funded by ESA through the AfriSAR campaign, coordinated by Simon Lewis and guided by Nicolas Labrière, and hosted by ANPN and the University of Stirling at the SEGC field station. We would like to specifically thank Carl Ditougou, Pacôme Dimbonda, Arthur Dibambou, Edmond Dimoto, and Napo Milamizokou. The field data collection in Mondah was funded by NASA through the AfriSAR campaign, coordinated and guided by John Poulsen, and hosted by ANPN. The field data collection in Mabounié was led by Nicolas Barbier and performed in collaboration with the Missouri Botanical Garden (Tariq Stevart) and Golder Associates and we would specifically like to thank P Ploton, V Droissart, and Y Issembe for their help and expertise. The field data collection in Rabi was funded through Shell Gabon and the Smithsonian Conservation Biology Institute. The data were collected under guidance of Alfonso Alonso, Herve Memiaghe, David Kenfack and Pulcherie Bissiengou. This is contribution No. 171 of the Gabon Biodiversity Program. We express our sincere gratitude to everyone involved in these field campaigns and for making the data available for this study.