

Abstract
Essential biodiversity variables (EBV) are information products for assessing biodiversity change. Species populations EBVs are one class of EBVs that can be used to monitor the spread of invasive species. However, systematic, reliable, repeatable procedures to process primary data into EBVs do not yet exist, and environmental research infrastructures still must improve their capabilities to deliver EBV data products. Here, we tested the ability of two mature biodiversity data infrastructures, the Global Biodiversity Information Facility and the Atlas of Living Australia, to cooperatively produce EBV data products for three alien invasive species. We detailed workflow steps to discover, filter, retrieve and prepare the primary data before evaluating species' distributional changes. The two data infrastructures were able to execute several workflow steps, but external tools, third-party sources and expert judgement were required, and a repeatable workflow was difficult to establish. Nevertheless, the resulting data products revealed strong range expansions for the invasive species, demonstrating the policy-relevant information about global environmental change that can be provided by EBV data products. Our results show that more coordination between infrastructure providers is needed to efficiently produce EBV-ready data products for invasion monitoring in a repeatable fashion. Addressing these issues will allow improved tracking of invasive species range dynamics and hence monitoring of ongoing global biodiversity change.
Export citation and abstract BibTeX RIS

Original content from this work may be used under the terms of the Creative Commons Attribution 3.0 licence. Any further distribution of this work must maintain attribution to the author(s) and the title of the work, journal citation and DOI.
1. Introduction
Essential biodiversity variables (EBV) are information products located between primary biodiversity data (e.g. occurrence records, sampling events) and statistical indicators that help scientists, managers, politicians and citizens to understand the state of biodiversity (Pereira et al 2013, Brummitt et al 2017, Navarro et al 2017). Well-founded EBVs of the species population class can be used, for example, for monitoring, reporting and managing extinction risk of threatened species and for managing the spread of invasive species (Latombe et al 2017). However, while the conceptual framework for EBVs is steadily improving (Brummitt et al 2017, Schmeller et al 2017, Kissling et al 2018a, 2018b), the practical implementation of EBVs and their support by environmental research infrastructures remains challenging. In part, this is because data often comes from multiple sources with both open and restricted access, and these sources are poorly aligned. Ideally, the taxonomic, occurrence and life history data should be served by complementary and interoperable environmental research infrastructures, but mechanisms of compatible information flows are only now being established and streamlined, e.g. for alien invasive species (Vanderhoeven et al 2017, Pagad et al 2018). Data and research infrastructures therefore need to cooperate globally to serve and process the essential large datasets for generating EBVs (Kissling et al 2015).
The ability of environmental research infrastructures to produce and apply EBVs is presently hampered by the absence of widely adoptable procedures to process and integrate primary biodiversity data in a systematic, reliable and repeatable way (Kissling et al 2018a). Specific technical challenges faced by infrastructures include: accessibility of source data; assuring quality and integrity of the data; defining EBV data product structures; achieving repeatability of the procedure and comparability of the product; and balancing the use of automation with the need for human expertise. Several of these points can be addressed with workflow-oriented approaches (Atkinson et al 2017, Kissling et al 2018a), but research infrastructures hardly cooperate at present to achieve this (Kissling et al 2015). Here, we investigate the challenges of a workflow-oriented production of an EBV data product using an applied scenario, specifically the implementation of a workflow to produce information about invasive species distributions (IVSDs). We build our work on the conceptual workflow developed by Kissling and colleagues (Kissling et al 2018a) and test the possibility of jointly using two mature biodiversity data infrastructures—the Global Biodiversity Information Facility (GBIF) and the Atlas of Living Australia (ALA)—to produce a species distribution EBV data product capable of addressing species-level questions where management of invasion is the focus. A workflow-oriented process that integrates EBV-relevant data from cooperating research infrastructures will help to address global environmental challenges such as the monitoring of alien invasive species (van Kleunen et al 2015, Bohan et al 2017) by providing comprehensive data products to inform biodiversity assessments and policy decisions. National and global reporting on Aichi Biodiversity Target 9 for invasive alien species (McGeoch et al 2016) is one such example (figure 1).

Figure 1. A conceptual framework for how research infrastructure collaboration can facilitate production of Essential biodiversity variables (EBVs), and how this can help to address global environmental challenges such as biological invasions. Information on invasive alien species (left) is fed into general research infrastructures (centre) which can inform decisions made by policy makers through developing workflows for building EBV data products (right).
Download figure:
Standard image High-resolution image2. Approach
We developed and tested an IVSD workflow with the aim to derive an EBV data product for alien invasive species assessments. We were interested to identify which workflow steps are needed to prepare available distribution records, to process records into a data product, and to calculate metrics to assess species distributional changes over time, and how these could be supported by the two infrastructures, GBIF and ALA. As argued by Kissling et al (Kissling et al 2018a), the species distribution EBV is conceptualised as a species occupancy matrix with basic dimensions of taxonomy, time and space. We chose the area of occupancy (AOO) as a simple measure for quantifying the spatial distribution of species (IUCN 2012, 2017). AOO is a measure of the area of cells occupied by the species on a grid, and has been used to track species range expansions (McGeoch and Latombe 2016).
For our case study, we selected three species based on alien and invasive status in parts of Australia and elsewhere in the world (figure 2, and supplementary information 1 is available online at stacks.iop.org/ERL/14/025005/mmedia): Acacia longifolia (Andrews) Willd., Vespula germanica (Fabricius, 1793) and Bubulcus ibis (Linnaeus, 1758). For each species, we manually executed a multi-step workflow and derived AOO measures from the data, using these to investigate whether global and regional invasion patterns can be revealed.

Figure 2. Three species with established alien ranges were selected. All are invasive in parts of Australia and elsewhere in the world, with potential negative impacts on native biodiversity and human economy (source: Global Invasive Species Database (ISSG Invasive Species Specialist Group 2015)). The number of records and their temporal range were derived from the Global Biodiversity Information Facility (GBIF) and the Atlas of Living Australia (ALA). Note that Acacia longifolia includes two subspecies (subsp. longifolia and subsp. sophorae) and in parts of Australia is introduced outside of its historic range.
Download figure:
Standard image High-resolution imageTo develop the IVSD workflow, we used prior knowledge of specific workflows for occurrence data retrieval and cleaning (Mathew et al 2014) and for creating and visualizing models for species distributions and range shifts (De Giovanni et al 2016). We also built on and tested the 11 key workflow steps proposed to operationalize the building of EBV data products on species distributions and abundances (Kissling et al 2018a). With this knowledge, we developed a detailed description of the workflow steps to discover, filter, retrieve, reconcile and clean occurrence data records. The sequence of steps aimed to gather 'EBV-usable' data, i.e. data sufficiently fit for purpose for preparing EBV data products (Kissling et al 2018a) from different sources and to harmonise and aggregate this usable data into a single 'EBV-ready' dataset. i.e. one ready to be used as the basis of an EBV data product (Kissling et al 2018a).
For each species, we used data from two data infrastructures: GBIF and ALA. GBIF (Edwards 2004) harvests7 occurrence records from more than 1100 institutions around the world and publishes these in a standardized format based on Darwin Core terms (Wieczorek et al 2012). The ALA is Australia's national biodiversity data aggregation facility (Belbin and Williams 2016) and the official Australian GBIF node; thus, one of the sources GBIF harvests data from. Users can access the GBIF.org and ALA.org.au websites, or corresponding Application Programming Interfaces (API), to filter and download data based on combinations of Darwin Core terms (Wieczorek et al 2012) and extra information about the records added by GBIF and ALA.
The first filtering step selected the target taxon using the correct scientific name. Based on combinations of record properties and issues flags, subsequent filtering (i.e. facetted search) successively narrowed the selection, excluding, for example, records with missing geographical coordinates, event date, and/or flagged issues. This produced a selection of records with known characteristics matching the study requirements (i.e. fit-for-use). Of the potential 185 Darwin Core fields, those containing no effective information for the present purpose were removed. Merging the data from GBIF and the ALA, and retaining valid geo-referenced records (as mapped by the Global Administrative Areas database (Hijmans et al 2015)) with valid year information produced the EBV-ready data.
Using the EBV-ready data, we mapped records for each specific year to different temporal periods and to cumulative periods (decade, quarter and half century and century). Known sites of introduction of the species were designated as 'alien', and core regions of the native range as 'native'. Occurrence records situated close to the known, coarse-scale boundaries of the species/subspecies distribution or in regions where the native/introduced status is unclear were designated as 'uncertain range status'. The aim here was to deal with lack of resolution on the historic boundaries of the native geographic ranges of the taxa (McGeoch et al 2012). In the case of A. longifolia, which presently comprises two subspecies (A. longifolia subsp. longifolia and A. longifolia subsp. sophorae (Labill.) Court) and includes historic records under different and separate species names (Butcher et al 2001), additional care had to be taken to correctly designate the records (supplementary information 2).
A land grid at 2 km resolution, consistent with IUCN guidelines (IUCN 2017) was derived for the world from a boundary-dissolved version of the Global Administrative Areas database (using GADM28_adm0) projected in World Cylindrical Equal-Area (ArcGIS v10.5, ESRI, Redlands, USA). Taxon location records were spatially related to the land grid (converted to points) using 'generate near' in ArcGIS in geodesic distance within 2000 m as valid AOO grids. AOO calculations were derived for each taxon by temporal period (year, decade, quarter and half century) and cumulatively across periods. The number of de-duplicated records were counted to indicate spatial and temporal sampling effort.
Taxon location records (including possible vagrants), synthesised into decadal AOO time-series datasets, were used to evaluate global and regional patterns of invasion. The use of occurrence records in this way provides one of the three essential variables recommended for invasion monitoring, and is an exemplar application of a Species Distribution EBV in the Species Populations EBV Class (Latombe et al 2017). We visualize the information in the form of range expansion trends (cumulative increases in AOO over time) and global distribution maps.
3. Workflow description
For specific steps mentioned in the following text, the reader should refer to the tables in supplementary information 3 as well as to figures 3–5.

Figure 3. First stage of the species distribution EBV workflow as applied to invasive species, with the aim of preparing the available records into an EBV-usable dataset. Filters applied as part of the discovery and retrieval steps (3–5) to delimit the species of interest are performed within the environment of the data publisher, whereas filters applied after data export (i.e. steps 7 and 8) relate to the properties of the records and must rely on use of third-party tools.
Download figure:
Standard image High-resolution imageThe IVSD workflow for producing the Species Distribution EBV data product was split into three stages (figures 3–5), comprising multiple steps. The first stage is concerned with gathering EBV-usable data (figure 3) by discovering and retrieving relevant data from each of the data infrastructures (ALA and GBIF) and checking and processing it to ensure fitness for the intended purpose.
We searched and filtered the available data, retrieving subsets from ALA and GBIF for each of our selected three species (ALA 2017a, 2017b, 2017c, GBIF 2017a, 2017b, 2017c). To prepare EBV-usable data, we further processed the data by filtering out records with quality issues (such as missing or inaccurate geographical coordinates, see table 1 in supplementary information 3 for details).
In the second stage (figure 4), usable data was made EBV-ready by merging the two sets of cleaned data from stage 1 (see table 2 in supplementary information 3 for details). Finally, we deposited a complete data package comprising the files resulting from the steps of the workflow.8
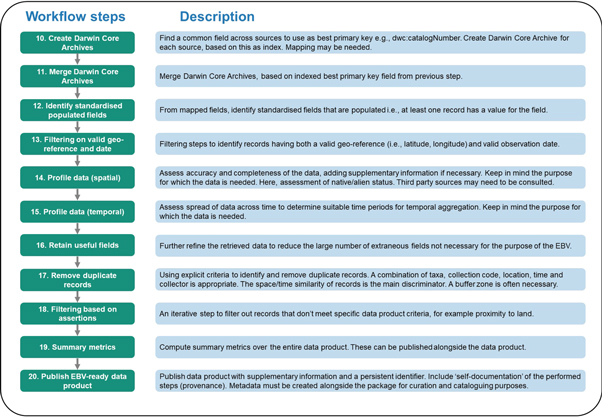
Figure 4. Second stage of the species distribution EBV workflow in which records are processed into an EBV-ready data product (steps 10–20).
Download figure:
Standard image High-resolution imageIn the final stage (steps 21–24 in figure 5), specific to the invasion biology use case, we computed AOO metrics, i.e. the EBV-derived data product. This highlighted well-known challenges associated with species data, and with invasive alien species data specifically (Groom et al 2017), such as large numbers of synonyms (including name variants) and the taxonomic uncertainty associated with occurrence records. For example, in the Sydney golden wattle, some occurrence records were not identifiable to subspecies. Nomenclature changes also occurred over the course of the invasion history of the species. The task of delimiting occurrence records in the native versus alien range (step 21) is particularly challenging, and most often likely to require human expert input. This is well illustrated with Sydney golden wattle, where only coarse, historical and human expert drawn range maps are available for the species and subspecies.

Figure 5. The final stage of the species distribution EBV workflow (steps 21–24), specific to the invasion biology use case, computes and uses AOO metrics to assess species distributions in different time slices. Abbreviations: GIS = geospatial information system; GADM = Global Administrative Areas database; AOO = area of occupancy.
Download figure:
Standard image High-resolution image4. Interpretation of metrics produced from the EBV data product
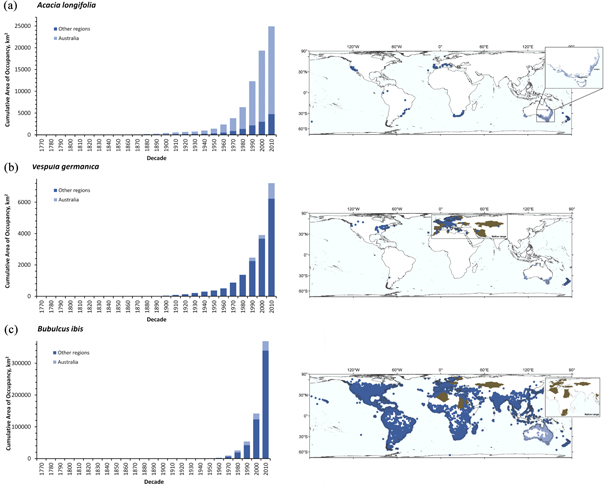
The AOO metrics derived from the EBV data product showed that B. ibis (Cattle egret) and V. germanica (European wasp) are comparatively recent invaders (since 1970s) in Australia, whereas invasion by A. longifolia (Sydney golden wattle) started much earlier (figure 6 histograms (a)–(c)).
Figure 6. Global area of occupancy (AOO) and recorded distribution of (a) Acacia longifolia (inset: putative native range of Acacia longifolia in south-eastern Australia); (b) Vespula germanica (box: countries of native range grey shaded); (c) Bubulcus ibis (inset: native-origin countries grey shaded).
Download figure:
Standard image High-resolution image
For all three species, AOO shows an exponential increase over the last few decades, with a dramatic increase of B. ibis over the last two decades. As with most time series for invasive species based on occurrence records collated from multiple sources, rather than species-targeted monitoring data, the summary trends (figure 6) require appropriate interpretation. The AOO time series represent minimum estimates of range expansion and provide a wealth of information from which further useful outputs can be produced (examples in supplementary information 5) relevant to invasion research, monitoring, reporting and management (Latombe et al 2017).
Of specific note is that the World map for Vespula germanica (figure 6) depicts the species as absent in South Africa. This is known to be false and is a consequence of filtering out occurrence records with quality issues (missing or inaccurate geographical coordinate information and/or missing information about the date of the observation), which for South Africa caused all available records to be excluded.
5. Discussion
The IVSD workflow developed here is a tangible step towards a practical, workable solution for verifiable, consistent and repeatable methods of producing EBV data products when such methods involve multiple complex steps and procedures. It shows that environmental research infrastructures such as GBIF and ALA have an important role in supporting the preparation of precise, maintainable data products. Such data products provide important information to address global environmental challenges such as biological invasions. In the present example, invasion trends could be derived, visualized and interpreted from the EBV data product prepared using our workflow. Nevertheless, despite offering similar data and similar capabilities for discovering and filtering relevant data, both GBIF and ALA vary in technical details. This makes automation of EBV workflow processes across the two research infrastructures challenging.
5.1. Differences due to infrastructure design
Being well illustrated in supplementary information 3, we made transparent the steps a researcher needs to go through in discovering, retrieving, processing and merging data across more than one infrastructure and in making decisions about which fields to use in assessing data quality, etc. Different programming procedures had to be applied according to whether the steps were performed on ALA or GBIF data and within the ALA or GBIF platforms or outside them. Heterogeneity of column descriptions (headers) between GBIF and ALA exported data, which propagated into the merged data led to an overwhelming array of fields, making the merge and eventual use of the data difficult. GBIF and the ALA already pre-apply changes in step 6 (export data) of figure 3 to improve data quality but do it in different ways. Note that some infrastructures automate such fixes and add a flag indicating what has been done, while others simply flag the issue. In step 7 (initial filtering) infrastructures offer various approaches to filtering on basic dimensions of name/taxonomy, space and time. Such differences are confusing for users. More examples of issues we encountered are listed in supplementary information 4.
Applying the workflow steps by manual execution (meaning we did not encode steps in any programming language or automated workflow management system (Atkinson et al 2017)), we encountered significant difficulty in accurately, concisely and comprehensively recording details of steps. The combination of using manual actions in conjunction with web-based front-ends to databases.9 standard computer software such as Microsoft Excel with its macro capabilities, Microsoft Access relational queries, bespoke bash script programming for merging the data, and ESRI ArcGIS for spatial operations was both ambiguous and error prone. Although our work can be reproduced today with similar results, it is not until the workflow is refined, proven and automated that it could be confidently repeated by any person and with new monitoring data to track invasions. Although the initial investment of time and effort might be considered high for a one-off case, building the capability to automatically and repeatedly execute this and other workflows like it into environmental research infrastructures is an essential next step that we expect leads to significant increases in speed and accuracy through removal of time-consuming and error-prone manual steps. This is especially important when moving the production of EBV data products to 'factory-scale' and for the maintenance of up-to-date EBV data products taking most recently mobilised data into account.
5.2. The interplay of human expertise and machine automation
When applying the workflow steps, we found the need for extensive expert human input and judgement at multiple points, even within single workflow steps. For instance, information missing in the primary data regarding the native/alien status of a species for a given location led to consulting specialised third-party data sources such as the Global Invasive Species Database (GISD), the Global Register of Introduced and Invasive Species (GRIIS) (Pagad et al 2018), and the CABI Invasive Species Compendium (CABI 2017a, 2017b, 2017c) to make the EBV data products relevant to evaluate biological invasions (see also Groom et al 2017). We also expect such third-party sources to be needed as inputs for other EBV data products, and these should in the future be made better integrated by the research infrastructures. Moreover, when using the EBV data product, further expert knowledge of the historic (native) versus introduced geographic ranges is needed, specifically at fine resolutions near the boundaries of historic ranges.
There are multiple points where automation can be applied, although some workflow steps will always require expert human judgement in combination with computer assistance. As well as increasing speed, accuracy and quality of all steps in the future, the aim should be to resolve differences between the data structures, environments and operations of different data infrastructures and to ensure accurate automated recording of what was done (i.e. provenance). Automation and provenance are essential elements for handling larger quantities of data on a more frequent basis, for reliably repeating work, and to ensure that subsequent editions of data products are comparable when reporting on biodiversity change. Dissemination of proposed automations and review of these by communities of practice are also essential to adoption.
5.3. Improving interoperability between and across infrastructures
Record level standardisation (including of added value fields) in data would be a significant step towards better interoperability between biodiversity data infrastructures. A harmonised approach, with each data record having a single universally consistent identifier would allow data processing and quality checks to be more consistent and transparent, as well as permitting full standardisation of programmatic interfaces for data access and download formats. It ought to be possible for a user to state that they used all records meeting a specific data quality profile that ensures fitness for the intended use (Chapman et al 2017, Veiga et al 2017), and for that criterion to be an acceptable and repeatable one. Selecting records could be made simpler via standard filter profiles that can be defined for sets of combined filters. Up to the point at which the data download is initiated, the infrastructure should create provenance information (Missier et al 2013) for all steps applied, and assign a persistent identifier that allows the steps to be recalled and repeated. These critical issues remain unresolved hurdles and are key insights from our work.
In recent years, GBIF and ALA as well as other infrastructures have already collaborated on handling species occurrence data, specifically under the auspices of Biodiversity Information Standards (TDWG, www.tdwg.org) where a suite of standardized tests has been developed.10 Our results show that further work is needed. Dealing with the above concerns, aligning stages in the data processing chain, increasing automated assistance, improving integration to third-party sources (e.g. GRIIS and GISD as used in this case study) and offering automated in-built workflow steps through their APIs, with consistency among infrastructures, would address many of the challenges encountered in preparing EBV-ready data. In conjunction with relevant communities of practice, the time is right for developing more efficient procedures and targeting data packages to EBV delivery (Navarro et al 2017). Cooperation of infrastructures on these aspects (sensu lato figure 1) would greatly improve workflows for addressing global environmental challenges, acting along the way also as vital steps towards the stronger, more integrated infrastructural framework for biodiversity information, analysis and intelligence the community recognises as necessary (Hardisty and Roberts 2013, Hobern et al 2013). We suggest that greater coordination, and even integration of processes among data infrastructures would improve the efficient use of data repositories. Although there are good reasons to maintain separate portals and access points both for data optimised and enriched for national use and for data aggregated and standardised at a global scale, a harmonised approach would benefit interoperability and efficient data re-use. Many of the processing steps described in our IVSD workflow are more broadly applicable and often precursory to interpretation and analysis of primary (observational) biodiversity data. GBIF and the ALA have begun discussing together and with other related infrastructures such as iDigBio to reengineer the data management processes and hence to deliver more transparent and integrated data products.
5.4. Infrastructure, data and workflows combine to deliver detailed evidence for policy and invasion management
Building a 'coordinated and harmonised system of observing systems for biodiversity' is the principle aim of the Group on Earth Observations Biodiversity Observation Network (GEO BON) (Navarro et al 2017). A critical part of progress towards this involves not only mobilising available biodiversity data via research infrastructure resources like GBIF and ALA, but also integrating and harmonising data from those multiple sources and designing production workflows that will work with such infrastructures (Kissling et al 2018a). The development and application of the IVSD workflow presented here demonstrates the first example for how research infrastructures can collaborate globally on transforming raw data (occurrence records) into an EBV data product for informing policy around global environmental challenges (e.g. Aichi Biodiversity Target 9 regarding the identification and prioritisation of alien species and their invasion pathways) (Latombe et al 2017). The results for the few exemplar species used here support the broader evidence-base of continued spread of alien invasive species through human activities (van Kleunen et al 2015, Kueffer 2017, Pagad et al 2018), and the subsequent break down of biogeographic boundaries through the globalization of human-mediated dispersal of species (Capinha et al 2015). Despite existing estimates of the magnitude of biological invasions at a global scale (van Kleunen et al 2015), available and accessible data for informing policy and management are lacking for most taxa, even at coarse spatial resolutions (Pagad et al 2018). Providing and developing EBV data products on the distribution and abundance of alien invasive species therefore holds substantial potential for improving the estimates of species range expansion, informing species dispersal pathways and management prioritisation efforts (McGeoch and Latombe 2016, McGeoch et al 2016). These can become increasingly comprehensive due to continuing acceleration in the accumulation of observation-based occurrences by infrastructures such as GBIF (Troudet et al 2018) and ALA. Hence, environmental research infrastructures play an increasingly crucial role in delivering evidence of global biodiversity change by providing comprehensive and reproducible data products. Coupling them with custom virtual research environments (a.k.a. virtual laboratories or science gateways) (Hardisty et al 2016), where such data products can be exploited to make forecasts about biodiversity and give support to policy would be a significant step forward.
6. Conclusions
Our results illustrate the complex interplay of human expertise, judgement and machine automation that is presently needed for preparing and processing primary biodiversity data and ancillary information into EBV data products. This reflects a snapshot of the ability of biodiversity information supply chain and research infrastructure today to address global challenges. This readiness evolves and continually improves through ongoing work combining information technology advances, social architectures and vast volumes of data. GBIF and the ALA are providing a wealth of biodiversity-related data and are stepping up their efforts to increase interoperability between them. Despite this, however, the continuing lack of integrated data manipulation tools, and absence of an ability to execute workflows within environmental research infrastructures are an impediment to greater data re-use. Addressing these infrastructure challenges is critical to realising the vision of EBVs and their contributory role in addressing global environmental challenges such as biological invasions.
Acknowledgments
The reported work has been performed by the GLOBal Infrastructures for Supporting Biodiversity research (GLOBIS-B) project (www.globis-b.eu) funded by the European Union Horizon 2020 Programme, grant no. 654003 (2015–2018) (Hardisty, Kissling). CSIRO through the Atlas of Living Australia and GBIF are founding partners in the GLOBIS-B project and respectively provided in-kind support for Belbin (ALA), Pirzl and Williams (CSIRO) and Hobern (GBIF). McGeoch acknowledges Australian Research Council grant DP150103017. The work was also conducted as a contribution to the species distribution EBV working group of GEO BON. We are grateful for the assistance of Peter Ansell, Data Analyst at CSIRO/Atlas of Living Australia for scripting and merging the data from GBIF and ALA. We also acknowledge the sponsorship of the late Dr John La Salle, former Director of the ALA.
Footnotes
- 7
- 8
Data package available on Zenodo: 10.5281/zenodo.2275703.
- 9
i.e. the ALA spatial portal, http://spatial.ala.org.au/, and the GBIF data portal, https://gbif.org/.
- 10