

Abstract
Human activities both aggravate and alleviate streamflow drought. Here we show that aggravation is dominant in contrasting cases around the world analysed with a consistent methodology. Our 28 cases included different combinations of human-water interactions. We found that water abstraction aggravated all drought characteristics, with increases of 20%–305% in total time in drought found across the case studies, and increases in total deficit of up to almost 3000%. Water transfers reduced drought time and deficit by up to 97%. In cases with both abstraction and water transfers into the catchment or augmenting streamflow from groundwater, the water inputs could not compensate for the aggravation of droughts due to abstraction and only shift the effects in space or time. Reservoir releases for downstream water use alleviated droughts in the dry season, but also led to deficits in the wet season by changing flow seasonality. This led to minor changes in average drought duration (−26 to +38%) and moderate changes in average drought deficit (−86 to +369%). Land use showed a smaller impact on streamflow drought, also with both increases and decreases observed (−48 to +98%). Sewage return flows and pipe leakage possibly counteracted the effects of increased imperviousness in urban areas; however, untangling the effects of land use change on streamflow drought is challenging. This synthesis of diverse global cases highlights the complexity of the human influence on streamflow drought and the added value of empirical comparative studies. Results indicate both intended and unintended consequences of water management and infrastructure on downstream society and ecosystems.
Export citation and abstract BibTeX RIS

Original content from this work may be used under the terms of the Creative Commons Attribution 4.0 license. Any further distribution of this work must maintain attribution to the author(s) and the title of the work, journal citation and DOI.
1. Introduction
Human activities increasingly influence river flow [1]. Over half of the world's major rivers are regulated by dams [2, 3], while increasing urban populations and conversion of land to agriculture affect the hydrological cycle [4, 5] and consumptive water use decreases river flow worldwide [6, 7]. These effects are expected to increase in the future, with groundwater abstraction, river fragmentation, and land use change strongly impacting future river flow [8]. Most research on the human influence on hydrological systems, however, focuses on one type of human activity, for example effects of groundwater abstraction [8], reservoirs [9], or land use change [10, 11], or on one type of water use, for example irrigation [12, 13] or hydropower [14]. In reality, these effects are often combined and it is of interest also to investigate their interactions and potential counterbalancing effects. Research also often focuses on long-term average annual or seasonal flow conditions (e.g. [3, 6]), whilst most impacts are felt during extremes, particularly in periods of dry anomalies. Streamflow drought (defined as below-normal river flow) has large impacts on various sectors, including public water supply, navigation, and river ecology [15]. These streamflow droughts are potentially affected by upstream human activities [16].
Studies aiming to quantify the human influence on streamflow drought typically fall into two types: large-scale modelling exercises [17] or case studies [18] based on one or two test sites. For a thorough understanding of processes, empirical studies are essential because observed data encompass the complexity of the real world whereas large-scale modelling relies on unavoidable generalisations and simplifications [19]. Large-sample studies [20] draw insights from a large collection of observation points. These have high potential also to be used for the study of human influences on streamflow drought, as shown by [21] and [9]. These studies, however, rely on datasets with good-quality meta-data on human influences. With the CAMELS datasets [22–24] this information is becoming increasingly available in more countries, but still global coverage is limited. In many regions, local expert knowledge is still crucial to understand the timing, location, scale, and type of human influences in a catchment. This analysis is time-consuming and as a results often only one or a few cases are analysed. A literature review of 37 peer-reviewed case studies published between 2009 and 2021 (table 1; supplementary material S1 available online at stacks.iop.org/ERL/17/044059/mmedia) shows that mostly 1–3 cases are analysed within one study (maximum n = 12). There is also a geographical bias with most case studies conducted in China.
In the reviewed cases in table 1, the effects of human activities on streamflow drought were analysed in very different ways and therefore results cannot easily be compared across studies. Firstly, different drought analysis methods were used (table 1—Method), with as most common approaches standardised indices and the fixed and variable threshold level method [25]. Secondly, in the application of a method many choices need to be made (e.g. choice of distribution for standardised indices) that can have large influence on the results [26]. Very important is the threshold that is used to define the drought. In the reviewed studies (table 1—Threshold), this ranged from the long-term average streamflow level (0 for standardised indices/Q50 for threshold-based methods) to extremely dry anomalies (Q90). Thirdly, when analysing the effect of human influences on streamflow drought, the reference for calculating the standardised or threshold-based indices can be determined from the human-influenced streamflow series or from the natural benchmark (table 1—Reference). This was done differently across the reviewed studies and again could have large influences on the results [18]. Finally, different drought characteristics were reported (table 1—Characteristics). In some studies, the change in drought characteristics due to the human influence was quantified, while in others only a qualitative indication of change was given. In some, drought characteristics were not reported separately and only an overall assessment of change in drought was provided.
Table 1. Diverse set of methodologies used to study impacts of human activities on streamflow drought in published observation-based case studies. Drought analysis method: standardised, threshold-based (fixed or variable), or other method. Threshold (drought indicator level): Q70, Q80 etc = 70th, 80th percentile for threshold-based methods, number between −1 and 0 = indicator level for standardised method, other = other method. Reference for drought identification: natural reference, human-influenced reference, NA. Change in drought characteristics: overall = overall assessment of the human influence, full circle = change quantified, empty circle = reported, but not quantified. For the full table and reference of each case study, see supplementary material S1.
| Case study information | Method | Threshold | Reference | Characteristics | ||||||||||||||
|---|---|---|---|---|---|---|---|---|---|---|---|---|---|---|---|---|---|---|
| Case | Country (river/basin) | Standardised | Variable threshold | Fixed threshold | Other | 0/Q50 | −0.5/Q70 | −0.8/−1/Q80 | Q90 | Other | Natural | Human-influenced | NA | Frequency | Total time | Average duration | Average deficit | Overall |
| 1 | Iran (Lake Urmia) | • | • | • | ∘ | |||||||||||||
| 2 | USA (Columbia) | • | • | • | • | • | • | • | ||||||||||
| 3 | China (Laohahe) | • | • | • | • | • | • | |||||||||||
| 4 | China (Laohahe) | • | • | • | • | • | • | |||||||||||
| 5 | China (Yangtze) | • | • | • | ∘ | ∘ | ||||||||||||
| 6 | Iran (Kiakola) | • | • | • | ∘ | |||||||||||||
| 7 | Iran (Eskandari) | • | • | • | ∘ | |||||||||||||
| 8 | China (Yangtze) | • | • | • | ∘ | ∘ | ||||||||||||
| 9 | New Zealand (Lindis) | • | • | • | ∘ | |||||||||||||
| 10 | China (Yangtze) | • | • | • | • | • | ∘ | ∘ | ||||||||||
| 11 | China (Shiyang, n = 5) | • | • | • | ∘ | • | • | |||||||||||
| 12 | China (Laohahe) | • | • | • | • | • | • | |||||||||||
| 13 | Spain/Portugal (Tagus) | • | • | • | ∘ | ∘ | ||||||||||||
| 14 | China (Heihe) | • | • | • | • | • | • | |||||||||||
| 15 | China (Yellow, n = 6) | • | • | • | ∘ | ∘ | ||||||||||||
| 16 | China (Naoli) | • | • | • | ∘ | |||||||||||||
| 17 | Italy (Po, n = 2) | • | • | • | • | • | • | |||||||||||
| 18 | Malaysia (Johor, n = 3) | • | • | • | ∘ | ∘ | ∘ | |||||||||||
| 19 | China (Dongjiang) | • | • | • | ∘ | • | • | |||||||||||
| 20 | Australia (Murray-Darling) | • | • | ∘ | ||||||||||||||
| 21 | Spain (Upper Guadiana) | • | • | • | • | • | • | |||||||||||
| 22 | Czech (Svitata) | • | • | • | • | • | • | |||||||||||
| 23 | Czech (Bilina) | • | • | • | • | • | • | |||||||||||
| 24 | Brazil (Jaguaribe, n = 2) | • | • | • | • | • | • | • | ||||||||||
| 25 | China (Luanhe) | • | • | • | • | • | • | |||||||||||
| 26 | China (Laohaha, n = 3) | • | • | • | • | • | • | |||||||||||
| 27 | Australia (Murrumbidgee, n = 2) | • | • | • | ∘ | ∘ | ∘ | |||||||||||
| 28 | China (Jinjiang) | • | • | • | ∘ | ∘ | ||||||||||||
| 29 | China (Dongjiang) | • | • | • | ∘ | ∘ | ||||||||||||
| 30 | China (Luanhe) | • | • | ∘ | ||||||||||||||
| 31 | China (Yangtze) | • | • | • | ∘ | ∘ | ∘ | |||||||||||
| 32 | China (Yellow, n = 12) | • | • | • | • | • | • | |||||||||||
| 33 | China (Yellow, n = 12) | • | • | • | • | • | • | |||||||||||
| 34 | China (Yangtze, n = 3) | • | • | • | • | • | • | |||||||||||
| 35 | China (Kuye) | • | • | • | ∘ | ∘ | ||||||||||||
| 36 | China (Jinsha) | • | • | • | ∘ | |||||||||||||
| 37 | China (Wei, n = 2) | • | • | ∘ | ||||||||||||||
This huge diversity in methods and methodological choices used to assess the human influence on streamflow drought makes a generalised understanding challenging. A systematic and coherent approach across case studies is needed to reliably generalise lessons learned [27]. Here, we aim to quantify the human influence on streamflow droughts using a consistent methodology applied to contrasting observation-based case studies across the world. From this analysis we aim to obtain an increased understanding of the role of human activities on streamflow drought, which is needed to sustainably manage freshwater resources during drought and improve streamflow drought modelling and forecasting [16].
2. Case studies
We collated 28 empirical case studies globally (figures 1(a) and (b)) that fit the selection criteria of this study (human influence present, time series longer than ten years, naturalisation data available). These cases cover all continents, with the highest concentration in Europe, and have a large spread in climate characteristics (figures 1(c) and (d)) and catchment sizes (figure 1(e) and table S2). Quantitative and qualitative contextual information for these cases was obtained from local expert knowledge and reports (summarised in tables S2 and S3).
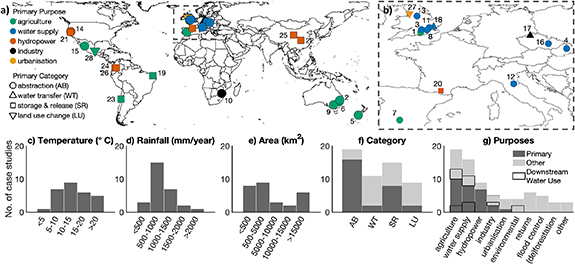
Figure 1. Twenty eight case studies, distributed (a) across the globe and (b) Europe, with a diversity of (c) mean annual temperature, (d) annual precipitation, (e) catchment area, (f) human-influence categories, and (g) water/land use purposes. For case study names and further information, see figure 3, tables S2 and S3.
Download figure:
Standard image High-resolution imageBased on this information, the cases were grouped into four categories of human activities (figure 1(f)). Dominant primary categories of human activity are abstraction from groundwater and/or surface water and water storage and release with reservoir infrastructure. The two other categories, i.e. water transfer into the river and land use change, are mostly identified as additional categories. For the abstraction cases, the abstraction ratio was estimated as annual abstraction divided by annual discharge (table S2), based on available data or qualitative information. For some cases this ratio may be more accurate than for others, but for all cases it gives an indication of the relative magnitude of abstraction.
We also looked at the purposes of the abstracted, transferred or stored water and the way in which land use had changed. Our cases mostly have agriculture, water supply, and hydropower as their main purpose (figure 1(g)), but a range of other additional purposes are present. Noteworthy are several cases in which the human activities are aimed at providing water for use downstream of the gauging station (black boxes in figure 1(g)). These include cases with reservoirs providing water for downstream abstractions for agriculture, water supply, and environmental or water quality purposes (table S3).
3. Data and methods
3.1. Observation data
Observed river discharge (mm/month) was used for all case studies to represent the human-influenced river flow situation (Van Loon 2022). Case study time period lengths varied between 10 and 65 years, with a mean of 32 years (table S2).
3.2. Naturalisation
For each of the 28 cases, benchmark discharge data (representing the discharge that would have occurred without the human influences) were obtained with one of three approaches (table S2; Van Loon, 2022): paired catchments (n = 8), upstream-downstream comparison (n = 6), or naturalisation of observed flows with a model (n = 14). In paired-catchment analysis (P-C) observed discharge time series from a human-influenced catchment are compared with observations from a catchment without the human influence under study but with otherwise similar catchment characteristics (e.g. hydrogeology, precipitation) [28]. Upstream-downstream comparison (U-D) is a similar approach to paired-catchment analysis, but instead of using adjacent or nearby catchments an undisturbed upstream part of the catchment is used for comparison [29, 30]. Naturalised-observed comparison (N-O) is based on naturalisation of discharge data using models (e.g. hydrological modelling, simple statistical modelling, water balance approach) to simulate the time series without anthropogenic influences [31]. Variations in method depend on local data availability and the best method for the local situation [31]. However, all case studies had the same time period for the human-influenced and benchmark discharge time series to allow for comparison (table S2).
3.3. Drought analysis, comparison and human-drought types
A consistent drought analysis methodology was then applied to both human-influenced and benchmark time series. Drought events were identified as periods during which the discharge is below the benchmark Q80 threshold (monthly 80th percentile of benchmark discharge, the value exceeded 80% of time) [32–34]. Only droughts with durations of at least two months were considered. For all case studies, the threshold was generated from the benchmark data based on the longest time period available.
Four different drought characteristics were calculated: total time in drought over the analysis period, average duration per drought event, total drought deficit over the analysis period, average deficit per drought event. We selected these because these are reported most in published literature (table 1) and because they are important indicators in water management indicating drought duration and severity [35]. We calculated duration and severity on average per drought event and over the entire period of record, because these time intervals show different effects, for example when the human influences would lead to more shorter droughts. The difference in drought characteristics due to the human influence was calculated as percentage change as follows:
The human influence can be positive or negative for different individual events [36] and these might cancel each other out when calculating average and total drought characteristics. Therefore, we also analysed the human-aggravated and human-alleviated drought events for each case study. For each event where the human-influenced, benchmark discharge, or both were below the benchmark Q80, we classified it into one of four human drought types (figure 2): (a) 100% human-alleviated drought (i.e. prevented drought); (b) human-alleviated drought; (c) human-aggravated drought; and (d) 100% human-aggravated drought (i.e. human-induced drought).
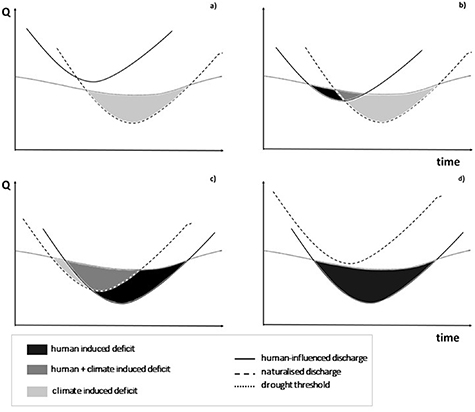
Figure 2. Schematic outline of human drought types (building on [16, 36]): (a) 100% human-alleviated: the naturalised discharge shows an event that is not present in the human-influenced time series; (b) human-alleviated drought: both human-influenced and naturalised discharge are below the threshold and human-induced deficit is lower than climate-induced deficit; (c) human-aggravated drought: both human-influenced and naturalised discharge are below the threshold and human-induced deficit is higher than climate-induced deficit; and (d) 100% human-aggravated drought: the human-influenced discharge shows an event that is not present in the naturalised time series.
Download figure:
Standard image High-resolution image3.4. Regime change
To understand potential mechanisms behind the changes in drought characteristics, we also analysed shifts in the river flow regime. We represented this regime simply as the monthly Q80 flows (same as used for the threshold), averaged for the full year as well as for the wet and dry seasons. The interquartile range of the monthly Q80 provided an indication of flow variability over the year. These indicators were calculated both for the human-influenced and naturalised flows, with percentage change established using the naturalised flows as the benchmark. For comparison, we also calculated these indicators of change of the river flow regime based on the monthly Q50 (median) flows. For each case, we partitioned the year into a six-month wet (higher flow) season and a six-month dry (lower flow) season defined by the naturalised flows. These generally followed the cool season in temperate climates (e.g. 1 Candover), the warmer season in tropical climates (e.g. 10 Komati), and were non-contiguous in the case of bi-modal climates (e.g. 26 Magdalena).
3.5. Analysis of explanatory variables
Statistical analysis was performed to find potential explanatory variables of the differences between the % human influence on drought characteristics. Continuous variables (catchment area, precipitation, temperature, start year of the human influence, ratio of annual abstraction to annual discharge) were analysed by linear regression. Categorical variables (naturalisation method & sub-method, category of human influence, number of categories, purpose of land/water use, number of purposes, source of abstraction, combinations of categories) were analysed using the Kruskal–Wallis H-test [37]. This is a non-parametric test that can be used on data that consists of two or more discrete variables and does not require normality of the data. The analysis was done with the kruskal.test function in R.
4. Results
4.1. Abstractions aggravate and water inflows alleviate streamflow droughts, but what is their combined effect?
Abstraction of water, whether it is from the river directly, from purpose-built surface water reservoirs or from groundwater, increased the severity of streamflow droughts downstream of the abstraction (figure 3, cases 1–16). Most drought events in these abstraction cases were human-aggravated (figure 3(b)). The total time that streamflow was below the benchmark Q80 increased in all cases (+20 to +240%; figure 3(c)). The average duration of individual drought events increased only slightly or even decreased, indicating that abstractions also led to more frequent short droughts. Both average and total deficits increased in all abstraction cases (up to more than +3500%), except for average deficit in 1 Candover (figure 3(c)). Again, average deficits increased slightly less due to the increase in the number of short droughts.
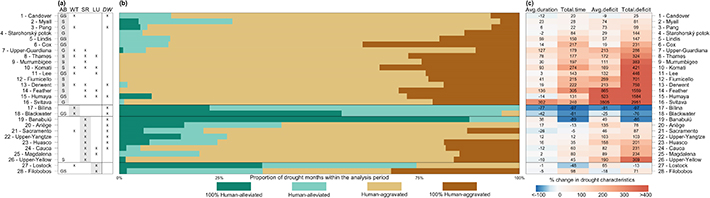
Figure 3. Aggravation and alleviation of streamflow droughts by human-influence categories abstraction (AB), water transfer (WT), water storage and release (SR), land use change (LU). (a) Primary (grey shaded) and additional categories of case studies, including abstraction from groundwater (G), surface water (S) and both (GS), see table S3. Downstream water use is indicated with DW. (b) Proportion of drought months within analysis period classified as human drought types 100% human-alleviated, human-alleviated, human-aggravated, and 100% human-aggravated (figure 1). (c) Percentage change in drought characteristics (average duration, total time, average deficit, total deficit) between human-influenced and naturalised droughts. Case studies are ordered by human-influence category and Total deficit.
Download figure:
Standard image High-resolution imageCases with abstraction for different purposes show mixed results in figure 3 and in the three cases with highest human influence on deficits, water was abstracted for public water supply (16 Svitava), agriculture (15 Humaya) and hydropower (14 Feather). We found no statistical difference between cases where water is abstracted for different purposes or from different sources (surface water, groundwater, or both; table S4). The relative amount of abstraction, however, was crucial, with the estimated ratio of abstraction to average flow having a significant influence on the human influence on total time in drought and total deficit (p = 0.046 and 0.016, respectively, table S5). Although in wetter catchments the relative amount of abstraction would be expected to be lower because of higher average flow, we found no significant effect of annual precipitation or temperature (table S5).
In all abstraction cases, the human-influenced Q80 was lower than the benchmark regime (figure 4(a)). There was overall much less river flow when water is abstracted upstream, independent of the purpose of abstraction. This was the case both in the dry and wet season (figures 4(b) and (c)), except for two agricultural cases with higher human-influenced Q80 in the dry season (2 Myall & 15 Humaya), which is partly related to water being released for irrigation further downstream of the gauging station. In almost all abstraction cases flow variability decreased (figure 4(d)).
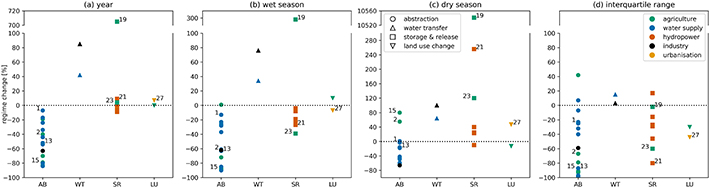
Figure 4. Regime change in % for different categories (AB = abstraction, WT = water transfer, SR = storage and release, LU = land use change) showing higher Q80 (above 0) and lower Q80 (below 0) in human-influenced compared to benchmark time series, for (a) the entire year, (b) the wet half-year, and (c) the dry half-year, and (d) interquartile range of the monthly Q80 flows giving an indication of intra-annual flow variability. Numbers indicated are the cases mentioned in the main text. Figures for the analysis of changes in the Q50 flows are provided in the supplementary material (figures S1 and S3).
Download figure:
Standard image High-resolution imageWater added to a river via inter-basin transfers alleviated streamflow droughts downstream as expected (figure 3, cases 17–18). In the two water transfer cases, droughts were either alleviated or removed completely (figure 3(b)), except for two small human-aggravated events in 18 Blackwater. All drought characteristics were reduced by water transfers (−25 to −97%; figure 3(c)). The water transfer cases showed an increase of Q80 on average over the year and in both seasons, with no significant change in flow variability (figures 4(a)–(d)).
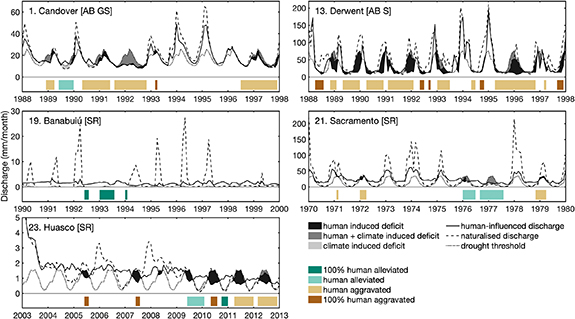
Many abstraction cases also had water transfers (from another catchment or from groundwater via an augmentation scheme; WT in figure 3(a)), downstream water use (DW in figure 3(a)), and/or sewage return flows (table S3). Although these may lessen some of the effects of abstraction on drought they often did not compensate for the aggravation (figure 3). In 1 Candover, for example, groundwater is pumped up in the upper part of the catchment to support downstream abstractions during extreme low flows [38]. This alleviated only the lowest low flows (e.g. around 1990; figure 5) and the higher low flows were still decreased by abstraction leading to more severe droughts (figure 3(b)). In 7 Upper-Guadiana, 13 Derwent, and other cases that import water from a nearby catchment, similar alleviation of extreme low flows did not compensate for the larger aggravation of other droughts (figures 2, 4 and S4). Overall, abstraction cases that also have water transfer or downstream water use did not show a significant difference in human influence on drought compared to cases that did not have these water inputs (table S4).
Figure 5. Specific cases of drought alleviation and aggravation from human activities in selected case studies (see figure S4 for all case studies). Drought events are identified in the time series plots, and their type is indicated by colour-coded bars underneath.
Download figure:
Standard image High-resolution image
4.2. Reservoirs both aggravate and alleviate streamflow droughts, but aggravation is dominant
Water storage and release structures change the timing of river flow and consequently showed both increased and decreased droughts downstream compared to the benchmark flow (figure 3, cases 19–26). The majority of drought events were human-aggravated, but also several droughts were alleviated (figure 3(b)), even in cases with large increases in drought deficits (figure 3(c)). In 19 Banabuiú all drought events were human-alleviated and this is the only case in which total deficit decreased. This is because the natural regime is highly intermittent and the comparatively large reservoir has been able to overcome multi-year droughts (figure 5). In all other cases, deficits increased (up to +369%; figure 3(c)), but notably less than in the abstraction cases. Average drought duration and total time, however, were in some cases decreased.
The main purpose of most reservoirs in the water storage and release category was hydropower generation (6 out of 8 cases), but most reservoirs also had secondary purposes (table S4). There was no statistical relation between human influence on drought characteristics and number of purposes, suggesting that multi-purpose reservoirs do not have more influence on streamflow drought (table S4). This selection, however, does not include reservoirs that are built as water supply reservoirs, which were classed as abstraction cases (i.e. 10 Komati, 13 Derwent, 14 Feather, 15 Humaya).
Water storage and release cases, on average throughout the year, had the same Q80 in the human-influenced and benchmark situation (figure 4(a), except 19 Banabuiú, showing a strong increase in Q80, but not in median flow (figure S1)). However, there was a clear difference between the seasons: Q80 decreased in the wet season (figure 4(b)) and increased in the dry season (figure 4(c)). Water storage and release structures decreased flow variability (figure 4(d)), which is as would be expected [6], although there are large differences between cases.
Many reservoirs released water for downstream water use, for agriculture, flood control, and public water supply (figure 3(a)), but these cases still mainly had an aggravation of droughts and deficits (figures 3(b) and (c)), mostly related to regime changes (figure 4). For example, 21 Sacramento and 23 Huasco show a substantial change in regime, with higher flows in the dry season and lower flows in the wet season, leading to (100%) human-alleviated droughts in the dry season (figure 5). This alleviation was, however, overshadowed by the aggravation caused by (100%) human-aggravated droughts in the wet season (figures 5 and 3).
4.3. Possible compensation of urbanisation effects by sewage return flows, but effects of land use change are harder to untangle
The two land use cases showed a combination of alleviation and aggravation of drought events (figure 3(b), cases 27–28) and a complex mix of positive and negative influences on drought duration and deficit (−48 to +98%; figure 3(c)). This may be related to the mix of activities happening in land use change case studies, thus making it difficult to isolate the land use effect. For example, in 27 Lostock the effects of urbanisation are combined with sewage return flows and in 28 Filobobos deforestation for agriculture is combined with abstraction (figure 3(a)).
These land use change cases had relatively little change in regime (figures 4(a)–(c)) with only 27 Lostock showing an increase in Q80 during the dry season (figure 4(c)). Flow variability decreased in both land use change cases (figure 4(d)).
5. Discussion
5.1. Discussion of findings
Our findings show that in almost all cases analysed, processes resulting in alleviation of drought did not compensate for the aggravation of drought due to abstraction or water storage and release. Only in the two land use change cases, the expected increase in drought due to land-surface changes seemed masked by artificial inputs.
Water abstraction removes water from the system, lowers the river flow regime, and aggravates streamflow drought. This is not unexpected and confirms other studies on the effects of abstraction on streamflow drought, e.g. observation-based work in the UK [21] and global modelling studies [17]. But what is new here is that we see limited effect of water management, with abstraction cases that also have water inputs such as water transfer or augmentation schemes not showing a significant difference with cases without these water inputs. Water transfers may result in increased drought in donor catchments, while augmentation schemes rely on abstracted groundwater. This augmentation increases river flow during extreme low flows, but may decrease it later in time (in the UK often in the following winter). This reduces flow variability (figure 4(d)) and may impact other sectors or the environment that are affected by below-normal winter flows [39].
In the water storage and release cases, the alleviation of droughts in the dry season did not compensate for the aggravation of droughts in the wet season (figure 3). This finding contradicts earlier studies, which mostly report an alleviation effect of reservoirs, e.g. in China [40] and in the USA [9]. However, modelling studies show a strong spatial variability in alleviating vs. aggravating effects of reservoirs, e.g. in the USA [41, 42], while we also find a shift in time (alleviation in the dry season and aggravation in the wet season). Although droughts in the wet season may be less problematic for water security, especially as agricultural water demands are typically highest in the dry season, reduced seasonal variability or even a complete reversal of the regime may have negative effects on river ecology [39, 43].
We did not find a relationship between reservoir purpose and effects on streamflow drought. [9] also found only limited effects of purpose for reservoirs in the USA, but she did see that reservoirs with ecological purposes reduced droughts downstream most. In our study, the reservoirs that released water for downstream water use still mainly showed aggravation of drought. Also for the abstraction cases, we found no relation with purpose or source (groundwater and/or surface water). Only the amount of abstraction (ratio of abstraction to mean annual flow) could explain the differences in influence on drought characteristics. Similar to [21] for the UK and [9] for the USA, we see a shift of droughts in time and space. This may mean that other regions or water users are impacted by the shifted drought or that certain water management options would not be available or have limited effect [9].
For the two land use cases, our findings of minor effects on streamflow drought contradict common understanding that most land use change (urbanisation, deforestation, agricultural practice) increases flow variability leading to more but shorter droughts [44, 45]. Urbanisation in 27 Lostock led to increased dry season flows, despite an increase in paved surface and peak flows [46]. This is most probably related to treated sewage inflows, which are relatively constant throughout the year and therefore increase river flow in the normally drier summer months [47] (figure S4). Pipe leakage may also be an important river flow contribution during low flow conditions [4, 48]. This shows that the influence of land use change on streamflow droughts is complex and rarely occurs in isolation from other changes in water management and infrastructure that might (over)compensate for the effect of land use change. More cases would be needed to generalise these findings.
A key finding of this study is that the overall effect of human activities on streamflow droughts is independent of catchment characteristics, or climate region. The difference in human influence on streamflow drought between the cases is not related to catchment area (p = 0.45–0.78; table S5), annual precipitation (p = 0.35–0.96), mean annual temperature (p = 0.43–0.94). The results also did not show a statistical relation with the start year of human influence (p = 0.40–1.00; table S5). This comparison could not be done before because of the range of analysis approaches used in previous studies (table 1).
5.2. Uncertainties
We acknowledge that our findings are influenced by the locations in which streamflow is observed. River gauges have been historically installed for a combination of practical, hydrogeomorphic or political reasons [49]. This implies that the human influence we observe holds for the river stretch upstream of where the gauge is situated [31]. Downstream impacts may occur as a consequence of other human activities [30, 50]. This is clearly observed in 14 Feather, where diverted flows are in part returned to the downstream river, and in 19 Banabuiú and 17 Bilina where artificially augmented (dry season) flows are abstracted downstream. Although the human influences we observe may be localised to a river stretch, they do attest to the fragmentation of the river system [51] and reduced longitudinal connectivity important to river habitats [52].
The classification of cases based on expert information required simplification of detailed and contextualised information, resulting in some uncertainty that was minimised through iterative discussion with data providers and local experts. Largest uncertainties are probably present in the classification of land use change, which is likely present in more cases than indicated in table S3, but often limited local information about these changes was available. The human-influence categories and water/land use purposes may not always be complete as information to characterise cases fully may be missing.
There is uncertainty also in the benchmark datasets used for comparison with the human-influenced streamflow data. In this study, three different well-known approaches were used [31], i.e. modelling, paired-catchment, and upstream-downstream comparison, and these were applied according to local data availability and type of human influence [31]. The details for each case are described in table S2. The decomposition or water balance method can only be applied in cases where the human influence is fully known and quantified, which was the case in 4 out of 28 cases (table S2). In many cases (8 out of 28) a hydrological model was set up to naturalise the streamflow data. Models can have high uncertainties, which are reduced by calibration. For example for 7 Upper-Guadiana, [53] calibrated the hydrological model HBV on pre-disturbance data. Their uncertainty analysis showed that the range of the modelled naturalised data did not overlap with the range of the observed human-influenced data, showing that the effects of human influence in this catchment were much higher than both model and observation uncertainties. In other naturalisation studies, the uncertainty from different model types was found to be minor, with similar results reported for different models [31]. Although modelling is often regarded as the best way to naturalise human-influenced streamflow data, [54] showed that paired-catchment analysis can give even better results (applied here in 8 out of 28 cases). To reduce uncertainty in this method, catchment selection is crucial and for drought analysis specifically hydrogeology needs to be considered caully [28]. Upstream-downstream comparison (6 out of 28 cases) is often preferred since catchment attributes for upstream and downstream parts of the same catchment are often more similar than for neighbouring catchments. In some upstream-downstream cases in our selection, a pre-disturbance time series was available, e.g. 23 Huasco [18], showing the validity of the assumption of comparability of the upstream and downstream data under natural conditions. The regionalisation method (applied in 2 cases) does not rely on one paired or upstream catchment, but on a selection of catchments. Relationships are transferred to the human-influenced catchment using machine-learning tools. Also in these cases calibration and validation showed high performance of the model [55]. In our results, we did not find a significant effect of the method applied for naturalisation on the difference in human influence on streamflow drought between the cases (p = 0.08–0.46 or p = 0.44–0.72 when taking the different variations as separate; table S4), which gives confidence in our conclusions.
By using the benchmark Q80 as threshold for both the naturalised and the human-influenced time series, changes in drought characteristics include changes in the Q80 between human-influenced and benchmark. In the published case studies we reviewed, this was done in about one-third of the studies (14 out of 37; table 1). The overall negative relationship between change in regime and change in average deficit (figure S2(a)) and average duration (figure S2(b)) indicates that if we would have used the human-influenced Q80 to determine human-influenced drought characteristics (as done in 19 out of 37 reviewed studies; table 1) we would have strongly underestimated the effect of human influence on drought.
We consistently identified droughts using a monthly Q80 threshold, so variable throughout the year following the river regime. A fixed threshold, with the same level throughout the year (applied in 5 out of 37 reviewed studies; table 1), would have given different results for the cases with changes in seasonality (mostly the water storage and release cases), missing potentially important effects. With a fixed threshold, the cases with downstream use, e.g. 23 Huasco and 21 Sacramento, would have shown the alleviation of dry season low flows without the increase in drought severity in the wet season [18]. The effect of water transfers and augmentation schemes on summer low flows in the abstraction cases, e.g. 13 Derwent and 1 Candover, may however have been more visible with a fixed threshold. We have chosen a variable instead of a fixed threshold for a consistent focus on droughts as anomalies and to use an approach comparable to widely-used standardised drought indices [25, 56, 57].
5.3. Ways forward
We see this paper as an important first step in global-scale comparison of observation-based cases on the human influence on streamflow drought. This collection of cases will be included as IAHS Panta Rhei benchmark dataset [58]. In future work, more cases could be added to this dataset and the same analysis could be done to compare more cases, especially in areas that had limited coverage in this study. This would require good-quality data. Not only trustworthy observed and naturalised data over a long period of record are needed, but also detailed contextual knowledge on the human activities is crucial for the interpretation of the data [59, 60]. In our study, it was a challenge to reach 28 cases, but we see strong potential for future studies with more cases. One way to do this is via the development of benchmark [58] and large-sample datasets [20]. Another way is to design studies that specifically aim at collecting high-quality records for the purpose of untangling the impacts of direct and indirect human activities on streamflow drought, for example via experimental catchments in human-dominated environments where not only the natural, but also the human water flows are monitored.
An important next step is also to study the dynamics of the human influence on hydrological drought. The non-stationarity of human-interventions over long (decadal) time scales, but also within a drought event, should be considered going forward [61]. Especially during long droughts, drought impacts lead to responses and (mal)adaptation measures that can feedback into the hydrological system [62, 63]. With more detailed temporal information on specific cases with multi-year droughts this could be analysed.
With an increased understanding of the (dynamic) human influence on streamflow drought, models can be improved. We should calibrate catchment and large-scale models more on human-influenced catchments (e.g. [64]). Only then can we look forward and do future scenarios where we find solutions to the large influence of human activities on hydrological drought downstream.
6. Concluding remarks
Our diverse cases show that human activities aggravate streamflow droughts more than they alleviate them. The strength of this work is that the results are empirically derived from in-situ observations in multiple river basins and analysed in a consistent manner [65]. This complements previous drought-focused studies based on either: (a) model results, which are unavoidably affected by a number of assumptions and often do not include human influences or only represent the complexity of those influences in a generic way [66]; or (b) observation-based analyses of a single case study, which prevents any form of generalization (table 1). By analysing real-world cases in all their complexity, interactions between different potentially counterbalancing human influences could be evaluated, for example potential compensation of negative effects of abstraction on drought by sewage return flows or water transfers into the catchment.
Although water abstraction and reservoirs provide a number of benefits to society [67], they can come at the expense of increased droughts for other sectors/communities and damage to riverine ecosystems. Our cases have different levels of water management, with some being quite advanced in balancing out water needs for different sectors, while others are still grappling with understanding and data (for example on illegal abstractions, e.g. 15 Humaya) or focus on one or a few sectors, neglecting others or downstream users. But even in cases with advanced management, infrastructural fixes and dependence on reservoirs or compensation by sewage can also lead to unintended consequences [68, 69], for example when water conservation decreases treated sewage inflows leading to lower low flows [70]. Also, water quality is crucial, both in cases of compensation by water transfers, groundwater, (treated) sewage and agricultural return flows. Bringing in (ground)water with a different chemical composition into the river may have unintended consequences, especially for river [71] and coastal [72] ecosystems. Equally, water transfers and augmentation can be highly offensive where communities have a cultural connection to river systems [73].
Despite the complexity in the observational data from 28 diverse cases, a consistent picture emerged of aggravation of streamflow droughts, independent of purpose and source and despite measures taken to reduce that aggravation with water transfers and river augmentation. Changes in water availability in space and time could compromise other water users, water quality, public health, and river ecology. Better awareness of these effects is an important step towards improved multi-sectoral and spatiotemporal drought management, including re-distribution of risks and benefits between upstream and downstream users [64], sectors, and socio-economic and environmental impacts.
Acknowledgments
This collection of case studies has been a community effort of the IAHS Panta Rhei working group 'Drought in the Anthropocene'. We thank all data providers and MSc and BSc students who supported part of the data collection and analysis of specific cases. The paper benefitted from discussion with numerous colleagues over several years. This research supports the work of UNESCO EURO FRIEND-Water and the IAHS Panta Rhei programs.
Data for case 4 Starohorský potok were provided by Slovak Hydrometerorological Institute. Data for case 7 Upper-Guardiana were provided by the Guadiana Water Authority. Data for case 12 Fiumicello were provided by RomagnaAcque-Società delle Fonti. Data for cases 16 Svitava and 17 Bílina were provided by L Kašpárek (WRI, Czech Republic). Data for case 19 Banabuiú were provided by the Foundation of Meteorology and Water Resources of Ceará (FUNCEME). F Hendricks (EDF R&D) and E Sauquet (INRAE, RiverLy) provided background information for case 20 Ariège.
SR and AVL were supported by NWO Rubicon (2004/08338/ALW). AVL receives funding from the European Research Council project PerfectSTORM (ERC-2020-StG 948601). HVL is supported by the EU-funded ANYWHERE project (Grant Agreement No. 700099). NW was supported by NWO Rubicon 825.15.003 and NWO 016.Veni.181.049. GDB was partly funded by the European Research Council (Consolidator Grant, HydroSocialExtremes project n. 771678).
Data availability statement
The data that support the findings of this study are openly available at the following URL/DOI: https://doi.org/10.17026/dans-z8p-ubuy. Data will be available from 01 April 2022.