
Abstract
Mariculture (marine aquaculture) generates nutrient waste either through the excretion by the reared organisms, or through direct enrichment by, or remineralization of, externally applied feed inputs. Importantly, the waste from fish or shellfish cannot easily be managed, as most is in dissolved form and released directly to the aquatic environment. The release of dissolved and particulate nutrients by intensive mariculture results in increasing nutrient loads (finfish and crustaceans), and changes in nutrient stoichiometry (all mariculture types). Based on different scenarios, we project that nutrients from mariculture will increase up to six fold by 2050 with exceedance of the nutrient assimilative capacity in parts of the world where mariculture growth is already rapid. Increasing nutrient loads and altered nutrient forms (increased availability of reduced relative to oxidized forms of nitrogen) and/or stoichiometric proportions (altered nitrogen:phosphorus ratios) may promote an increase in harmful algal blooms (HABs) either directly or via stimulation of algae on which mixotrophic HABs may feed. HABs can kill or intoxicate the mariculture product with severe economic losses, and can increase risks to human health.
Export citation and abstract BibTeX RIS

Content from this work may be used under the terms of the Creative Commons Attribution 3.0 licence. Any further distribution of this work must maintain attribution to the author(s) and the title of the work, journal citation and DOI.
World maricultural production has rapidly increased in recent decades (figure 1), while fish supply from capture fisheries has been relatively stable (FAO 2013). Hence, increases in fish production have come, and will increasingly come, from aquaculture systems. The contribution of aquaculture to global fish supply increased from 4% in 1970 to 25% in 2000 and to 40% in 2010. Over 70% of this production is in developing countries, mostly in Asia (FAO 2013).
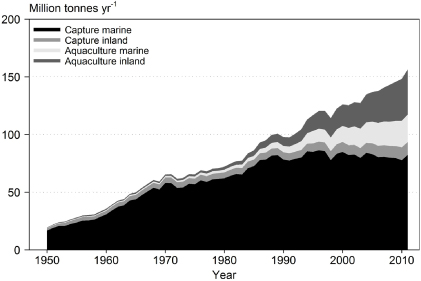
Figure 1. Global fish production from freshwater and marine capture and aquaculture for 1950–2011 (FAO 2013). Fish aquaculture is all aquaculture production excluding aquatic plants.
Download figure:
Standard image High-resolution imageGlobal mariculture production is now ca. 40% of total aquaculture production, and in the most recent years, ca. 75% of mariculture is shellfish production; the remainder is finfish, including high-value marine and brackish water species (e.g., salmon, bream) in intensive farming systems in cages and net pens (FAO 2013). Shellfish includes two categories, crustaceans (29% of total shellfish, e.g. prawn, lobster) and molluscs (71%, e.g. mussel, oyster, abalone). In 2010, 60% of global crustacean and 98% molluscan production was in marine or brackish water culture.
Finfish and crustacean mariculture are reared in intensive and semi-intensive systems, mostly cages and ponds with nearly 100% exogenous feed (Thongrod 2007). By contrast, molluscs are grown in open systems, such as rafts in the case of mussels, and obtain their food by filtration of natural plankton (figure 2). All intensive culture systems alter the natural cycling of nutrients, with increased release of dissolved nutrient and solid excreta compared to natural environments, as well as potential alterations of sediment biogeochemistry (Honkanen and Helminen 2000, Smaal 1991, Wu et al 1994). Efficiency of nutrient retention by the reared organisms is, on average, <35%. In systems with exogenous feed, there is also breakdown of undigested feed. Estimates of dissolved and particulate nitrogen (N) and phosphorus (P) release, calculated based on a model (see SI available at stacks.iop.org/ERL/8/044026/mmedia) accounting for major feed and nutrient inputs, feed conversion ratios, nutrient assimilation efficiencies by species for molluscs and digestibility for finfish, and nutrient removal by the harvest of mariculture product (Bouwman et al 2011, 2013) show considerable variability in the amounts and stoichiometric proportions of released nutrients in these different systems (figure 2). Dissolved nutrients are more nitrogen (N) rich, but particulate nutrients are more phosphorus (P) rich in finfish systems and crustacean ponds than molluscan culture (figure 2). Nutrient release products also vary from the value normally taken to be stoichiometrically favourable for algal growth, the Redfield ratio (N:P of 16:1 on a molar basis) (Redfield et al 1963). Further alterations of nutrient concentrations and stoichiometry result from fluxes of N and P from sediments to water due to remineralization of nutrients in excess feed, faeces or pseudofaeces (Smaal 1991).

Figure 2. Three types of mariculture and the associated N and P budgets in % of the intake (food or feed intake is 100%): top panel: mollusc production in raft systems; middle: finfish production in cages; and bottom: crustacean production in ponds. The relative proportion of nutrients relative to exogenous or natural inputs are estimated based on the models outlined in the SI (available at stacks.iop.org/ERL/8/044026/mmedia). The complement of the retention of nutrients in finfish (36% for N and 33% for P in salmon and rainbow trout), molluscan (33% for N and 22% for P) and crustacean production (25% for N and 10% for P) is released to the water columns. The proportion of nutrients in dissolved versus solid form depends on the digestibility of the food or feed. The larger the digestible fraction of a nutrient in the various food or feed ingredients, the larger the fraction in dissolved form.
Download figure:
Standard image High-resolution imageHere we demonstrate the impact of changing nutrient loads from mariculture of contrasting types and in different stages of development and we project the impact of future changes for three global regions and we describe the potential implications of these trends. We highlight the period from 2000 to 2010 for the world, as well as regionally for China (concentrations of shellfish and finfish production sites in estuaries and tidal systems), Chile (primarily finfish production in fjords) and Mexico (crustacean production in early development). Input data were taken from the yearly production statistics per species (FAO 2013). In the case of Chile, production was allocated to fjords located between 41°25'S and 45°45'S based on coastal typology (Dürr et al 2011), for China, provincial production data (China Ministry of Agriculture Bureau of Fisheries 2007) were used, and for Mexico, data for Pacific Ocean and Gulf of Mexico (FAO 2013) were used. For each system, nutrient loads resulting from mariculture were compared with river nutrient input to coastal seas for the same provinces or areas. Future changes for the year 2050 were estimated using the Millennium Ecosystem Assessment business-as-usual scenario (Global Orchestration, GO) (Alcamo et al 2006) for nutrients from both mariculture (Bouwman et al 2011, 2013) and rivers (Seitzinger et al 2010) (see SI available at stacks.iop.org/ERL/8/044026/mmedia).
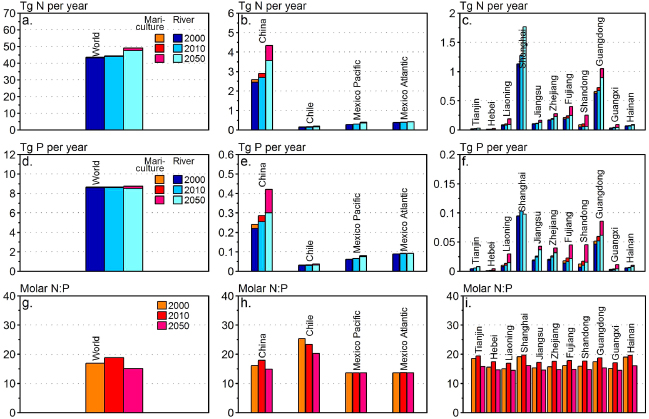
Global nutrient release by mariculture is only a fraction of nutrient inputs to coastal seas from rivers (figures 3(a) and (c)). In the period 2000–2010, nutrient release from all forms of mariculture in China collectively increased by 44% to 0.20 million tonnes of N, while estimated annual coastal N input from rivers increased by a 10% to 2.7 million tonnes of N (figure 3(a)). For P similar increases are seen. By 2010, Chinese mariculture thus contributed about 7% of total N and 11% of total P inputs to coastal seas overall, and 4% and 9% of dissolved N and P, respectively. Yet, in some provinces of China (Hebei, Lianoning, Shandong, Guangxi), the estimated contribution to dissolved nutrients by mariculture was far greater, exceeding 20% (figures 3(b) and (d)).
Figure 3. Release of nitrogen ((a)–(c)) and phosphorus ((d)–(f)) from mariculture production and river export for the world ((a), (d)), China, Chile and Mexico ((b), (e)) and the coastal provinces of China ((c), (f)) for 2000, 2010 and for 2050 according to the Global Orchestration scenario (note that the scales of the vertical axis are different). The two bottom graphs show molar N:P ratio of the dissolved N and P release from mariculture for the world (g), China, Chile and Mexico (h) and coastal Chinese provinces (i).
Download figure:
Standard image High-resolution image
In Chile, nutrient release from mariculture increased by 27% in the period 2000–2010, attaining a contribution of 16% to total N and 18% to dissolved N inputs in 2010, and 13% and 28% to total and dissolved P, respectively. In contrast, in Mexico, where mariculture is still in its infancy, nutrient release by mariculture in 2010 was estimated to be <1% for total N and P (figures 3(a) and (c)). Projected changes in dissolved nutrient release from mariculture from the period 2010–2050 suggest far greater increases when parameters from the Millennium Ecosystem GO scenario are considered: three–five fold in China, three–six fold in Mexico and 20–70% in Chile (figures 3(a)–(d)).
Although shellfish production represents the majority of total mariculture production by gross tonnage, globally, the major nutrient impact from mariculture is due to finfish (Bouwman et al 2013, 2011). Of the different mariculture types, finfish produce disproportionately more dissolved N (figure 2). Expectedly, then, due to the regional differences in mariculture development, the various types of mariculture contribute differentially to nutrient release. In Chile, with its dominance of finfish production, about 91% of N and 83% of dissolved P release comes from high-value finfish. Shellfish contributes 54% to total dissolved N and 61% to total dissolved P release from mariculture in China. In Mexico, similarly, most of the nutrients released are primarily associated with shellfish and crustaceans ponds in the Pacific.
These results demonstrate not only the current impact, but also the potential for future impacts in nutrient loads associated with aqueous animal production. One of the important implications of these changes in nutrient loads with mariculture is that not only may the assimilative capacity for nutrients in the environment be exceeded, leading to the development of hypoxia (e.g. Honkanen and Helminen 2000), but due to changes in nutrient quality, mariculture systems may create reinforcing negative feedbacks leading to promotion of nutrient environments which may favour harmful algal blooms (HABs) (e.g., Furuya et al 2010). HABs are those microbes that can kill or intoxicate the mariculture product, with resulting severe economic losses, and/or can increase risks to human health because the toxins can accumulate in the animals and result in contaminated seafood for human consumers (Backer and McGillicuddy 2006).
Relationships between increasing prevalence of HABs and aquaculture operations are increasingly reported with associated economic impacts (Furuya et al 2010). In China, for example, about $2.5 million of finfish were lost in 2005 due to one HAB event (Li et al 2009). Single HAB fish-kill events in Korea have been estimated to have cost from $1 to 100 million in lost fish, while in Japan such events have been estimated to have resulted in losses of fish worth more than $300 million (Furuya et al 2010).
Toxic and fish-killing algae are commonly associated with finfish and molluscan production (Wu et al 1994, Honkanen and Helminen 2000, Wang et al 2008, Furuya et al 2010), while high biomass bloom-forming algae are more commonly associated with pond production (Alonso-Rodríguez and Páez-Osuna 2003, Wang et al 2008, Azanza et al 2005). The different release products, forms, and proportions in different mariculture conditions may contribute to the different types of algae that proliferate in these differing environments due to the differing nutrient preferences of different algal functional groups (e.g. Heisler et al 2008). Of particular concern in both shellfish and finfish mariculture is the change in form of nutrients as a result of excretion and associated microbial remineralization. Between 7 and 12% of the dissolved N waste of finfish consists of urea, the remainder being ammonia (Kaushik and Cowey 1991). There is mounting evidence that reduced N forms (in contrast to oxidized N forms), including urea, differentially stimulate the growth of some types of HABs (Anderson et al 2002, Berg et al 2003, Glibert et al 2005b) or may fuel the production of algae on which mixotrophic HABs may feed (Heisler et al 2008, Flynn et al 2013). The relationship between alteration in nutrient composition, not just total quantity, and the development of HABs is supported by examples from freshwater, estuarine and marine waters globally (reviewed by Heisler et al 2008, Anderson et al 2002, Glibert and Burkholder 2006). Of additional concern is the fact that some HAB species are disproportionately more toxic under conditions of increasing N:P stoichiometry, as is the case in finfish and crustacean culture, even when other symptoms of high biomass accumulation, such as hypoxia, are not present (Granéli and Flynn 2006, Sun et al 2011, Fu et al 2012). The extent to which HABs may or may not be associated with specific mariculture operations depends on the intensity of the culture operation and the overall husbandry practices as well as the extent to which the receiving waters are retentive or well flushed (e.g. Honkanen and Helminen 2000, Glibert et al 2005a).
Importantly, these results bring into question the long-held notion that molluscan production is favourable under all conditions and intensity of culture for eutrophication control because of the natural water cleaning properties of these organisms (Shumway et al 2003). Rather, in intensive production, molluscs can become point sources of regenerated nutrients. Because of the low assimilation efficiency, molluscs can act as pumps in coastal seas transforming the nutrients in algal biomass to dissolved and particulate detrital nutrients; finfish and crustacea similarly act as pumps but with exogenous feed. Nutrient pollution from finfish and crustacean mariculture is higher than from molluscan culture, but nutrient release from molluscs nevertheless can locally be large. Nutrient efficiency, especially for molluscs, is unlikely to be increased in the future, because, unlike fish or crustaceans with more constrained diets, there are few management options to improve this efficiency by diet modification. In all cases, the magnitude of the effect of contribution of the regenerated nutrients to coastal eutrophication and to the potential for alterations in microbial biodiversity will depend on the intensity of culture, feeding practices (in the cases of finfish and crustacean culture), and on the physical dynamics of the receiving waters.
To minimize further eutrophication and nutrient effects from these rapidly expanding mariculture sources, options are few and costs high. Production may have to be moved offshore into deeper waters, developed in parts of the world with more favourable flushing (Feng et al 2004), or, where conditions allow, integrated with growth of aquatic plants, where plants absorb the excess nutrients (Soto 2009). Alternatively, systems may have to operate with fallow periods during times of year that may synergistically favour HABs or feed rates may have to be reduced, leading to lower production yields overall. Such trade-offs may be necessary to avoid catastrophic economic losses and further ecosystem degradation from mariculture effluent.
Acknowledgments
The work presented here is part of Work Group 132 'Land-based Nutrient Pollution and the Relationship to Harmful Algal Blooms in Coastal Marine Systems' of the Scientific Committee on Oceanic Research and the IGBP core project Land–Ocean Interactions in the Coastal Zone (SCOR/LOICZ). This is contribution number 4821 from the University of Maryland Center for Environmental Science. The authors thank Jane Hawkey (University of Maryland Center for Environmental Science) for preparing figure 2.