
Abstract
This study systematically evaluates simulations of near-surface temperature and precipitation using the station observations collected in the semi-arid region of China during the Coordinated Enhanced Observing Period (CEOP) from October 2002 to December 2004 (EOP3 and EOP4). The outputs being evaluated are from eight general circulation models (GCMs) archived by the Coordinated Energy and Water Cycle Observations Project (CEOP), as well as a multi-model ensemble based on these eight models. We find that the multi-model ensemble has a better performance than most of the individual models. Our results show that all individual models and the Model Analysis Comparison (MAC) ensemble mean perform much better when simulating regionally averaged temperature than precipitation. For most models, a systematically low bias is identified in the regionally averaged simulated temperatures, while a high bias exists in the simulated precipitation except in summer. For the simulated temperatures, the lowest and largest rRMSE are found in JMA and BMRC, respectively. Furthermore, temperature is always overestimated when it is between − 18 and − 10 °C, while the temperature is underestimated when it is greater than 6 °C; the best performance lies between − 10 and 2 °C for all the models except BMRC. For the simulated precipitation, excessive rainfall is reproduced at all intervals except in ECPC-SFM, and the largest deviation is identified at the interval of 2–5 mm with a bias of 18.3%. With respect to sub-regions, the simulated temperatures are better in eastern China, but the simulated precipitation is better in the transition zone from the semi-arid region to the arid region. However, the simulation bias increases west of 100°E, which may be associated with the complex and steep topography there. We want to stress that the MAC ensemble mean is superior to any individual models.
Export citation and abstract BibTeX RIS
1. Introduction
Diagnosing model errors by comparing model outputs with observations is the basis for improving key physical processes in any general circulation model (GCM) [1]. With the development of remote sensing, researchers are focusing on studying systematic energy exchange processes using multiple (and combined) research approaches, including observations, analyses and theories.
The Coordinated Enhanced Observing Period (CEOP) [2], established in 2001 by the World Climate Research Programme's (WCRP's) Global Energy and Water Cycle Experiment (GEWEX), was motivated by international efforts. It focused on measuring, understanding and modeling the water and energy cycles within the climate system. The purpose of the CEOP is to coordinate the Continental Scale Experiments (CSEs), satellite data, model simulations, and data analyses over a fixed period to provide data in support of the Hydrometeorology Panel's goals. The coordination effort also extends to science objectives, and the data collected must support the science. In the CEOP project, 200 km snapshots of the highest resolution raw radiance remote sensing data at the 36 in situ reference sites are now being archived. In conjunction with the in situ and remote sensing observations, international operational numerical weather prediction (NWP) centers are also archiving both analysis/assimilation and short-term forecast/analysis model products from both global and regional NWP suites [3]. The CEOP carried out concurrent observations and operational analyses for the Enhanced Observing Period (EOP3 and EOP4) from October 2002 to December 2004, which enables us to quantify the uncertainty of data and detect model deficiencies at global and regional scales. Comparison between CEOP MOLTS (Model Output Location Time Series) and the in situ observations has been conducted with the goal of improving representations of the key physical processes in the model [4–7]. Studies have shown that most climate models underestimate the variation of daily temperature and have poor ability in simulating precipitation (namely, with high systematic biases), and that model simulation biases change with the underlying surface, with the largest bias in the tropical oceans [8–11]. As for the dry period at the Rondonia CEOP reference site in Brazil, the CPTEC (Centro de Previsão de Tempo e Estudos Climáticos) model always overestimates precipitation, while the meso-scale Eta Model always overestimates near-surface temperature [12]. Though the comparison showed seasonality, where the members of the ensemble exhibit generally more skills during winter, there were notably higher skills for the summer basin-scale precipitation by the ensemble over the Mississippi River Basin [13]. Furthermore, the CEOP datasets are highly valuable in evaluating NWP models [14], and the need of univariate assimilation of surface temperature observations on surface energy budget is necessary for multivariate land data assimilation [15]. Requests were sent to many NWP centers for model data archive, but each of the global models contributing to the CEOP has its own grid, frequency and variable list. The CEOP is developing an ensemble global Model Analysis Comparison (MAC), in order to homogenize the data file, to provide a unified spatio-temporal grid of the analyses, and to use as many of the most common variables as possible to facilitate comparisons among the analyses and observational data [16].
Arid and semi-arid regions account for about 40% of the Chinese territory, and the aridity trend in North China is one of the most challenging research topics in the study of global change and regional response [17, 18]. In the process of the aridity trend, the semi-arid region, as a transition zone between a semi-humid region and arid region, is extremely sensitive to climate change and land use [19–21]. During the past 50 years, a periodic variation of arid and semi-arid boundaries is found in terms of their locations in the middle of Northeast China and central northern China, while an obvious aridity trend moves both eastwards and southwards [22]. Results from the Regional Model Inter-comparison Project of Asia (RMIP) show that the highest bias of simulated precipitation in current climate models is located over the semi-arid region [23]. In order to improve the simulation ability of current climate models over the semi-arid region of China, Fu and his colleagues proposed the CEOP/Semi-arid Region Study, which became one of the components of CEOP phase II (2006–10) [24].
Comparisons between the field observations undertaken at Tongyu CEOP reference site in China and model outputs from 2003 to 2004 have been implemented. The results show that the multi-model ensemble exhibits better results overall, and that the deficiency in simulating surface heat fluxes may be closely related to the biases in simulated precipitation [25]. However, our understanding of the land-surface processes in the semi-arid region is far from satisfactory in comparison with that in humid and semi-humid regions.
Based on the available high temporal resolution of CEOP for the period from January 2003 to December 2004, air temperature and precipitation variations at daily, monthly and seasonal time scales could be assessed by comparing individual CEOP MOLTS (Model Output Location Time Series) and the multi-model ensemble against the in situ observations. This will help to detect model deficiencies at a regional scale.
2. Data and methodology
This study uses the following data sets.
- (1)The precipitation data of 160 Chinese meteorological stations during 1951–2009 is obtained from the National Climate Center of China. This dataset is used to obtain annual-mean precipitation for the division of semi-arid region of China.
- (2)The model outputs come from seven international NWP and data assimilation centers, except for the ECPC (Experimental Climate Prediction Center), which is a research institution. The contributing centers are* Bureau of Meteorology Research Centre (BMRC [26]; Australia).* Centro de Previsão de Tempo e Estudos Climáticos (The Center for Weather Forecasts Climate Studies) (CPTEC [12]; Brazil).* Experimental Climate Prediction Center (ECPC)-Reanalysis II (RII; USA) and Seasonal Forecast (SFM [27]; USA).* Japan Meteorological Agency (JMA [6]; Japan).* Meteorological Services of Canada (MSC [28]; Canada).* National for Environmental Prediction (NCEP [29] ; USA).* The Met Office (UKMO [11]; United Kingdom). Table 1 shows the spatial resolution and grid structure of the data in the CEOP archive as well as the variable descriptions used in this study. Each center provided various analyses or forecast time series data. As a rule, the data closest to the analysis provided by each center (either the analysis or the nearest forecast data) is used for that center's time series for this comparison. The original structure of the model data from the NWP centers participating in the CEOP is archived by the Model and Data group at the Max Planck Institute (MPI) for Meteorology in Hamburg, Germany. The final data includes eight different analyses located at the same time with a consistent grid of 1.25°× 1.25°, and ensemble mean and variance of the members at 6-hourly, daily, and monthly frequencies for the period of October 2002 to December 2004. The minimum forecast time typically available was the analysis (0 h forecast) for the instantaneous variables and the 0–6-hourly forecast for the average/accumulation (ave/acc) variables. The forecast models for temperature simulations are CPTEC, ECPC-RII, ECPC-SFM, and NCEP, while for precipitation they are CPTEC, JMA and MSC. For MSC data, the instantaneous temperature is at 1200 UTC an analysis/0 h forecast, at 1800 UTC a 6 h forecast, at 0000 UTC a 12 h forecast and at 0600 UTC an 18 h forecast. Taking CPTEC as an example, the modeled temperature and precipitation is a 12 h forecast at 0000 UTC, an 18 h forecast at 0600 UTC, a 24 h forecast at 1200 UTC, and a 36 h forecast at 1800 UTC. Similarly, the ave and acc variables from 0000 to 0600 UTC are a 12–18-hourly forecast, and so on. For further details, one is referred to the paper by Bosilovich and his colleagues [16]. Because the target area covers the region (85°E–125°E, 25°N–55°N) with various types of land surface, it is hard to separate the specific features of the land surface that influenced the analysis and to what extent they did. It is worth noting that there is no explicit vegetation considered in BMRC.
- (3)In situ observations are derived from 463 meteorological observatories in China (of primary interest are the 42 meteorological observatories in semi-arid regions), including daily mean temperature and daily mean precipitation from 2003 to 2004. Each model output listed in table 1 is compared with these observations for resultant error analyses. It is worth noting that datasets (3) and (1) are different, because of (a) the different time scales and (b) a dense station distribution would make analysis more precise.
Table 1. Grid spacing (at surface) of individual NWPC model outputs as archived at MPI, showing the number of points (X × Y) and variable description. (Abbreviations are defined as follows: forecast (fcst), average (ave), accumulation (acc), and analysis (anl).)
| Description | Surface points | Surface resolution | Temperature | Precipitation |
|---|---|---|---|---|
| BMRC | 480 × 240 | 0.75 ×∼ 0.75 | Analysis | 0–6 h ave |
| CPTEC | 384 × 192 | 0.9375 × 0.9375 | 12 h fcst+ | 12 h fcst+ |
| ECPC-RII | 192 × 94 | 1.875 ×∼ 1.915 | 6 h fcst | 0–6 h ave |
| ECPC-SFM | 192 × 94 | 1.875 ×∼ 1.915 | 6 h fcst | 0-6 h ave |
| JMA | 640 × 320 | 0.5625 × 0.5625 | Analysis | 6 h fcst |
| MSC | 800 × 600 | 0.45 × 0.30 | anl/6 h fcst+ | 3 h fcst+ |
| NCEP | 360 × 181 | 1.0 × 1.0 | 6 h fcst | 0–6 h ave |
| UKMO | 288 × 145 | 1.25 × 1.25 | Analysis | 0–6 h acc |
We define the regions with annual-mean precipitation ranging from 200–400 mm, based on the National Climate Center annual-mean precipitation data from 1951 to 2009, as a transition zone, spanning from the southwest to the northeast. Forty-two meteorological observatories have been selected as the most significant sites after removing those that are located on the boundary of the transition zone. We consider the value from the model grid that is the nearest to the meteorological observatory as its in situ counterpart. For the purpose of inter-comparison, we analyze the distribution of annual precipitation from 1971 to 2000. The distribution derived from this period is in agreement with figure 1, except there is one additional observatory (Station Hohhot). We also downloaded MCD12C1 with a spatial resolution of 0.05° from the internet, which provides the dominant land-cover type and the sub-grid frequency distribution of land-cover classes.
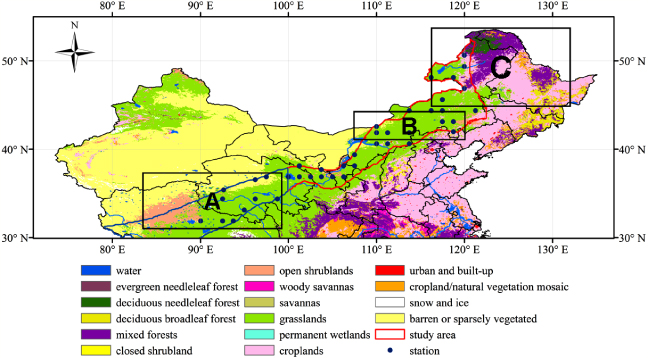
Figure 1. Distribution of observation sites in the semi-arid region of China (A) Tibetan Plateau; (B) Inner Mongolian Plateau; (C) the Northeast Plain.
Download figure:
Standard image
Figure 2. The rRMSE of daily mean (a) temperature and (b) precipitation from each GCM simulation (including the MAC) and observations over the semi-arid region of China.
Download figure:
Standard imageFocusing on the target region defined above, the ability of the CEOP models in simulating near-surface temperature and precipitation in terms of biases between each GCM and observations, rRMSE (relative Root Mean Square Error), frequency distribution and correlation coefficients at daily, monthly and seasonal time scales and their spatial distributions are evaluated in sections 3 and 4. The rRMSE is chosen to evaluate the accuracy of model prediction, and is defined as [30]
When calculating the rRMSEs, the units are K and mm for temperature and precipitation respectively. In addition, the MAC ensemble mean is analyzed as if it were an individual contributing member. Meanwhile, considering the uniqueness of the Tibetan Plateau, the model simulation ability over high-altitude regions to the west of 100°E is evaluated in section 5.
3. Regionally averaged temperature and precipitation in semi-arid region of China
In this section, regionally averaged data from the CEOP MOLTS and observations during the period Jan 2003–Dec 2004 are used to assess the near-surface temperature and precipitation in the models.
Annually and seasonally averaged biases of daily mean temperature and precipitation between CEOP MOLTS and observations for the period Jan 2003–Dec 2004 are shown in tables 2 and 3. The results indicate the near-surface temperature simulation is better than the precipitation simulation, which is consistent with other regional and global comparisons [31]. For the simulated temperatures, with the exception of the ECPC-SFM and JMA, which overestimate the observed temperatures in summer and winter, the models tend to underestimate temperature by about − 3 °C. The negative bias even reaches − 9 °C from April to July in BMRC. On a seasonal time scale, the simulated temperatures are the closest to the observed data in summer, followed by autumn and winter, and the worst is spring. All of the models perform effectively in simulating annual-mean temperature, except for BMRC (table 2). Unlike the simulated near-surface temperatures, the simulated precipitation appears to be discontinuous and nonlinear, as presented in table 3. From May through September, modeled precipitation is much higher (lower) than the observed precipitation for ECPC-RII (JMA), and the biases for the other models are even larger. Moreover, it is obvious that all the models underestimate precipitation in summer and overestimate precipitation during the remaining seasons, except for ECPC-RII and JMA (figure 3). Concerning the annual time scale performance of individual models, MSC is the closest to the observations while BMRC and ECPC-RII perform very poorly. In addition, the MAC ensemble performs well, as its outputs are much more stable than most of the individual models at the seasonal time scale.
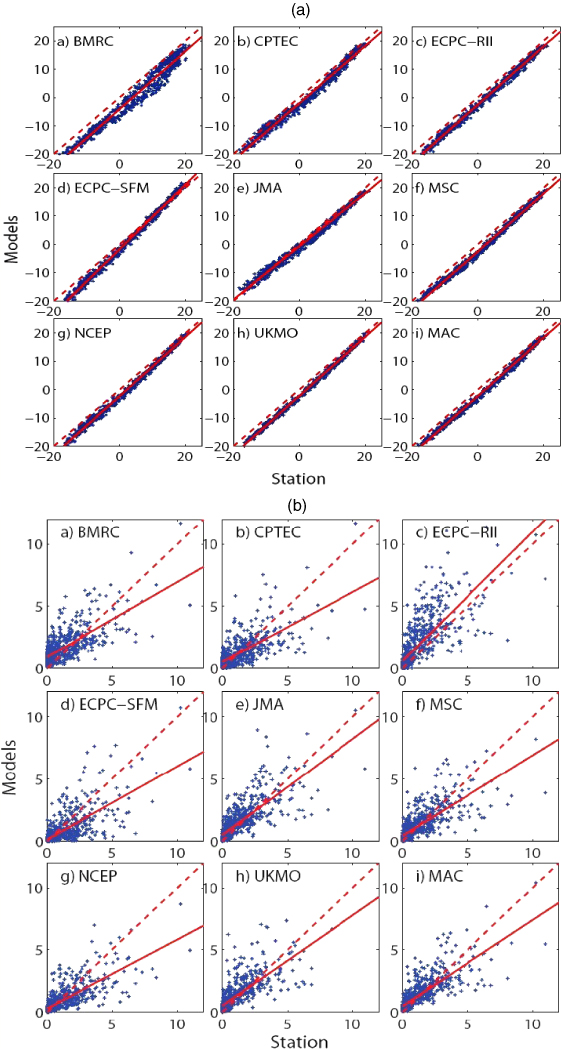
Figure 3. Scatter diagram of the two years' daily mean (a) temperature and (b) precipitation between each GCM simulation (including the MAC) and observations.
Download figure:
Standard imageTable 2. Daily mean differences (regionally averaged) of temperature between each GCM simulation (including the MAC) and observations in Jan 2003–Dec 2004 in the semi-arid region of China (units: °C).
| TMP | Annual | Spring | Summer | Autumn | Winter |
|---|---|---|---|---|---|
| BMRC | −3.81 | −6.15 | −2.87 | −2.31 | −3.90 |
| CPTEC | −1.88 | −2.79 | −0.99 | −2.49 | −1.28 |
| ECPC-RII | −2.27 | −2.90 | −1.68 | −2.11 | −2.39 |
| ECPC-SFM | −1.00 | −1.36 | 1.07 | −1.03 | −2.70 |
| JMA | −0.86 | −1.86 | −1.21 | −0.78 | 0.45 |
| MSC | −2.29 | −2.17 | −1.78 | −3.01 | −2.22 |
| NCEP | −1.98 | −2.38 | −1.18 | −2.24 | −2.13 |
| UKMO | −1.98 | −1.99 | −1.26 | −2.28 | −2.37 |
| MAC | −2.01 | −2.70 | −1.24 | −2.03 | −2.06 |
Table 3. Daily mean differences (regionally averaged) of precipitation between each GCM simulation (including the MAC) and observations in Jan 2003–Dec 2004 in the semi-arid region of China (units: mm).
| PRP | Annual | Spring | Summer | Autumn | Winter |
|---|---|---|---|---|---|
| BMRC | 0.48 | 0.59 | −0.13 | 0.51 | 0.97 |
| CPTEC | 0.02 | 0.08 | −0.57 | −0.001 | 0.59 |
| ECPC-RII | 0.61 | 0.52 | 1.36 | 0.49 | 0.06 |
| ECPC-SFM | −0.34 | −0.25 | −1.00 | −0.10 | 0.01 |
| JMA | 0.24 | 0.44 | 0.15 | 0.22 | 0.14 |
| MSC | 0.04 | 0.19 | −0.42 | 0.22 | 0.15 |
| NCEP | −0.17 | 0.09 | −0.82 | −0.07 | 0.12 |
| UKMO | −0.02 | 0.28 | −0.63 | 0.11 | 0.18 |
| MAC | 0.14 | 0.27 | −0.17 | 0.20 | 0.29 |
The rRMSE is employed to evaluate the accuracy of each contributing model; the MAC ensemble mean is also treated as a model. The rRMSEs of daily temperature and precipitation of all the GCMs (including the MAC ensemble) and observations are shown in figure 2. The rRMSEs of temperature are far less than 1.0, showing good accordance with the observations. Precipitation rRMSEs fluctuate around 1.0 or greater than 1.0, especially in winter, indicating the RMSE for each individual model is comparable to the magnitude of the observations (e.g., 1.0 mm day−1 annually, calculated using the observations); however, these results also reflect a deficiency in simulated precipitation. For the simulated temperatures, annual rRMSE is often higher than the seasonal one, which implies a limited ability to capture drastic changes in the transitional periods between two seasons. The rRMSE of UKMO is the smallest while those of BMRC and ECPC-RII are the highest, and the uncertainty is smallest in autumn and largest in winter for all models (figure 2(a)).
For the precipitation rRMSE, ECPC-RII ranks highest for all the seasons, as shown in figure 2(b). The largest RMSE of daily precipitation is in summer for all the GCMs, with a value as high as 1.67 for ECPC-RII, for example. Its rRMSE, however, is only 0.60. In winter, the RMSE and rRMSE are 0.15 and 1.50, respectively. In terms of rRMSE, BMRC, CPTEC and UKMO fail to simulate daily precipitation in winter, with the values of 4.2, 3.5 and 2.6, respectively. One of the explanations for the large rRMSEs of daily precipitation in winter is that the observed daily precipitation is quite low in the semi-arid region, with a simulated daily precipitation in winter of only 0.1 mm for ECPC-RII for example.
As a result, every contributing model shows large differences in terms of simulating the two variables, temperature and precipitation. Taking ECPC-RII as an example, it has the poorest simulation for temperature but the best prediction for precipitation. The higher accuracy of the MAC ensemble mean for the two variables indicates that the random or system-specific errors in the contributing members are minimized after taking their ensemble.
Figure 3 shows the scatter diagram of the daily time series during the two years. It seems quite remarkable that the temperature average is clustered more closely than the precipitation to the observations at daily time scale. The degree to which the temperature average is clustered more closely to the daily observations in comparison to the precipitation is striking. These graphics also show the model simulations tend to simulate heavier precipitation events inaccurately in comparison to the weaker events, which makes sense considering the models are at a large spatial scale and precipitation is a localized feature. As for the temperature, all simulations show systematic negative bias to the observations, with the largest bias found in BMRC. The good performance of each GCM model is nearly identical to the MAC ensemble at the daily time scale, and JMA is generally better than the other models; however, JMA is a reanalysis dataset, not a forecast dataset (BMRC and UKMO are two other reanalysis datasets, while MSC is the combination of analysis and forecast datasets). When considering precipitation, biases are apparent for both the models and the MAC ensemble: positive biases are apparent in ECPC-RII, JMA, MSC and UKMO simulations; and negative biases exist in BMRC, CPTEC, ECPC-SFM, NCEP and MAC ensemble, indicating individual models play a major role in the under-estimation by the MAC ensemble mean in terms of precipitation.
To further understand the performance of the models, correlations between each GCM (including the MAC ensemble) and observations are displayed in figure 4, with the statistic confidence level exceeding 99%. The fact that correlation coefficients are in excess of 0.85 for temperature but only oscillate between 0.3 and 0.8 for precipitation gives apparent evidence that there is a stronger temporal correlation for temperature than precipitation between the simulations and observations over the semi-arid region of China. One would expect forecast models to compare poorly than the reanalysis data, which is sometimes observed. The monthly temperature correlations to the observations show a uniform phase change, in which BMRC and CPTEC yield the lowest correlation. An outstanding problem is that all GCMs and the MAC ensemble have the lowest correlation coefficient in July, followed by that in December and January. The corresponding effect of this feature is the worse simulation in winter and summer, followed by spring and autumn. For example, the coefficients are 0.995, 0.978, 0.997 and 0.982 for the MAC ensemble for spring, summer, autumn and winter, respectively.
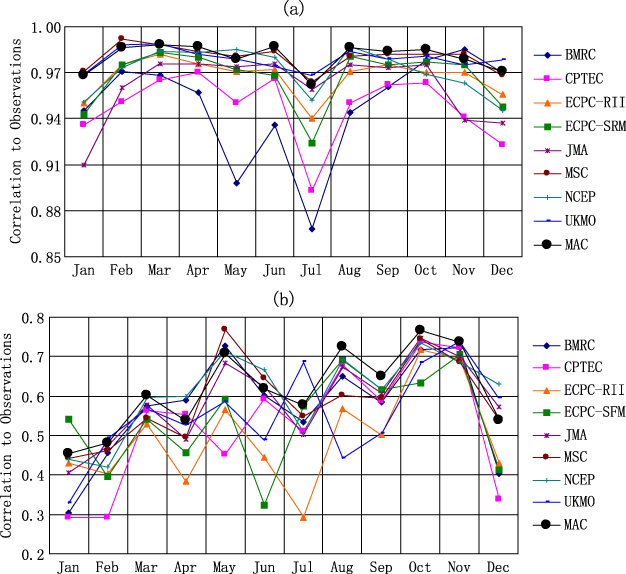
Figure 4. Correlations between each GCM simulation (including the MAC) and observations over the semi-arid region of China. (a) Temperature correlation over the semi-arid region. (b) Precipitation correlation over the semi-arid region.
Download figure:
Standard imageIn terms of precipitation, the phases of all the models and the MAC ensemble are not so consistent, and large biases occur in ECPC-RII and ECPC-SFM, while UKMO yields the opposite phase change to the others for summer. For the temperature, the minimum coefficients occur in January and February. Most models show better performance in summer, except for extremely low coefficients in July. The effect of this phenomenon is the strongest in winter simulations, followed by summer, and then by spring and autumn. For example, the coefficients are 0.72, 0.68, 0.78 and 0.49 for the MAC ensemble mean for spring, summer, autumn and winter, respectively.
Knowing where the smallest bias of frequency lies is essential, as it may provide some clues to improve simulation. So, the frequency distribution of daily mean temperature and precipitation are analyzed in figure 5. Quite unexpectedly, the distribution of daily mean temperature is not well in accordance with the normal distribution in the semi-arid region of China, where the largest frequency ranges from 2 to 14 °C. The overestimated percentage of frequency displays in the range from − 18 to − 10 °C, while underestimated values lie where the temperature is warmer than 6 °C. All the models are capable of simulating temperature better when it lies between − 10 and 2 °C, with a bias of less than 2% except for BMRC, implying the best performance is in spring and autumn. The MAC ensemble mean ranks the best around all frequency intervals, except for the over-estimation between − 20 and − 6 °C and under-estimation between 8 and 18 °C.
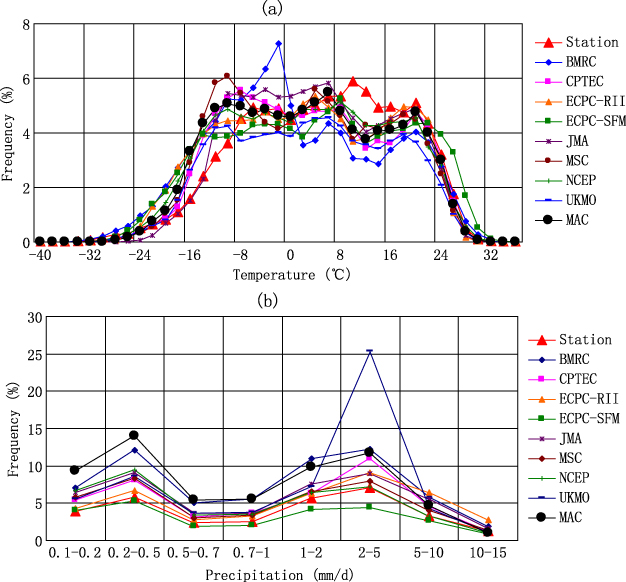
Figure 5. Frequency distribution of daily mean (a) temperature and (b) precipitation.
Download figure:
Standard imageWe thus restrict our attention to the precipitation. About 7% of the rainfall in the semi-arid region of China is at the level of 2–5 mm, while 5.8% and 5.6% is in the ranges of 0.2–0.5 mm and 1–2 mm, respectively. All the GCMs, as well as the MAC, reproduce distinct excessive rainfally, except for ECPC-SFM. The worst performance is obtained at the interval of 2–5 mm, with the relative frequency bias of 18.3%, followed by that of 0.1–0.2 mm and 0.2–0.5 mm. The deviations of relative frequency are identified to be the smallest in CPTEC and ECPC-RII, and the largest in BMRC and the MAC ensemble around all intervals. The obvious disagreement of the MAC ensemble mean in simulating temperature and precipitation can be attributed to the accumulation of the consistent positive biases of all the individual CEOP models in precipitation, except for ECPC-SFM.
Figure 6 shows the regionally averaged monthly mean temperature and precipitation in Jan 2003–Dec 2004. Excellent consistency between simulated temperature and the observations can be seen in figure 6(a), apart from the significant biases in BMRC. The simulated temperature is 4 °C warmer than the observed for JMA, 2–6 °C lower for BMRC, and about 2 °C lower for the remaining models. For the simulated precipitation, consistencies of maps in figure 6(b) turn out to be lower than those in figure 6(a). Taking the year 2003 as an example, most GCMs can capture the maximum rainfall in July, while the simulated peak is delayed to August in ECPC-SFM. The MAC ensemble is the best, followed by UKMO. ECPC-RII performs the worst, with the largest positive bias of 60 mm/month; in contrast, ECPC-SFM has the largest negative bias of − 40 mm/month.
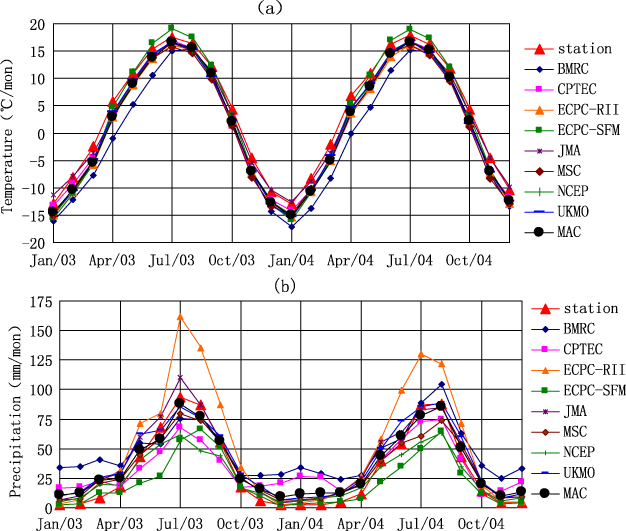
Figure 6. Comparisons of regionally averaged monthly mean (a) temperature and (b) precipitation in the semi-arid region of China during Jan 2003–Dec 2004.
Download figure:
Standard image4. Spatial distribution of temperature and precipitation in the semi-arid region
Many studies have been conducted for validation of the numerical models' capability in simulating meteorological variables in China. Shi et al [32] have concluded that model performances in the low-latitude region are better than in the mid- and high-latitude regions. Liu et al [33] noted that simulated temperatures are systematically lower than the observations, though the simulated temperatures are better in eastern China than in western China.
As analyzed in section 3, the MAC ensemble mean has higher ability than any individual contributing member. So, due to limited space, the MAC ensemble is selected as an example to analyze the spatial structures of both temperature and precipitation in terms of deviation, correlation and stability. Figure 7 shows the spatial distribution of observed temperatures, the MAC ensemble mean, deviations between simulation (namely, the MAC) and observations, and correlation coefficients in the semi-arid region of China. The observed temperature is highest in the central semi-arid region and lower in the north, north central and southwestern parts of the semi-arid region, while the lowest temperature, found in the southwest, is under the influence of the Tibetan Plateau. This feature is also illustrated in figure 3, namely, all the GCMs tend to simulate considerably colder air than the observations over the whole semi-arid region of China (figure 7(b)). Among all the models, the bias from BMRC is the largest, at − 16 °C, while the biases of the other models are at about − 6 °C. There is a negative bias center located in the Tibetan Plateau, indicating all the GCMs still have larger uncertainties in the plateau regions. For the spatial correlation, all the models can reasonably capture the temperature distribution in the semi-arid region of China, with all correlation coefficients exceeding 0.85, though BMRC is somewhat worse than the others. The simulation is better in the northeast than in the southwest, with two minimum correlation coefficient centers located in the Tibetan Plateau as well as the junction of the Mongolian Plateau and the Northeast Plain.
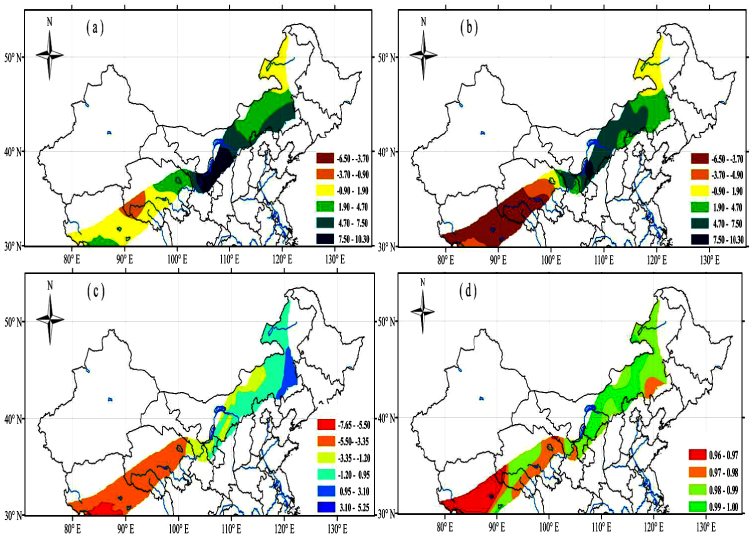
Figure 7. Spatial distribution of temperature: (a) observation, (b) MAC ensemble mean, (c) bias between simulations and observations, (d) correlation coefficients in the semi-arid region of China.
Download figure:
Standard imageFigure 8 is the same as figure 7, except for precipitation, indicating that all the GCMs (including the MAC ensemble mean) provide inferior simulations of precipitation. Most models can, however, successfully reproduce the gradually increasing precipitation distribution from northwest to southeast over the semi-arid region of China. Extremely low precipitation is evident near the Qilian Mountains, as observed, but both BMRC and CPTEC show extremely high values in contrast. Regional biases are still apparent, though their intensities are less, for example, over the middle and southwestern parts of this region, especially in the Tibetan Plateau, which may be caused by the sparse observations as well as the sensitive underlying land surface. The correlation coefficient between each simulation and the observations is almost less than 0.65, and displays an acute change. The distribution of correlation coefficient is similar to the bias distribution, and the coefficient in the transition zone from the semi-humid region to the semi-arid region is significantly smaller than the center of the whole semi-arid region of China and the transition zone from the semi-arid region to the arid region of China. Precipitation has the largest bias over the Tibetan Plateau and the transition region of the Daxing'an Mountain Range and the Northeast Plain, while the smallest bias appears over the middle of the Hetao Region (a region in the upper reaches of the Yellow River in Northwestern China, which includes plains and plateaus on both sides of the Yellow River) and the Mongolian Plateau, with all correlation coefficients exceeding 0.55.
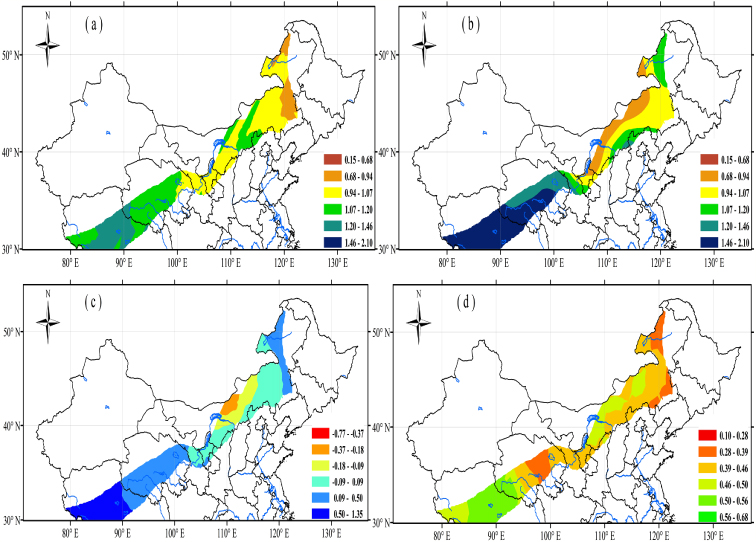
Figure 8. Same as figure 7, except for precipitation.
Download figure:
Standard image5. Regionally averaged temperature and precipitation in the Tibetan Plateau
Seeing the spatial distributions of temperature and precipitation in figures 7 and 8, the Tibetan Plateau region is selected for further assessment due to its largest biases. In this region, temperature is consistently underestimated by most of the individual CEOP models and the MAC ensemble, which is in agreement with the results of the whole semi-arid region (tables 4 and 5). A remarkable difference is that the simulated temperatures are significantly lower than the observations, with the exception of JMA and ECPC-SFM, which are higher during a few periods. The simulated temperature by BMRC exhibits larger fluctuations, with higher values during January to July than during the second half of the year. JMA also shows higher deviation than all the other individual GCMs throughout the year. The MAC ensemble performs the best in simulating temperature, rather than JMA. As for precipitation, the largest variability and model errors come from ECPC-RII and UKMO, which are either much higher or much lower than the observations. The errors in simulated precipitation are higher in the remaining models, with the greatest discrepancies from May to September. Concerning both the seasonal and annual time scales, the simulation capability of temperature is higher than that of precipitation. In consideration of the uncertainty, the MAC ensemble is better than most GCMs; BMRC, ECPC-RII and MSC are poor in simulating temperatures, while BMRC and ECPC-SFM are poor in simulating precipitation.
Table 4. Daily mean differences (regionally averaged) of temperature between each GCM simulation (including the MAC) and observations in Jan 2003–Dec 2004 over the Tibetan Plateau (units: °C).
| TMP | Annual | Spring | Summer | Autumn | Winter |
|---|---|---|---|---|---|
| BMRC | −8.44 | −10.39 | −8.11 | −6.42 | −8.83 |
| CPTEC | −4.65 | −5.95 | −3.77 | −4.88 | −4.00 |
| ECPC-RII | −6.53 | −7.23 | −5.38 | −6.65 | −6.88 |
| ECPC-SFM | −4.58 | −5.39 | −1.99 | −4.52 | −6.43 |
| JMA | −2.76 | −3.29 | −3.63 | −2.52 | −1.58 |
| MSC | −4.44 | −4.77 | −4.00 | −5.06 | −3.94 |
| NCEP | −4.69 | −4.94 | −2.86 | −5.32 | −5.66 |
| UKMO | −4.09 | −3.58 | −3.25 | −4.51 | −5.06 |
| MAC | −5.03 | −5.70 | −4.14 | −4.99 | −5.30 |
Table 5. Daily mean differences (regionally averaged) of precipitation between each GCM simulation (including the MAC) and observations in Jan 2003–Dec 2004 over the Tibetan Plateau (units: mm).
| PRP | Annual | Spring | Summer | Autumn | Winter |
|---|---|---|---|---|---|
| BMRC | 1.26 | 1.13 | 0.49 | 1.04 | 2.42 |
| CPTEC | 0.27 | 0.43 | −0.97 | 0.03 | 1.62 |
| ECPC-RII | 1.33 | 1.43 | 2.93 | 0.78 | 0.14 |
| ECPC-SFM | −0.03 | −0.05 | −0.25 | 0.15 | 0.04 |
| JMA | 0.66 | 1.24 | 0.76 | 0.39 | 0.24 |
| MSC | 0.59 | 0.84 | 0.29 | 0.95 | 0.29 |
| NCEP | −0.27 | 0.13 | −1.04 | −0.25 | 0.07 |
| UKMO | 0.56 | 0.86 | 0.67 | 0.40 | 0.29 |
| MAC | 0.53 | 0.74 | 0.32 | 0.42 | 0.64 |
The rRMSEs of temperature and precipitation are also calculated over the Tibetan Plateau (figure 9). According to the results above, all GCMs (including the MAC ensemble) show good agreement with temperature observations, but show deficiency in simulating precipitation, except that all the rRMSEs are higher than those over the semi-arid region of China. For temperature simulation, the lowest rRMSE is found in summer instead of autumn in the semi-arid region. Furthermore, as one might expect, the MAC ensemble mean has some advantage over all individual contributing members. For instance, the MAC has consistently low errors in both temperature and precipitation, and the lowest rRMSE precipitation value is found in summer and the highest in winter, which is in accordance with the semi-arid region. For all the simulations, ECPC-SFM has the most stable simulation capability, and the MAC ensemble mean holds the second place.
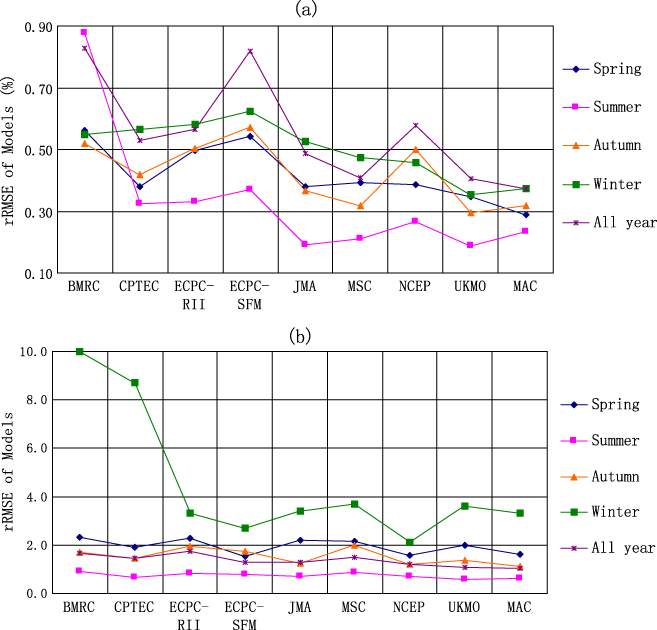
Figure 9. The rRMSE of daily mean (a) temperature and (b) precipitation from all the GCM models (including the MAC) and observations over the Tibetan Plateau.
Download figure:
Standard imageThe correlation features of temperature and precipitation at daily time scale over the Tibetan Plateau (figure 10) show no significant differences with those in figure 4, which is for the semi-arid region of China. All the CEOP models produce precipitation less accurately in the Tibetan Plateau than in the entire semi-arid region of China, with the maximum correlation coefficients of merely 0.49 and 0.82, respectively, for the MAC ensemble mean when simulating temperature and precipitation. The extremely low precipitation correlation between simulations and observations occurred in July over the semi-arid region and is delayed to August in the Tibetan Plateau. Unfortunately, the maximum correlation of BMRC, CPTEC and ECPC-SFM to the observations is less than 0.22. All the models are unable to adequately capture the rainfall during the whole year, especially in June and November, which likely results from sufficient and frequent solid-state precipitation (such as snow) at high-altitude locations. However, there are several months when UKMO precipitation correlation is higher than that of the MAC ensemble mean, followed by those of JMA and NCEP in the Tibetan Plateau.
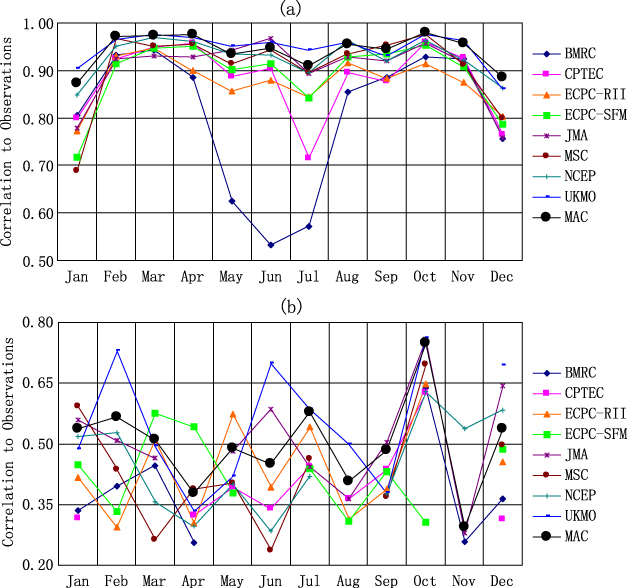
Figure 10. Correlations between each GCM simulation (including the MAC) and observations over the Tibetan Plateau. (a) Temperature correlation over Tibetan Plateau. (b) Precipitation correlation over Tibetan Plateau.
Download figure:
Standard imageFurther information on the sources of precipitation biases can be derived by analyzing the monthly averages of temperature and precipitation. Similar to section 3, regionally averaged monthly mean temperature and precipitation in the Tibetan Plateau from Jan 2003–Dec 2004 are shown in figure 11. All simulated temperatures have good agreement with the observations in terms of annual variation, with systematic negative biases around − 5 °C, except for BMRC. Precipitation does not compare as well. Taking year 2004 as an example, the simulated maximum rainfall months were earlier, in June by JMA and MSC, but were delayed to August by BMRC and ECPC-RII. The highest and lowest simulated biases in July 2004 are apparent in the models ECPC-RII and NCEP. Except for MSC, the other models can successfully capture the peak of precipitation in January 2004 though somehow higher than the observations, with the largest biases seen in BMRC and CPTEC. The extreme value simulated by the MAC ensemble mean is significantly higher, too, which is not consistent with the results over the whole semi-arid region, indicating that the systematic errors and biases from each individual model will persist into the ensemble average. The largest negative bias for precipitation is caused by ECPC-RII and BMRC, with the value of 80 mm/mon, while the negative bias is due to NCEP, with the value of − 40 mm/mon. The uncertainty in CPTEC ranges from − 60 mm/mon to 60 mm/mon.
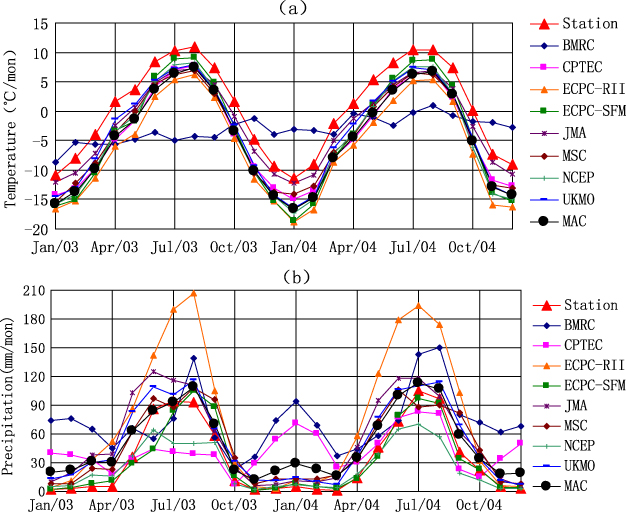
Figure 11. Comparison of regionally averaged monthly mean (a) temperature and (b) precipitation over the Tibetan Plateau region during Jan 2003–Dec 2004.
Download figure:
Standard imageA possible explanation of negative temperature bias over the semi-arid region, and in particular in the Tibetan Plateau, is that the observations are available mainly in valleys rather than over the mountains. Such observations cannot be interpolated in a simple linear manner over all the areas. More sophisticated interpolation that includes mean temperature change with height is necessary for comparison with model data. The mean MOLTS elevation over the Tibetan Plateau is about 4200 m, compared with the mean station elevation of 4038 m, which might be a source for the systematic difference when simulating temperature. A simple estimate of the contribution of the vertical air temperature gradient (DT/h ≈− 0.6 °C/100 m) caused by the elevation difference between simulation and observation could reach at least aprroximately − 1.0 °C. The distribution function of temperature errors confirms this (figure 5). Temperature error reaches its minimum between − 10 and 2 °C, where, probably, DT/Dz is not far from 0. For low temperatures from − 18 to 10 °C often DT/Dz > 0, and there is a positive bias, while for high temperatures above2 °C, namely DT/Dz < 0, a negative bias is found. One possible reason for excessive model precipitation can be incorrect interpolation of valley observations to the whole area.
6. Conclusions and discussion
Based on the observations in the semi-arid region of China and eight CEOP model outputs, a preliminary evaluation of prediction skills by the GCMs (as well as their multi-model ensemble) was carried out in terms of simulated temperature and precipitation at daily, monthly and seasonal time scales and their spatial distributions. A similar evaluation was also conducted in the Tibetan Plateau region. The results are as follows.
- 1.All the GCMs and the MAC ensemble are better at simulating temperature than precipitation. Most of the models show systematically lower temperatures in comparison to the observations, and higher precipitation throughout the year except in summer. The best performance in simulating temperature lies in the range between − 10° and 2° for all the models, except BMRC. The largest deviation in precipitation is identified at the interval between 2–5 mm, with a bias of 18.3%.
- 2.The simulated temperatures have a negative bias zone, located in the Tibetan Plateau. The simulation is better in East China than in West China, for both temperature and precipitation. The simulated precipitation is limited in the transition zone from the semi-humid region to the semi-arid region in comparison to the middle of the semi-arid region and in the transition zone from the semi-arid region to the arid region in China.
- 3.All the GCMs fail to simulate precipitation in the Tibetan Plateau, especially in winter. BMRC and ECPC-RII perform the worst in simulating both temperature and precipitation, while the MAC ensemble is superior to any individual GCM in the Tibetan Plateau.
This study is our first step to evaluate the prediction skills of the CEOP participating models, which provides useful clues to identify additional model deficiencies. Our next step will focus on longer time scale observations by taking into consideration the weight ratio of each prediction model in the multi-model ensemble.
Acknowledgments
Special thanks go to Dr Mike Bosilovich for providing the Multi-model Analyses for CEOP (MAC) which facilitated our work to a great degree. This study is jointly supported by the National Basic Research Program of China (grants 2011CB952002 and 2010CB428503), by the National Natural Science Foundation of China (grant Nos 40975049, 40830956 and 40810059003), and by a project funded by the Priority Academic Program Development of Jiangsu Higher Education Institutions. The authors also sincerely thank the editors and the anonymous reviewers for insightful comments on the manuscript and correction of some grammatical errors.