

Abstract
Changing hydro-climatic and socioeconomic conditions increasingly put pressure on fresh water resources and are expected to aggravate water scarcity conditions towards the future. Despite numerous calls for risk-based water scarcity assessments, a global-scale framework that includes UNISDR's definition of risk does not yet exist. This study provides a first step towards such a risk-based assessment, applying a Gamma distribution to estimate water scarcity conditions at the global scale under historic and future conditions, using multiple climate change and population growth scenarios. Our study highlights that water scarcity risk, expressed in terms of expected annual exposed population, increases given all future scenarios, up to >56.2% of the global population in 2080. Looking at the drivers of risk, we find that population growth outweigh the impacts of climate change at global and regional scales. Using a risk-based method to assess water scarcity, we show the results to be less sensitive than traditional water scarcity assessments to the use of fixed threshold to represent different levels of water scarcity. This becomes especially important when moving from global to local scales, whereby deviations increase up to 50% of estimated risk levels.
Export citation and abstract BibTeX RIS

Original content from this work may be used under the terms of the Creative Commons Attribution 3.0 licence. Any further distribution of this work must maintain attribution to the author(s) and the title of the work, journal citation and DOI.
1. Introduction
Water scarcity, the inability of water resources to meet water demands (Young 2005, Hanemann 2006, Rijsberman 2006), is considered to be one of the most important global risks for society (Howell 2013). Changes in hydro-climatic conditions and socioeconomic developments have led in recent decades to an aggravation of water scarcity conditions at global and regional scales (Alcamo et al 1997, Vörösmarty et al 2000, Kummu et al 2010, van Beek et al 2011, Wada et al 2011, van Vliet et al 2013, Veldkamp et al 2015b). Projected increases in human water demands due to changing lifestyles and a growing population, and projected changes in hydro-climatic conditions, are expected to increase both the probability of water scarcity events, as well as their societal impacts (Vörösmarty et al 2000, Stahl 2001, Lehner et al 2006, Alcamo et al 2007, Arnell et al 2011, 2013, Sperna Weiland et al 2012, Gosling and Arnell 2013, Hanasaki et al 2013, van Vliet et al 2013, Arnell and Lloyd-Hughes 2014, Haddeland et al 2014, Prudhomme et al 2014, Schewe et al 2014, Schlosser et al 2014, Wada et al 2014a, Kiguchi et al 2015).
To deal with the uncertainty of climate change and future socioeconomic conditions, and to express their impacts on society, risk-based approached need to be integrated in water management (Kundzewicz et al 2008, Döll et al 2015, UNISDR 2015). An important first step therein that is already covered by many studies is the use of multiple global circulation models (GCMs) or global hydrological models (GHMs) in the assessment of water resources availability, water scarcity, or hydrological extremes, not seldom in combination with multiple scenarios or pathways covering a wide range of potential future climatic and socioeconomic conditions (e.g. Vörösmarty et al 2000, Arnell 2004, Alcamo et al 2007, Arnell et al 2011, 2013, Döll and Schmied 2012, Crosbie et al 2013, Davie et al 2013, Gosling and Arnell 2013, Hanasaki et al 2013, Dankers et al 2014, Schewe et al 2014, Schlosser et al 2014, Wada et al 2014a, 2014b, Shen et al 2014, Kiguchi et al 2015). Presenting the full range of impacts in combination with a (weighted) ensemble-mean is a good way to deal with the probability of occurrence of a future state and its impacts (Döll et al 2015). However, it does not yet cover completely the 'hazard' in the UNISDR (2009) definition of risk in which the 'hazard' should be described quantitatively by 'the likely frequency of occurrence of different intensities' (UNISDR 2009), covering not only long-term mean states but also variability and extremes (IPCC 2012).
Risk assessment methods facilitate the inclusion of variability and provide insights in the severity, distribution, and impacts of both high and low probability events via the use of probabilities (Paté-Cornell 2012, Hall and Borgomeo 2013, Ward et al 2014b) and may help improve the design and correct targeting of adaptation strategies (Smit and Pilifosova 2003, Adger et al 2005, IPCC 2012, Mason and Calow 2012, Hall and Borgomeo 2013, Aerts et al 2015, Döll et al 2015). The probabilistic treatment of variability and extremes is well-known for its use in the evaluation of hydrological states (McKee et al 1993, Stedinger et al 1993, Tallaksen 2000, Stahl 2001, Döll et al 2003, Tallaksen et al 2004, Shukla and Wood 2008, Vincente Serrano et al 2010) and risk assessment methods–covering hazard, exposure, and vulnerability (UNISDR 2009, IPCC 2012)—have been adopted previously to express risk in other hydro-meteorological perils or in operational reservoir management (Burn et al 1991, Ko et al 1992, Nardini et al 1992, Ward et al 2013). So far, only few studies have, however, actually applied risk-based principles in the assessment and evaluation of water scarcity at a regional scale (Rogers and Fiering 1986, Hall and Borgomeo 2013, Borgomeo et al 2014, Turner et al 2016) and, to the best of our knowledge, a global scale water scarcity risk assessment is missing yet.
To address this issue, we establish a first step towards a framework for global water scarcity risk assessments that covers the first two perils of the UNISDR (2009) risk definition (hazard and exposure) and uses probabilistic methods to deal with variability and extremes. In this contribution we present the first insights of our study and discuss the steps that need to be taken to complete the proposed framework for the assessment of water scarcity risks.
2. Methods
In short, we carried out this assessment through the following steps (figure 1): (1) calculated yearly water availability (0.5° × 0.5°) over the period 1971–2099 using daily run-off from the GHM PCR-GLOBWB, forced with different climate change projections (representative concentration pathways or RCPs) from the ISI-MIP project (www.isi-mip.org, Warszawski et al 2014); (2) fitted a Gamma distribution through the time-series of yearly water availability covering historic, 2030, 2050, and 2080 conditions and estimated water availability for 999 return periods, varying from 1 up to 1000 years; (3) calculated water scarcity conditions by assembling the water availability results with scenario estimates of population density (shared socioeconomic pathways or SSPs); (4) assessed risk (covering hazard and exposure) in terms of the expected annual exposed population (EA-EP) and estimated the fraction of risk being attributable to the driving forces climate change, socioeconomic developments, or a combination of both; and (5) compared the use of such a risk-based method in water scarcity assessments to the use of long-term mean values to assess water scarcity. The following paragraphs describe our methods in detail.

Figure 1. Methodological framework for the assessment of water scarcity risks (expected annual exposed population), covering four steps: (1) calculate yearly water availability over the period 1971–2099 using the global hydrological model PCR-GLOBWB being forced with the output of five global climate models and three representative concentration pathways (RCPs: RCP2.6, RCP6.0, RCP8.5); (2) fit a Gamma distribution to the yearly water availability data for the different time-slices and climate change (RCP) projections; (3) combine the probability density functions of yearly water availability with estimates of population density (SSPs: SSP1, SSP3, SSP5) to calculate water scarcity and draw exceedance impact curves for the storylines: sustainable development (RCP2.6–SSP1), fragmented world (RCP6.0–SSP3), and fossil-fuel based development (RCP8.5–SSP5); (4) estimate water scarcity risk for the different time-slices and storylines.
Download figure:
Standard image High-resolution image2.1. Calculating water availability
In this study we used daily run-off (0.5° × 0.5°) from the GHM PCR-GLOBWB to calculate yearly water availability (van Beek et al 2011, Wada et al 2014b). PCR-GLOBWB was forced using meteorological data (0.5° × 0.5°), from five global climate models (GCMs: GFDL-ESM2M, HadGEM2-ES, IPSL-CM5A-LR, MIROC-ESM-CHEM, NorESM1-M) (Hempel et al 2013), each of them representing three representative concentration pathways (RCPs: van Vuuren et al 2011, Taylor et al 2012): RCP2.6, RCP6.0 and RCP8.5. The meteorological data was bias-corrected towards the WATCH observation based dataset (Weedon et al 2011) using an established method of Hempel et al (2013). The resulting daily run-off values per RCP were aggregated into yearly totals per water province. Water provinces are a composite of river basins and administrative regions (Straatsma et al 2014). Within this study, we distinguished 1514 water provinces with a mean and median size of 83 663 km2 and 48 663 km2 respectively (supplementary figure A1). The use of hydrological years instead of calendar years is needed since the statistical analysis (section 2.2) requires the time-series to be independent (Leadbetter et al 1983, Katz et al 2002). We used long-term mean maximum water availability as a proxy for the distinction between two types of hydrological years: October–September; July–June (Ward et al 2014a, Veldkamp et al 2015a).
2.2. Probabilistic water availability and water scarcity assessments
Subsequently, we fitted per water province and for each GCM-RCP combination a Gamma distribution through four 30 year time slices of annual water availability: historic (1975–2004); 2030 (2015–2044); 2050 (2035–2064); and 2080 (2065–2094). A Gamma distribution was used because its distribution is zero-bounded and therefore well able to reflect water availability. Moreover its scale and shape parameters enable the representation of a wide variety of distribution shapes (Wilks 1990, 1995, Thom 1958, Husak et al 2007). We tested the accuracy of the estimated Gamma parameters in approximating its original distribution with the Kolmogorov–Smirnov or Lilliefors test (Crutcher 1975, Wilks 1995, Husak et al 2007) using P-values of ≥0.001 (supplementary figure A2). The 'accurate' Gamma parameters were used to estimate the annual water availability per water province for 999 return periods, from 1 up to 1000 years, thereby continuously accounting for the probability of zero water availability (Wilks 1990, Stedinger et al 1993).
Water scarcity conditions were expressed with the water crowding index (WCI), a simple but often used indicator that estimates the annual water availability per capita (Falkenmark 1986, 2013, Rijsberman 2006), see equation (1):
where WCIi,tp,rp,rcp,ssp, is the water availability per capita in water province i, time slice tp, return period rp, climate change projection rcp, and socio-economic scenario ssp; WAi,tp,rp,rcp, is the total water availability in water province i, time slice tp, return period rp, and climate change projection rcp; and Pi,tp,ssp, is the total population in water province i, time slice tp, and population growth scenarios ssp. We used ≤1700 m3/capita per year as the threshold for water scarcity (Kummu et al 2010). Moreover, we distinguished between moderate (≤1700 m3/capita per year), severe (≤1000 m3/capita per year), and absolute (≤500 m3/capita per year) water scarcity conditions (Kummu et al 2010).
The population estimates used in this study to calculate the WCI were derived from the shared socioeconomic pathways (SSPs: van Vuuren et al 2007, 2011, O'Neill et al 2012, 2015). Although theoretically each SSP could be combined with each RCP, some combinations of SSP and RCP are not expected to develop in the real world (Arnell and Lloyd-Hughes 2014). Therefore, we followed Winsemius et al (2015) who set-up three combinations of RCPs and SSPs (table 1): sustainability (RCP2.6-SSP1), fragmented world (RCP6.0-SSP3), and fossil-fuel based (FFB) development (RCP8.5-SSP5). We refer to Winsemius et al (2015) for a detailed explanation on the development of these storylines.
Table 1. Storylines with their associated narratives for the representative concentration pathways (RCPs) and the shared socio-economic pathways (SSPs), taken from: van Vuuren et al (2011), O'Neill et al (2015), Winsemius et al (2015).
| Storyline | RCPs | SSPs |
|---|---|---|
| Sustainability | RCP2.6 | SSP1 |
| Peak in radiative forcing at ∼3 W m−2 (∼490 ppm CO2 eq) before 2100 and then decline (the selected pathway declines to 2.6 W m−2 by 2100). | Rapid technologyHigh environmental awarenessLow energy demandMedium-high economic growthLow population | |
| Fragmented world | RCP6.0 | SSP3 |
| Stabilization without overshoot pathway to 6 W m−2 (∼850 ppm CO2 eq) at stabilization after 2100 | Slow technologyDevelopment (dev-ing)Reduced tradeVery slow economic growthVery high population | |
| Fossil-fuel Based development | RCP8.5 | SSP5 |
| Rising radiative forcing pathway leading to 8.5 W m−2 (∼1370 ppm CO2 eq) by 2100 | Rapid technology for fossil fuelsHigh energy demandHigh economic growthLow population |
2.3. Estimating and evaluating risk
The resulting WCI values were plotted on exceedance probability curves. Implementing the thresholds of 500, 1000, and 1700 m3/capita per year resulted for each GCM-storyline combination and for each time-slice in an exceedance-probability impact curve per water province. In this study, we expressed impact as the population exposed to water scarcity events. One should keep in mind, however, that the actual impact of water scarcity is not only influenced by exposure, but also by the vulnerability to water scarcity (Gleick 1998, Arnell and Delaney 2006, Kundzewicz et al 2008, Hoekstra et al 2012, Falkenmark 2013, Wutich et al 2014). Finally, risk was estimated as the area under the exceedance-probability impact curve (Meyer et al 2009) and is expressed here as the EA-EP. To evaluate the contribution of the driving forces climate change and population growth to the changes in risk levels towards 2080 separately, we repeated the complete risk analysis (section 2.1–2.3) with two more runs: (1) a run with transient climatic conditions and fixed (historic) population density conditions; and (2) a run with fixed (historic) climatic conditions and transient population growth conditions.
3. Results
Global scale water scarcity risk (EA-EP) increases towards 2080 under all storylines (figure 2). While risk more than doubles under the storylines sustainability and FFB development, it increases with more than three-fold under the storyline fragmented world. Also when risk is expressed in relative terms (EA-EP as percentage of the total population), global risk levels increase towards 2080, from 38.0% under historic conditions, up to 67.8% (fragmented world), 56.2% (sustainability), and 59.1% (FFB development).

Figure 2. Development of the absolute (a) and relative (b) water scarcity risk levels. The colored squares show the global risk levels (EA-EP) under the different storylines for the time-slices: historic, 2030, 2050, and 2080. GCM uncertainty is visualized as the colored shaded areas around the scatters. The colored asterisks show the global mean exposed population (M-EP) under the different storylines using a 30 year mean water availability estimate as input for each time-slice for the risk assessment.
Download figure:
Standard image High-resolution imageGCM uncertainty is relatively small at the globally aggregated scale, with deviations from the ensemble-mean up to 3.2% in 2080. Uncertainty is larger under severe (≤1000 m3/capita per year) and absolute (≤500 m3/capita per year) water scarcity, with deviations in 2080 up to 5.8% and 16.1% respectively (supplementary table B1). Making a distinction between moderate, severe, and absolute water scarcity, we find that the increases in global risk are dominated by increases in absolute water scarcity risk, and least driven by changes in moderate water scarcity risk (supplementary figure A3 and table B2). When comparing the global scale risk estimates using risk-based methods (EA-EP) with the results of conventional water scarcity methods using long-term means (M-EP), we find only minor deviations that fall within the GCM modeling uncertainty for the storylines sustainability and fragmented world. Whilst risk estimates using the M-EP approach are lower than those using the EA-EP approach for moderate water scarcity events, we find an opposite signal when looking at absolute scarcity events. For severe scarcity events we did not find a uniform signal across the different storylines (supplementary table B3).
Large geographical differences in risk exist across the different world regions (figure 3) and water provinces (supplementary figure A4). Using the ≤1700 m3/capita per year as indicator for water scarcity, the highest relative risk estimates in 2080 were found in Northern Africa (85.2%—fragmented world), whilst the lowest values were found in the Middle East (18.8%—sustainability). By 2080, the highest increases in relative risk levels were found in the Caribbean (up to 50 percentage-points increase—FFB development), compared to stable relative risk levels in the Middle-East (up to 9.3 percentage-points increase—fragmented world), see also supplementary figure A5 for the results per water province. Regionally, all GCM models support the found GCM ensemble-mean increase/decrease in risk levels per storyline. Whilst modeling spread is relatively high in Australia and the Pacific, the Caribbean, Northern Africa, and Northern America (figure 3), high modeling agreement (increase/decrease) was found at the level of water provinces (supplementary figure A5). Comparison of the M-EP with the EA-EP outcomes at global, regional and local scales, shows that deviations between M-EP and EA-EP increase up to 50% of EA-EP at local scales (figures 2 and 3, supplementary figure A6).
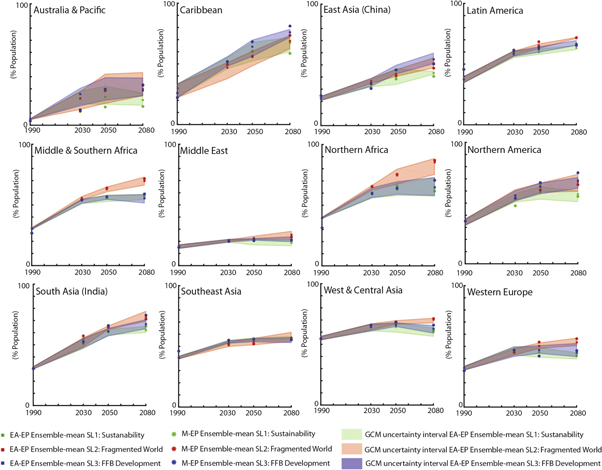
Figure 3. Regional variation in the development of the relative exposure to water scarcity events over time, expressed in terms of percentage of the total population. The colored lines show the development in regional exposed population (expected annual exposed population (EA-EP)) under the different storylines using probabilistic methods (Gamma distribution) to assess water scarcity risk. GCM uncertainty is expressed here by means of the shaded areas around these lines. The dashed lines show the development in regional exposed population (mean exposed population (M-EP)) under the different storylines using a 30 year average ensemble-mean water availability estimate as input in the water scarcity assessment.
Download figure:
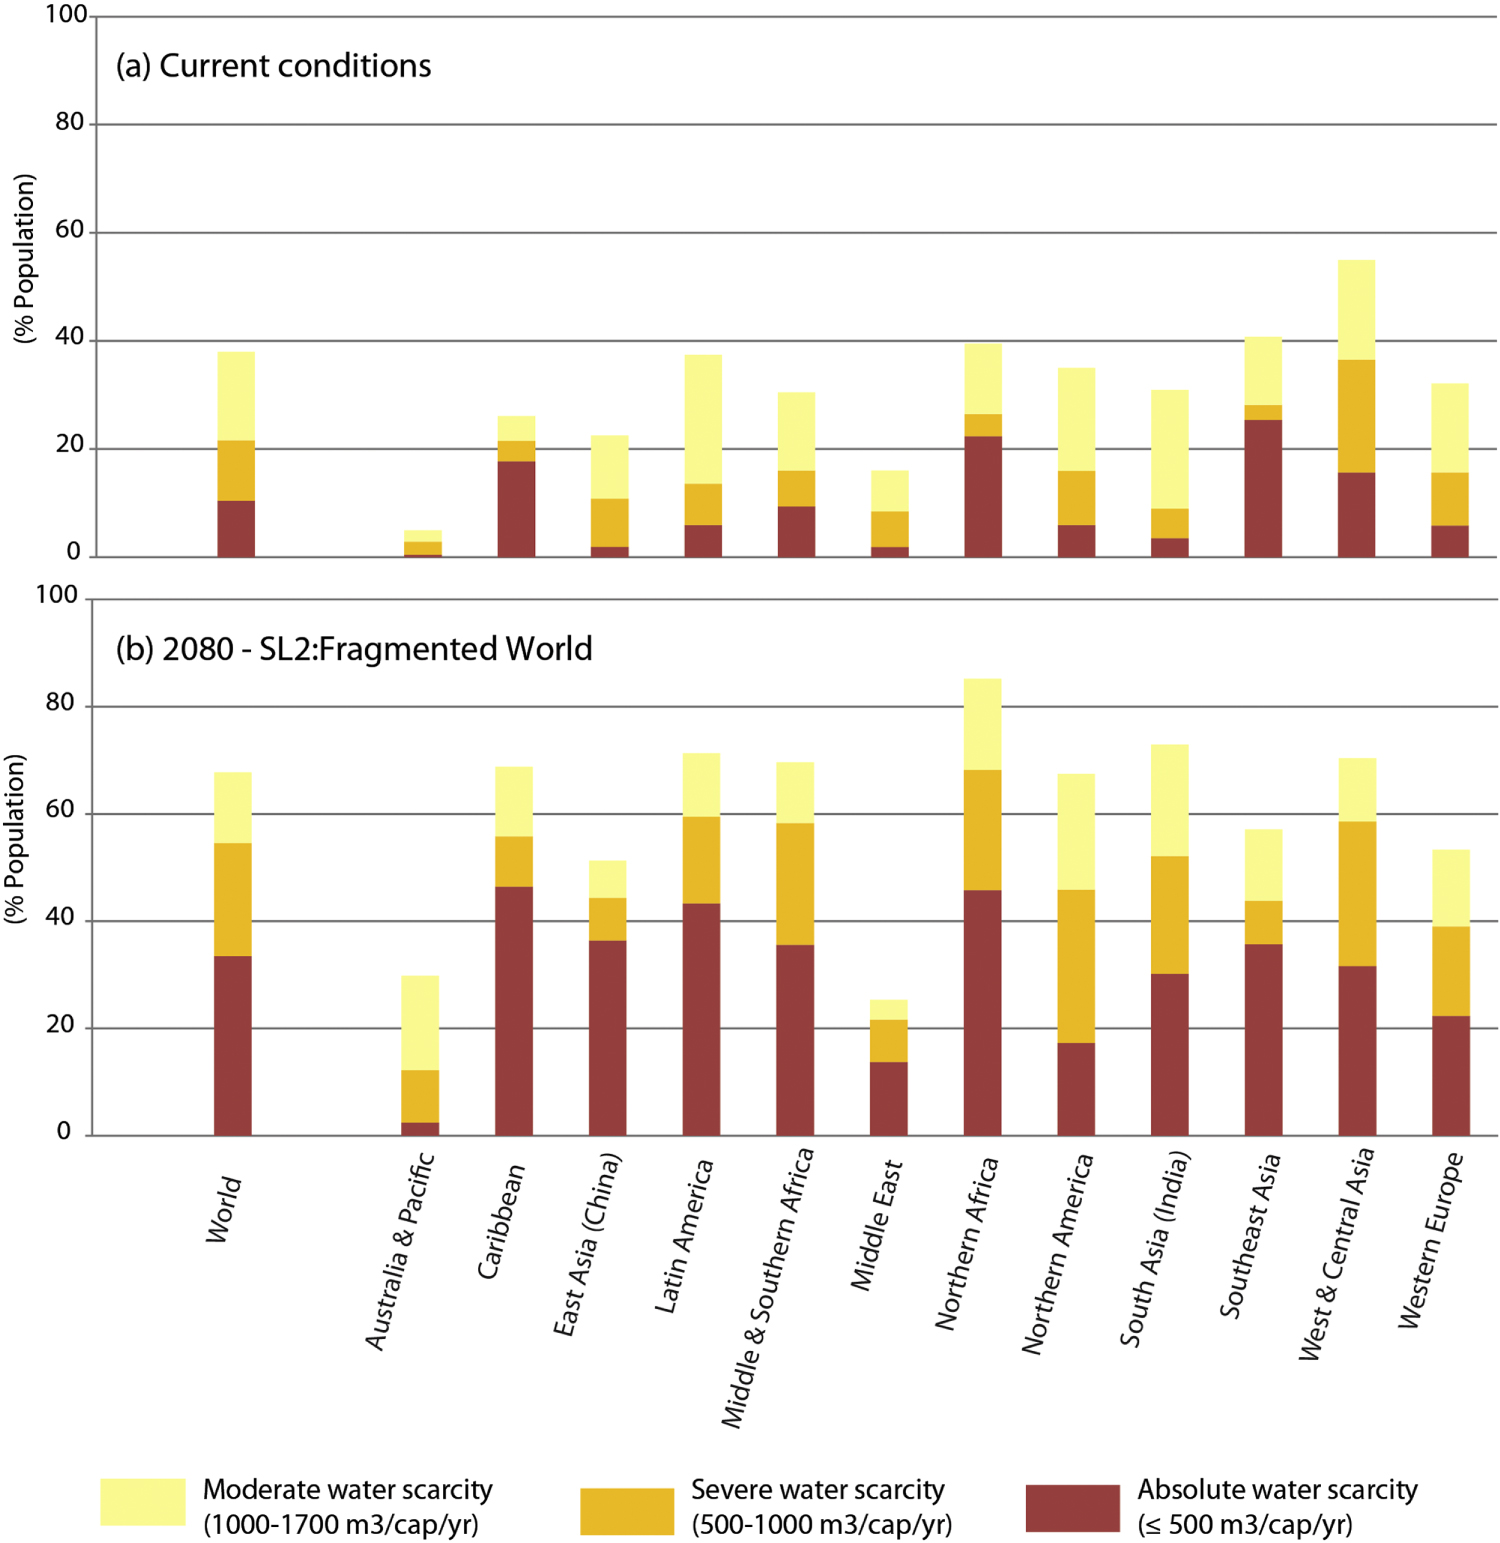
Standard image High-resolution imageLooking at moderate, severe, and absolute water scarcity conditions and their associated risk levels separately (figure 4), shows that large regional differences exist under historic and future conditions. Moderate and severe water scarcity risk levels dominate in Australia and Pacific, Northern America, West and Central Asia, Western Europe, and India (>50% of the found total EA-EP levels). At the same time, Northern Africa experiences the highest relative risk levels in 2080 under storyline fragmented world, not only when looking at the composite of all water scarcity severity classes, but also when taking into account only the absolute water scarcity. Increases in risk under the storyline fragmented world are dominated by increases in absolute and severe water scarcity risk in almost all world regions, whilst the levels of EA-EP to moderate water scarcity remain relatively stable or decrease over time (figure 4 and supplementary figure A7).

Figure 4. Global and regional scale EA-EP levels in 2080 under storyline fragmented world whilst using the GCM ensemble mean data. EA-EP levels are expressed as % of the total population and share of the different water scarcity severity classes (moderate, severe, absolute) in total EA-EP are visualized by means of the different colors applied.
Download figure:
Standard image High-resolution imagePopulation growth is the largest contributor to increases in water scarcity risk at the global and regional scale, irrespective of the storyline and time-slice studied (figure 5). The foreseen increases in population density increase risk in all world regions and under all storylines, whilst the climate change attribution to changing risk levels is more diverse (supplementary figures A8–A10). Negative contributions of projected climate change (supplementary figure A11, presented by means of changes in mean yearly water availability and its inter-annual variability) to the change in water scarcity risk (i.e. resulting in lower risk) are, for example, found for the Middle East, Northern Africa, West and Central Asia, and the Caribbean. The combined factor 'climate change + population growth' is a factor that accounts for the differences in risk estimates when looking at projected climate change or population growth individually, compared to the estimated actual change (full change) in EA-EP (figure 5 and supplementary figures A8–A10). It should be interpreted as a factor that characterizes the interaction between the two individual driving forces.
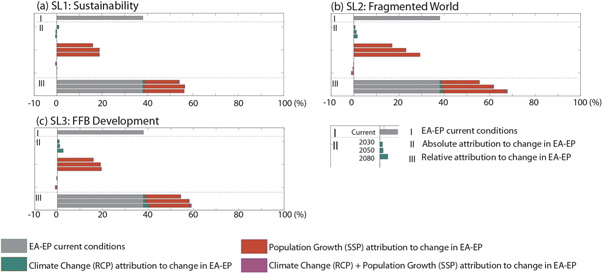
Figure 5. Global scale attribution of risk, expressed in terms of percentage-point change in expected annual exposed population (EA-EP, relative to the global population). Gray bars show risk under historic conditions whereas the colored bars show per storyline (a)–(c) the attribution of the estimated changes in risk to climate change (green), population growth (red), and a combination of factors (purple) for 2030, 2050 and 2080. Sub-figures (II) show for each storyline (a)–(c) the absolute attribution to change, whereas sub-figures (III) present the attribution in relative terms as a share of the total change in EA-EP.
Download figure:
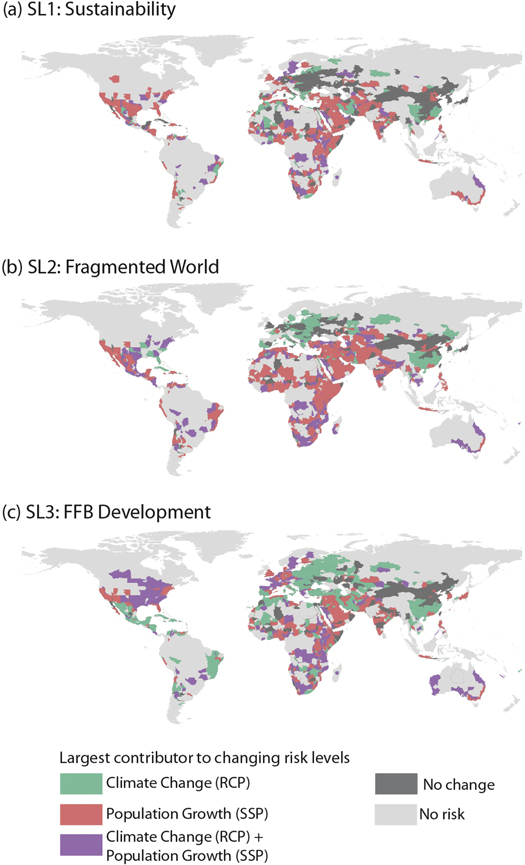
Standard image High-resolution imageThe spatial visualization of the largest drivers of risk towards 2080 (figure 6) shows once more that water scarcity is not solely a climate change problem, but an issue that constitutes from the developments in both the supply of and demand for fresh water resources. When looking at water provinces in Europe, Northern Africa, Northern America, Latin America, the Middle East, and India we find clear differences between the three storylines both with respect the actual changes in risk and regarding the largest contributor of changing risk levels. Due to the relative low population growth and climate change projections under storyline sustainability, water scarcity risk levels do not change in a significant amount of regions in Europe, West and Central Asia, and China. Remarkable is the relatively large share of water provinces for which the change in risk is dominated by population growth as well as its distinct spatial distribution, covering 21.6% of the total land area, and 30.7% of the population (under historic conditions) under the fragmented world storyline. Under the FFB development storyline, population growth is the largest driver of changing risk levels in water provinces covering 13.1% of the total land area and 27.3% of the population (at historic conditions), whilst climate change induces changes in risk mostly in 6.3% and 14.6% of the total land area, and 14.4% and 21.0% of the population (at historic conditions) under the storylines fragmented world and FFB development respectively. The combined factor climate change and population growth is a significant factor of influence in the FFB Development storyline, covering 12.9% of the total global land area.
Figure 6. Regional scale variation in the attribution to changes in risk (EA-EP) in 2080 compared to the historic conditions under the storylines: (a) sustainability, (b) fragmented world, and (c) fossil-fuel based development. Figures (a)–(c) show per water province the largest contributor to the expected change in risk: climate change (green), population growth (red), or a combination of both (purple).
Download figure:
Standard image High-resolution image
4. Discussion and conclusions
In this study we presented a global scale water scarcity assessment based on the principles of a risk analysis. Given the wide variety of GHMs used, the different climate change projections and socioeconomic scenarios applied, and the use of different metrics to assess water scarcity, we found that our global water scarcity (risk) estimates are consistent with global results presented in earlier studies (e.g. Revenga et al 2000, Arnell 2004, Alcamo et al 2007, Hayashi et al 2010, Arnell et al 2011, Gosling and Arnell 2013, Hanasaki et al 2013, Arnell and Lloyd-Hughes 2014, Schewe et al 2014, Schlosser et al 2014, Shen et al 2014, Wada et al 2014a, Kiguchi et al 2015), see supplementary table B4. The use of a Gamma distribution to represent the yearly water availability enabled us to cover with numerous return periods the inter-annual variability in water availability as well as the low-probability events that are normally not included (Paté-Cornell 2012, Hall and Borgomeo 2013). Compared to the conventional water scarcity assessments, the estimates presented in this study are therefore less sensitive to the use of strict water scarcity thresholds, which can cause jumps in the estimated water stressed population or regions (Gosling and Arnell 2013, Veldkamp et al 2015b). This becomes especially important when moving from global, to regional, to local water scarcity risk estimates, whereby deviations between M-EP and EA-EP may increase up to 50%.
In line with earlier studies (supplementary table B4), we found that global and regional water scarcity risk increases towards 2080. Moreover, the results show that population growth outweigh the impacts of climate change at the global and regional scale, under all storylines. Also at local scales, we found population growth to be the largest driver of change in a majority of water provinces, for example under storyline fragmented world. For the FFB development storyline, however, we found that the changes in risk levels are predominantly driven by climate change in a majority of water provinces. The results show that disaggregation to different spatial scales is important: the use of a single scale might obscure water scarcity problems at other scales and may hamper the evaluation of potential underlying causes (Hering et al 2015, Vörösmarty et al 2015).
By using local run-off as a parameter to estimate water availability, it is important to note that this study does not account for upstream–downstream relations. The inclusion of these relations across water provinces would require a separate study modeling multivariate extreme values using copulas or other statistical techniques (Chung and Salas 2000, Favre et al 2004, Hochrainer and Pflug 2012, Timonina et al 2015). Such a study should also take into account the impacts of upstream water withdrawals of all sectors under the different socioeconomic and climate change projections applied (e.g. Wada et al 2016), data that was not available yet when performing our analysis. By using naturalized flows, we have not taken into account the water resources available in man-made managed reservoirs, in ground water storages, or from desalination plants, nor did we include any infrastructure for the transfer of water. Water availability values presented within this study should be therefore interpreted as conservative (i.e. lower-end estimates), leading to higher-end risk estimates. Despite the fact that water quality and water quantity conditions are highly interdependent, we did not account for water quality conditions in this study. Insufficient water quality conditions are expected to become more important towards the future (e.g. Jiang et al 2014) and could severely limit the availability of fresh water resources for use. Extending the water scarcity risk assessment framework with a water quality module could therefore enhance the water scarcity risk estimates as presented in this study.
This study used only one GHM to estimate water scarcity risk. Although previous research has shown that the PCR-GLOBWB model estimates fit well within the ensemble of frequently used GHMs (Schewe et al 2014, Wada et al 2016) it is recommended to use an ensemble of models as the GHM spread exerts a significant influence on the range of outcomes (Schewe et al 2014, Döll et al 2015). The difficulty of GHMs to model water availability in desert areas (van Huijgevoort et al 2012, Wada et al 2013) is reflected in this study by the absence of good Gamma-fit estimates and the inability to draw probability-density curves for these water provinces. Although these areas exhibit only a minor share of the global total population (supplementary figure A2), one should take into account that the inability to model these regions in an appropriate manner leads to underestimations in risk levels, especially in Northern Africa.
PCR-GLOBWB was forced in this study with meteorological forcing data from five GCMs, being bias-corrected following Hempel et al (2013). Hempel et al (2013) showed that the bias-correction method applied is able to improve the matching of both the variability within, as well as the long-term means of, different simulated meteorological values with observations (WATCH Forcing Data, Weedon et al 2011). Even in the tails of the distribution, Hempel et al (2013) found a relatively good agreement with the observation data-set. Hempel et al (2013) did not bias-correct, however, the representation of persistence, which might influence possibly the representation of inter-annual variability (Rocheta et al 2014). To account for this, a new nested-bias-correction method could be adopted in future studies (Rocheta et al 2014, Mehrotra and Sharma 2015). To evaluate the potential bias between the GCM derived simulations used in this study and observational data, we compared the water scarcity risk estimates using the GCM data with risk estimates using the WATCH Forcing Data Era Interim (WFDEI: Weedon et al 2014), see supplementary figure A12. We found that the GCM derived simulations overestimate risk slightly at global scale (3.2 percentage-point) and in nine world regions (from 0.4 up to 6.6 percentage-point). For Middle East (−0.7 percentage-point), Southeast Asia (−0.1 percentage-point), and Australia and the Pacific (−0.1 percentage-point), we found a small underestimation in risk levels using the GCM derived simulations compared to the WFDEI.
Risk is expressed in this study by means of the (EA-EP) to water scarcity. A potentially exposed population, however, does not per se imply (economic) impact. To come to a full risk assessment framework more work needs to be done to make the transfer from risk estimates in terms of exposed population towards estimates covering 'economic' impacts. A first step therein should be to include vulnerability, including: the sensitivity of a population to water scarcity, the available infrastructure and (financial) resources to cope with water scarcity, the portfolio of economic activities dependent on the available water resources, the dependency of an economy on local or external water resources, and capability of the responsible government to deal with water scarcity in an quick and efficient manner (Gleick 1998, Arnell and Delaney 2006, Kundzewicz et al 2008, Hoekstra et al 2012, Falkenmark 2013, Wutich et al 2014, Lasage et al 2015a, 2015b). Making the translation from exposure to economic impacts is an emerging research field using, among others, hydro-economic models and econometric optimization routines (Brouwer and Hofkes 2008, Harou et al 2009). So far, their application in risk-based assessments with a global reach has been, however, limited.
Improving the presented water scarcity risk assessment framework with the above mentioned considerations will offer water managers a promising perspective to achieve higher water security under current and future circumstances in a well-informed and adaptive manner. Risk-based methods are able to cover multiple aspects: the hazard size, reflecting the likelihood, uncertainty, and inter-annual variability of water scarcity events; as well as the impact of water scarcity events, covering exposure and vulnerability. Adopting a scenario-based approach within the assessment of water scarcity risks, moreover, provides insights in the impacts of inter-action among the different drivers of risk. A better understanding of the underlying driving forces of water scarcity risks can help decision makers to assign focus areas for different types of adaptation strategies (e.g. soft versus hard) and to develop portfolios of (cost-) efficient but low- to no-regret solutions to stabilize or reduce water scarcity risk at different spatial scales.
Acknowledgments
TIEV, JCJHA, and PJW designed research; TIEV and YW prepared datasets; TIEV analyzed data; and TIEV, YW, JCJHA, and PJW wrote the paper.
The research leading to this article is partly funded by the EU 7th Framework Programme through the projects ENHANCE (grant agreement no. 308438) and Earth2Observe (grant agreement no. 603608). J Aerts received funding from the Netherlands Organization for Scientific Research (NWO) VICI (grant no. 453-14-006). Y Wada is supported by Japan Society for the Promotion of Science (JSPS) Oversea Research Fellowship (grant no. JSPS-2014-878). P Ward received funding from the Netherlands Organization for Scientific Research (NWO) in the form of a VENI grant (grant no. 863-11-011). None of the authors of this article have a competing financial interest.