

Abstract
Global-mean temperature increase is roughly proportional to cumulative emissions of carbon-dioxide (CO2). Limiting global warming to any level thus implies a finite CO2 budget. Due to geophysical uncertainties, the size of such budgets can only be expressed in probabilistic terms and is further influenced by non-CO2 emissions. We here explore how societal choices related to energy demand and specific mitigation options influence the size of carbon budgets for meeting a given temperature objective. We find that choices that exclude specific CO2 mitigation technologies (like Carbon Capture and Storage) result in greater costs, smaller compatible CO2 budgets until 2050, but larger CO2 budgets until 2100. Vice versa, choices that lead to a larger CO2 mitigation potential result in CO2 budgets until 2100 that are smaller but can be met at lower costs. In most cases, these budget variations can be explained by the amount of non-CO2 mitigation that is carried out in conjunction with CO2, and associated global carbon prices that also drive mitigation of non-CO2 gases. Budget variations are of the order of 10% around their central value. In all cases, limiting warming to below 2 °C thus still implies that CO2 emissions need to be reduced rapidly in the coming decades.
Export citation and abstract BibTeX RIS

Content from this work may be used under the terms of the Creative Commons Attribution 3.0 licence. Any further distribution of this work must maintain attribution to the author(s) and the title of the work, journal citation and DOI.
1. Introduction
Cumulative carbon emissions over the industrial era largely determine peak global-mean temperature increase (Allen et al 2009, Matthews et al 2009, Meinshausen et al 2009, Collins et al 2013, Gillett et al 2013, Knutti and Rogelj 2015). This characteristic has led to the suggestion that cumulative carbon emissions could be used as benchmarks for climate policy aiming at limiting global-mean warming (Meinshausen et al 2009, Zickfeld et al 2009, Bowerman et al 2011, Matthews et al 2012, Knutti and Rogelj 2015). However, emissions from greenhouse gases (GHG) other than carbon-dioxide (CO2) also contribute to peak warming. For forcing agents with short atmospheric lifetimes (for example, methane, CH4), the annual rate of emissions leading up to the time of peak warming is more important for maximum warming than their cumulative emissions (Smith et al 2012, Bowerman et al 2013, Lauder et al 2013, Rogelj et al 2014c).
Currently, international climate talks are focussed on limiting global-mean temperature increase to below 2 °C relative to preindustrial levels, and lower long-term global goals like a warming of 1.5 °C are also considered. Recently, the Intergovernmental Panel on Climate Change (IPCC), in its Fifth Assessment Report (AR5), reported that limiting total human-induced warming to less than 2 °C relative to the period 1861–1880 with a probability of >66% would leave a carbon budget of about 1000 GtCO2 from 2011 onward (Collins et al 2013, IPCC 2013, Stocker et al 2013, Clarke et al 2014, IPCC, 2014a, IPCC, 2014b). The IPCC AR5 (IPCC, 2014b) also indicates that an uncertainty exists in the allowable carbon budget, not only due to geophysical uncertainties, but also due to uncertainties linked to the possible variations of accompanying non-CO2 emissions. Finally, IPCC (2014b) also indicated that end-of-century CO2 budgets continue to be a good indicator for end-of-century warming, even if at some point net negative CO2 emissions are achieved.
Given the uncertainties, several questions arise related to the practical implementation of the concept of cumulative carbon emissions in climate policy. This is because—besides inevitable geophysical uncertainties—the amount of carbon emissions consistent with a given temperature limit depends on the concurrent mitigation of non-CO2 gases, which in turn depends to some extent on carbon prices that are influenced by socio-economic developments (energy demand and technology availability—like nuclear power and bio-energy). So, how can policy choices influence the appropriate size of the carbon budget for limiting warming to below 2 °C? Furthermore, how do costs implied by a particular cumulative global carbon budget vary depending on these choices? Here we look at these questions from an integrated assessment modelling (IAM) perspective and attempt to identify synergistic policies and key trade-offs.
2. Methods
2.1. Emission scenarios
Assessing the policy and technology dependence of cumulative carbon emissions ideally makes use of emission scenarios with an internally consistent evolution of all radiatively active species over time. We use the IAM framework MESSAGE (Model for Energy Supply Strategy Alternatives and their General Environmental impact) (Riahi et al 2007) developed at the International Institute for Applied Systems Analysis (IIASA). At the core of MESSAGE lies a systems-engineering optimization model of the global energy economy, which includes a large portfolio of energy technologies for the assessment of technological transitions over the 21st century (see for example: Riahi et al 2012, McCollum et al 2013). The modelling framework contains a detailed representation of the most important GHG-emitting sectors, a representation of land-use emissions, a link to the macro-economic model MACRO (Messner and Schrattenholzer 2000), and a link to IIASA's GAINS (GHG and Air Pollution Interactions and Synergies) air-quality model (Amann et al 2009), which allows the consistent tracking of (non-GHG) air pollutants over time.
In brief, putting a limit on the cumulative amount of GHG emissions over the 21st century results in a transformation of the energy, industry and land-use sector, modelled by MESSAGE. The carbon price implied by this transformation is used by MACRO to iteratively determine possible price-driven reductions of energy demand. Finally, the transformation of the energy, industry and land-use system also impact possible sources of air pollutants. The presence and activity of these sources (like coal-fired power plants or diesel engines) is translated into actual emissions by the MESSAGE-GAINS linkage, which assumes that current legislation is successfully implemented throughout the 21st century (Rogelj et al 2014b). A detailed description of the model setup used in this study is provided in Rogelj et al (2013b).
We use a set of more than 500 scenarios that were originally developed in a study focusing on the relative importance of uncertainties (technological, societal, political and geophysical) for the cost of limiting warming below particular temperature levels with a given probability (Rogelj et al 2013b). The scenarios differ from each other in their underlying assumptions: (i) the stringency of mitigation action (reflected in the equivalent carbon price applied to GHG emissions over time), (ii) variations in the availability of key mitigation technologies, and (iii) future energy demand.
GHG emissions follow cost-minimizing trajectories that stay within varying global cumulative emission limits, with emissions of non-CO2 gases weighted using 100-year Global Warming Potentials (GWPs: IPCC, 2007). Delayed mitigation cases are not considered here, in other words all scenarios started optimizing concerted, global efforts to mitigate climate change from 2010 onward. Delaying action can significantly constrain the achievability of low temperature stabilization targets and would imply higher overall costs (Luderer et al 2013, Rogelj et al 2013b, Clarke et al 2014). However, carbon budgets to 2100 would remain similar even in delayed-action scenarios (see, Collins et al 2013).
Our scenario set contains five technology variations which span a wide range of mitigation options and which are categorized in two groups: three technology-restricting cases and two cases that assume breakthroughs in mitigation technologies (Rogelj et al 2013a, Rogelj et al 2013b). Mitigation technologies are defined here as technologies or practices that significantly reduce GHG emissions by replacing technologies or practices that would generate more GHG emissions otherwise. The technology restricting cases are (1) no new nuclear (assuming a phase-out over the 21st century), (2) limited land-based mitigation measures (limiting the global bio-energy potential and not considering forest management as a mitigation option), and (3) no Carbon Capture and Storage (no CCS—assuming that CCS will never become available at large scale during the 21st century). The technological breakthrough cases are (1) advanced transport (allowing more than 50% of the transport sector's final energy consumption being electrified by the end of the century), and (2) advanced non-CO2 mitigation (assuming that mitigation technologies for non-CO2 GHGs, like CH4, improve significantly throughout the 21st century beyond current levels). The latter two cases are considered breakthroughs because, on the one hand, the transport sector is particularly difficult to decarbonize given its high reliance on liquid fossil fuels and because, on the other hand, currently only limited mitigation potentials for some parts of the agricultural sector have been identified (Smith et al 2014).
Other drivers that can influence future GHG emission pathways are population (O'Neill et al 2012) or economic projections (of world gross domestic product (GDP)). These are not explicitly varied in our scenarios but are taken directly from the Global Energy Assessment (Riahi et al 2012). Such socio-economic and demographic developments can lead to different levels of future energy demand, depending, however, on how efficiently energy is transformed into services going forward. In order to cover a broad scenario space in terms of energy-demand, we assume a range of projections that roughly spans the entire range of outcomes that would otherwise be obtained when widely varying population and GDP projections in consistent ways (Nakicenovic and Swart 2000, Rogelj et al 2013b).
2.2. Temperature assessment and consistency with IPCC AR5
Here we use the reduced-complexity carbon-cycle and climate model MAGICC (Meinshausen et al 2011a, Meinshausen et al 2011b) in a probabilistic setup (Meinshausen et al 2009) to translate emissions to atmospheric concentrations and then to temperature change. The model setup is updated such that the marginal climate sensitivity distribution is consistent with the findings of the Fourth Assessment Report (AR4) of the IPCC (Rogelj et al 2012; IPCC, 2007). This model setup also remains consistent with the more recent AR5 assessment (Rogelj et al 2014a). For each of the 500+ socio-economic scenarios created with the MESSAGE model, MAGICC is used to compute the temperature increase relative to pre-industrial (1850–1875) for a set of 600 geophysical ensemble members (Meinshausen et al 2011b). The 'implied probabilities' (Smith and Stern, 2011) used in this study are defined by the proportion of geophysical ensemble members exceeding a particular temperature limit at a given point in time.
2.3. Base performance of model setup
Cumulative CO2 emissions from 1870 to 2011 are estimated at about 1810 billion metric tonnes of carbon-dioxide (GtCO2) in our simulations. This is just slightly lower than the median (1890 GtCO2; ∼4% lower) but well within the likely range (1630–2150 GtCO2) of historical cumulative carbon emissions reported by the IPCC AR5 (IPCC 2014b). Uncertainties in cumulative CO2 emissions over this time period are about ±12% (90% range derived from Le Quéré et al 2013).
We find that to limit warming to below 2 °C with 66% chance (or alternatively, 75 or 50%) cumulative CO2 emissions from 2011 to 2100 need to be limited to 670–1050 GtCO2 (rounded to the nearest 10 GtCO2, range of upper and lower bound estimates over our entire scenario set; see table 1). For two other probability levels (75 and 50%), the cumulative amounts are 610–830 and 990–1450, respectively. The range of cumulative emissions is markedly smaller for the 75% probability level because such climate protection levels can only be reached under a subset of our full set of scenario variations. The spread of cumulative CO2 emissions in each of the ranges reported above (for example, the 670–1050 GtCO2 range for a 66% chance) stems from non-CO2 forcing variations, which are driven by differences in technology and energy-demand assumptions in the range of scenarios. Geophysical uncertainties are reflected by the fact that any given carbon budget can limit warming only at a given probability level (with levels of 50, 66 and 75% reported in this study).
Table 1. Cumulative CO2 budgets consistent with limiting warming below 1.5 and 2 °C. Note that ranges are given for the feasible scenarios available in our set. With increasing stringency less feasible scenarios become available and, as a result, ranges could be narrower for more stringent targets. Values are rounded to the nearest 10 GtCO2.
| CO2 budget | |||
|---|---|---|---|
| Likelihood | (GtCO2) | ||
| <2 °C during 21st century | 2011–2050 | 2011–2100a | |
| 50% | Central case (intermediate demand) | 1150 | 1280 |
| Technology range | 1050–1270 | 1200–1430 | |
| Low–high energy demand range | 1080–1250 | 1050–1270 | |
| Range of full scenario set | 1050–1310 | 990–1450 | |
| 66% | Central case | 940 | 940 |
| Technology range | 890–1060 | 840–1050 | |
| Low–high energy demand range | 920–1050 | 720–880 | |
| Range of full scenario set | 890–1130 | 670–1050 | |
| 75% | Central case | NF | NF |
| Technology range | 870–910 | 610–830 | |
| Low–high energy demand range | 910-NF | 640-NF | |
| Range of full scenario set | 860–1010 | 610–830 | |
| <1.5 °C in 2100 | |||
| 50% | Low demand case | 740 | 400 |
| Technology range | 700–900 | 400–570 | |
| Range of full scenario set | 700–900 | 400–570 | |
aNote that cases with larger emission budgets from 2011 to 2050 have corresponding smaller budgets from 2011 to 2100. Note: NF, infeasible to achieve probability.
This means that if the world implements a 1000 GtCO2 carbon budget over the 2011–2100 period, the probability of global temperature increase in fact remaining below 2 °C could be about 50% or more than 75%, depending on the technology choices and the pathway that the world follows in meeting this budget (figure 1). In the next section we further explore what drives these differences in carbon budgets and the probability with which they constrain warming below given limits.
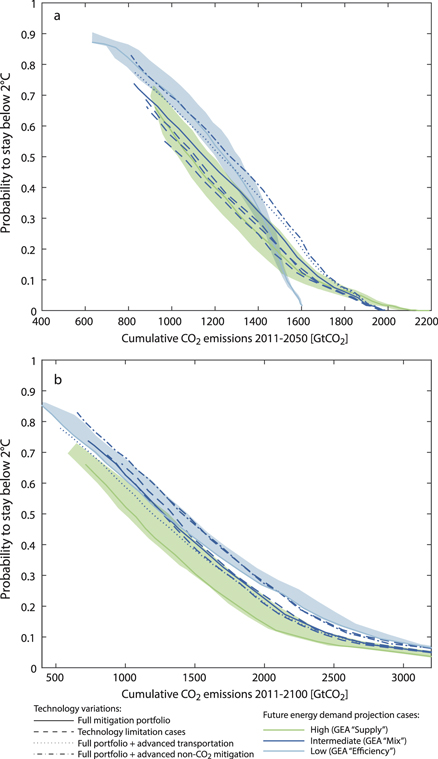
Figure 1. Cumulative CO2 emission budgets for the 2011–2050 (panel a) and the 2011–2100 period (panel b) versus probability of limiting warming below 2 °C during the 21st century. Lines end at the last available feasible scenario of a particular subset, and are colour- and line-style-coded as a function of future energy demand assumptions and technology availability, respectively. Shaded ranges for the low and high energy demand cases show the range over all technology variations. Corresponding figures with lines for all cases, as well as for 1.5 °C are provided in supplementary information figures S1 and S2, respectively.
Download figure:
Standard image High-resolution image3. Results and discussion
3.1. Influence of technology availability
All our technology limiting cases result in a smaller potential for CO2 emission reductions by 2100. At the same time, our technological breakthrough cases increase the CO2 mitigation potential (advanced transport) or leave it unchanged (advanced non-CO2 mitigation).
However, changes in the CO2 and non-CO2 mitigation potential do not translate into a proportional actual change in corresponding CO2 and non-CO2 emissions. We find a significant and complex interaction between non-CO2 abatement and CO2 emissions budgets, even though many non-CO2 GHGs are emitted by sources which are relatively independent of sources of CO2. This is because in MESSAGE, as in most IAM frameworks that assume a multi-gas approach to climate change mitigation, both reductions in CO2 and in other Kyoto-GHGs are driven by the same carbon price, which is translated between gases via 100-year GWPs.
When mitigation of CO2 is made relatively harder (by limiting CO2 mitigation technologies), carbon prices will be higher to achieve a similar level of CO2 emission reductions. These higher prices will result in relatively larger concurrent emissions reductions of CH4 and other non-CO2 gases; the lower radiative forcing from those gases hence allows slightly greater cumulative emissions of CO2. Conversely, larger CH4 reductions can also be the result of a higher non-CO2 mitigation potential (for example, this is the case in our advanced non-CO2 mitigation case for agriculture). Peak warming is largely determined by the cumulative emissions of CO2, but is also influenced by the annual emissions of shorter-lived GHGs like CH4 leading up to the peak (Smith et al 2012). Consequently, stronger abatement of non-CO2 gases will also result in a slightly smaller amount of CO2 reductions needed to meet the same peak temperature goal and hence allow greater cumulative CO2 emissions, resulting in slightly lower carbon prices.
This indicates that cumulative CO2 emissions consistent with a specific temperature limit are contingent on the future abatement potential (and actual abatement) of non-CO2 gases. In our set of scenarios, the non-CO2 mitigation potential is varied by the assumed availability and future improvements of technologies to reduce emissions from agriculture and some energy technologies.
Our scenario results indicate that the effect of limiting key mitigation technologies on cumulative CO2 emissions compatible with limiting warming to below 2 °C is about ±10%, although this estimate varies in sign and magnitude over time (figure 1).
If the availability of CO2 mitigation technologies is restricted in the long term, then 2 °C-consistent cumulative CO2 emission budgets over the 2011–2100 period are generally up to 10% higher than when assuming a full mitigation portfolio, because the required higher carbon prices will stimulate more mitigation of non-CO2 species. Another consequence of the higher carbon prices is that more CO2 mitigation is carried out in the near-term and hence cost-effective cumulative carbon emissions until 2050 are up to 10% lower.
Assuming that the full portfolio of mitigation technologies is available, the cumulative 2011–2100 CO2 budget in our scenarios in line with 2°C is 940 GtCO2 (66% chance) and 1280 GtCO2 (50% chance), respectively (table 1, figure 1). Limiting the construction of new nuclear plants has virtually no effect on the 2011–2100 CO2 budgets, which are changed by less than 1%. However, limiting land-based mitigation options increases carbon prices to achieve this budget by about 30% and increases the compatible CO2 budget by about 5% (see also section 3.3). In the absence of CCS, our model is unable to limit warming to below 2 °C with at least a 66% chance under our default (intermediate) levels of future energy demand. Only if demand is lower are these higher-probability options still possible without CCS (see, Rogelj et al 2013b, and further below). For budgets that give a 50% chance of staying below 2 °C, not relying on the future availability of CCS technologies increases carbon prices to achieve these budgets by about 90% and in turn increases 2011–2100 CO2 budgets by about 12%.
In the nearer term (2011–2050), 2 °C-consistent CO2 budgets are slightly lower instead of higher when assuming technology limitations (table 1) for the reasons given above. Limiting nuclear availability reduces the 2011–2050 CO2 budget by about 3%, limiting land-based mitigation options does so by 5–6%, and assuming no large-scale CCS does so by about 9%. This is because higher carbon prices associated with limited technology scenarios mean that more costly mitigation options are taken up earlier (before 2050) rather than later.
Qualitatively similar effects are found under our technological breakthrough cases. However, depending on the sector affected, breakthroughs can result in an increase or a decrease of the carbon budget for a given temperature limit. Assuming breakthroughs in the transportation sector yields 2011–2050 and 2011–2100 CO2 budgets that are about 7% higher and 10% lower, respectively, for having a 66% chance of staying below 2 °C. This is because lower carbon prices stimulate less near-term CO2 abatement but allow more CO2 mitigation in the long term in this sensitivity case. Assuming breakthroughs in the mitigation of non-CO2 GHGs implies CO2 budgets which are consistently higher by 12%, both in the 2011–2050 and the 2011–2100 period, because the contribution of non-CO2 gases to peak warming is reduced, and hence slightly more CO2-induced warming is permissible.
In theory, similar shifts in emission budgets are expected for a 1.5 °C limit (table 1). However, the number of scenarios reaching such a stringent level of climate protection in our set is too limited to extract robust quantitative results on these shifts.
3.2. Influence of energy-demand projections
The level of energy-demand growth over the 21st century, is another factor that is varied in our scenario ensemble. We consider three levels of future energy demand in our scenarios: low, intermediate, and high, consistent with the 'Efficiency', 'Mix', and 'Supply' scenario families, respectively, of the framework of the Global Energy Assessment (Riahi et al 2012). Also here, relationships that are qualitatively similar to the ones discussed above are found.
In scenarios assuming a high future energy demand, the single most important influencing factor in our scenarios is that CH4 emissions from the waste sector are about 50% higher in the second half of the century. Therefore, CO2 emission budgets consistent with a given temperature limit become smaller. If CO2 mitigation is assumed to be easier because of a lower future energy demand, emissions can be reduced at relatively lower cost (i.e., lower carbon price, consumption loss, etc). However, the lower associated carbon price in the energy sector also results—for similar reductions in CO2—in less concurrent CH4 mitigation in low energy-demand scenarios, at least in cases where mitigation of CO2 and CH4 is linked. On aggregate, this results in a greater relative need to reduce carbon emissions in order to achieve the same climate outcome with a given budget.
Due to the carbon-price linkage described above, 2 °C-consistent budgets of CO2 emissions from 2011 until 2100 are smaller by about 17% under high energy-demand assumptions relative to our intermediate future energy-demand case and for a 50% chance. They remain virtually the same, however, (<1% smaller) under low energy-demand assumptions (figure 1). For a 66% chance, a low energy-demand future would imply a CO2 budget that is about 6% smaller.
3.3. The cost of cumulative emissions: carbon prices and total mitigation costs
Having explored how the efficiency of 2 °C-compatible CO2 budgets can change with technology variations, which themselves are influenced by mitigation choices, we now focus on the question of how mitigation choices influence the costs of keeping emissions within a given budget (figure S3).
The carbon price associated with keeping temperature rise to below 2 °C with 66% chance assuming a full mitigation technology portfolio and intermediate future energy demand is about 37 USD in 2020. (Note that we here report year-2020 carbon prices discounted back with a discount rate of 5% to 2011, the first year the model assumes the carbon price to be effective, and report these in year-2005 USD.) The corresponding discounted total mitigation costs are about 23.5 trillion USD (table 2). Discounted total mitigation costs are computed over the entire century and relative to a scenario in absence of any mitigation.
Table 2. Costs to limit cumulative CO2 emissions to within specific budgets. Costs in terms of carbon prices (year-2020 carbon price discounted back to 2011 [2005USD]) and total discounted mitigation costs are provided [trillion 2005USD]. CO2 budgets are drawn from table 1.
| Carbon price | Mitigation costs | ||
|---|---|---|---|
| Cost from 2011 to 2050 for CO2 budget from 2011 to 2050 of 940 GtCO2 (rounded) | |||
| Central case (intermediate demand) | 37 | 23.5 | |
| Technology range (intermediate demand) | 34–669 | 22.2–33.8 | |
| Low–high energy demand range (full technology portfolio) | 16–112 | 10.5–45.5 | |
| Cost from 2011 to 2100 for CO2 budget from 2011 to 2100 of 940 GtCO2 (rounded) | |||
| Central case (intermediate demand) | 37 | 23.5 | |
| Technology range (intermediate demand) | 22-NF | 16.5-NF | |
| Low–high energy demand range (full technology portfolio) | 11–45 | 7.4–33.0 | |
| NF: infeasible to stay within budget. | |||
Costs vary strongly with technology availability and future energy demand (table 2). Carbon prices to limit emissions to within the same 2 °C-consistent CO2 budget over the entire 21st century (940–1280 GtCO2, table 1, figure S3) decrease by about 30–40% or increase more than an order of magnitude, when varying the availability of mitigation technologies. Technology limitation cases consistently increase mitigation costs while technology breakthroughs decrease costs. When varying future energy-demand projections, consistent carbon prices can decrease by about 70% (low energy demand) or up by 450% (high energy demand).
Total mitigation costs see qualitatively similar shifts (table 2). Underlying drivers that can be actively influenced by policies (for example, energy efficiency improvements) therefore appear robust means to limit mitigation costs in both the short and long term.
3.4. Integrating technology and cost information
In a final step of our assessment of the impact of policy choices on the efficiency of cumulative CO2 emissions for limiting warming below a given temperature level in a multi-gas context, we integrate all findings and explore robust features in the relationship between costs, technology dependencies and emission budgets. We find important difference between the medium term (until 2050) and the long term (until 2100).
We find that for limiting warming to below 2 °C with a given probability, lower carbon prices or mitigation costs lead to higher compatible carbon emissions budget until 2050 (figure 2). This relationship holds over all our mitigation technology variations and for each energy-demand sensitivity case. This is because high availability of technologies or low energy-demand scenarios are generally associated with lower carbon prices, which means that relatively less costly mitigation is carried out in the near term resulting in higher cumulative CO2 emissions until 2050. This also implies that emissions targets can be achieved at lower overall cost.
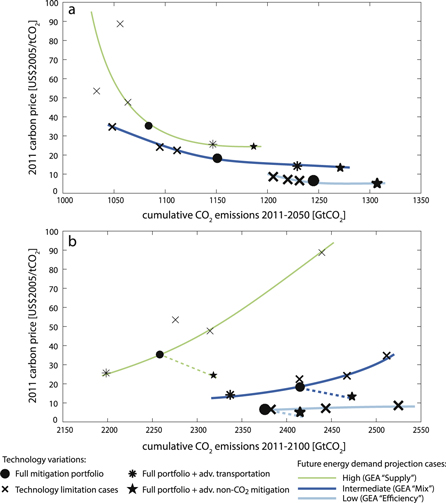
Figure 2. Integrated influence of costs and technologies on CO2 budgets consistent with limiting warming below 2 °C with 50% chance between 2011 and 2050 (panel a) and between 2011 and 2100 (panel b). Each symbol represents one unique scenario case. Symbols are grouped with coloured features based on the future energy-demand assumptions that underlie the scenarios (based on the Global Energy Assessment—GEA, Riahi et al 2012). Coloured features in the figures are visual guides to highlight data points which are grouped together, but do not represent quantitative data. Costs are provided as year-2020 carbon prices discounted back (discount rate 5%) to 2011. Total mitigation costs are given in figure S4. For clarity only 2 °C scenarios with 50% chance are shown, but consistent features can be seen for other probability levels in spite of a lower amount of scenarios being available (figures S5-6).
Download figure:
Standard image High-resolution imageHowever, looking further until the end of the century this relationship changes. Within each energy-demand category, scenarios that assume limited availability of technology have, as noted above, larger consistent cumulative CO2 emission budgets until the end of the century, as much higher carbon prices drive more abatement of non-CO2 gases. However, these higher prices nonetheless result in higher overall mitigation costs despite the slightly greater carbon budgets. Vice versa, scenarios with breakthroughs in the electrification of the transport sector give smaller CO2 budgets because they are able to remove more CO2 from the atmosphere by 2100, but they are able to achieve these smaller budgets at lower costs. A different relationship arises where the technology breakthrough is for advanced mitigation of non-CO2 gases. This case results in both higher cumulative CO2 emission budgets over the 21st century and lower overall costs, as more low-cost abatement is provided from non-CO2 sectors. This further confirms the important influence of long-term non-CO2 abatement potentials for allowable cumulative CO2 emissions and overall abatement costs.
4. Discussion and conclusions
Our integrated assessment of CO2 budgets consistent with limiting warming to below 2 °C provides a few key insights. Importantly, our study reinforces the general understanding that cumulative CO2 emissions largely determine peak warming, and that a limit on cumulative carbon emissions is required to stabilize global-mean temperature rise. Furthermore, we have shown that some of the uncertainties surrounding the anticipated ability of a given cumulative CO2 budget to limit warming to below 2 °C are influenced by non-CO2 abatement and hence specific policy choices, as are the costs for achieving those budgets.
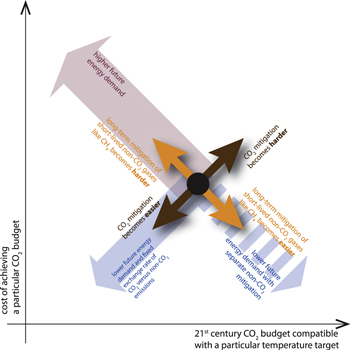
Within the cost-minimizing framework of the IAM scenarios that we assess here, some general conclusions can be drawn for 21st-century budgets compatible with limiting warming to below 2 °C (figure 3). These conclusions are driven by interactions between CO2 and non-CO2 mitigation. Cost-effective allocation of emission budgets over the entire 21st century in addition results in variations between the near and the long term. The linkage between CO2 and non-CO2 mitigation in MESSAGE is very comparable the behaviour of other IAMs (figure S7). Therefore, it is anticipated that also other IAMs will find qualitatively similar results.
Figure 3. Overview of general influence of policy choices on costs and size of CO2 emissions budget during the 21st consistent with limiting warming to below a particular temperature level. Starting from the black dot in the centre, policy choices push the consistent carbon budget in different directions. Note that for CO2 budgets until 2050, the CO2 mitigation arrow would be rotated by 90° clockwise (see figure 2—panel a).
Download figure:
Standard image High-resolution image
Policy choices that limit the long-term mitigation potential of CO2 (but do not significantly affect non-CO2 mitigation) imply slightly greater budgets to 2100 as higher carbon prices drive stronger mitigation of non-CO2 GHGs. Reducing CO2 mitigation technology availability results in larger costs, even though the allowable CO2 budget over 2011–2100 is slightly greater. By contrast, policy choices that expand the CO2 mitigation potential would—everything else remaining equal—result in compatible CO2 budgets that are smaller over the 21st century but can be met at lower costs. These variations make the budget vary with about 10% around its default value. Costs vary much more than the consistent emission budgets.
Even if 21st-century carbon budgets are higher, CO2 emissions are reduced more rapidly in the near term in scenarios which assume fewer CO2 mitigation options. This is because less CO2 mitigation options result in lower maximum attainable emission reduction rates over the century. Our cost-effectiveness framework thus allocates more abatement until 2050, to leave more space for higher emissions in the long term.
In our modelling framework, policy choices that increase or decrease energy demand relative to an intermediate baseline both result in slightly smaller consistent CO2 budgets to 2100, but for different reasons. Under high future energy demand, baseline non-CO2 emissions also increase, resulting in lower consistent CO2 emissions budgets. Under low future baseline energy demand, baseline non-CO2 emissions are lower and this would suggest larger compatible CO2 budgets. However, mitigating CO2 becomes much cheaper in a low energy-demand world. When applying a fixed exchange rate between non-CO2 GHGs and CO2, relatively less non-CO2 mitigation therefore occurs in our modelling framework. This relationship might be more complex in the real world as countries do not necessarily apply the same carbon prices and relative costs to CO2 and non-CO2 emitting sectors (Johansson and Persson, 2005).
The interaction between cumulative CO2 emissions and emissions of non-CO2 gases, particularly CH4 can be condensed into a fairly simple conclusion: the greater the abatement of CH4 during the time of peak warming, the larger the CO2 budget compatible with a given temperature limit. However, the interaction between CH4 and CO2 abatement via a common price of carbon is strongly dependent on how CO2 and CH4 are assumed to be linked. While most IAMs use 100 year GWPs, other metrics like dynamic Global Temperature-change Potentials (Shine et al 2007) give a time-varying weight to CH4 abatement, which would result in less CH4 abatement initially, but more abatement later on, and thus could allow for a greater carbon emissions budget (Reisinger et al 2012). A recent study indicated that alternative metrics have only a limited effect on the 2010–2100 CO2 budget (Strefler et al 2014), but more research would be required to quantify this effect more precisely. Emissions reductions of CH4 clearly can complement (but not substitute) a limit on cumulative CO2 emissions to enhance the probability of limiting warming to below 2 °C (Rogelj et al 2014c). This underlines the importance of research striving to expand the mitigation potential of currently hard-to-mitigate sources, such as CH4 from enteric fermentation, and to manage demand for CH4-intensive products (see Smith et al 2014).
In summary, our study quantifies the extent to which the carbon budget consistent with the 2 °C limit depends—in parts counterintuitively—on policy choices that influence future CO2 and non-CO2 mitigation technology availability, and future energy demand. We conclude that such policy choices will either constrain or relax the size of the remaining carbon budget for the 21st century. These variations are of the order of about 10%. For temperature stabilization, it is indispensable that annual carbon emissions reach zero levels globally. The carbon budget variations we identified here thus only gain importance once a break-away from current emission trends (Friedlingstein et al 2014) has been achieved. However, an early appreciation of how carbon budgets depend on technology options can help shape today's mitigation policies in a multi-gas context so that the available carbon budget is influenced and used in the most desired way.