
Abstract
A biomimetic robot inspired by Cyanea capillata, termed as 'Cyro', was developed to meet the functional demands of underwater surveillance in defense and civilian applications. The vehicle was designed to mimic the morphology and swimming mechanism of the natural counterpart. The body of the vehicle consists of a rigid support structure with linear DC motors which actuate eight mechanical arms. The mechanical arms in conjunction with artificial mesoglea create the hydrodynamic force required for propulsion. The full vehicle measures 170 cm in diameter and has a total mass of 76 kg. An analytical model of the mechanical arm kinematics was developed. The analytical and experimental bell kinematics were analyzed and compared to the C. capillata. Cyro was found to reach the water surface untethered and autonomously from a depth of 182 cm in five actuation cycles. It achieved an average velocity of 8.47 cm s−1 while consuming an average power of 70 W. A two-axis thrust stand was developed to calculate the thrust directly from a single bell segment yielding an average thrust of 27.9 N for the whole vehicle. Steady state velocity during Cyro's swimming test was not reached but the measured performance during its last swim cycle resulted in a cost of transport of 10.9 J (kg ⋅ m)−1 and total efficiency of 0.03.
Export citation and abstract BibTeX RIS
1. Introduction
Underwater surveillance through autonomous underwater vehicles (AUVs) has been limited by factors such as operation time, depth and range. Existing AUVs that can operate for extended periods of time have limited operational depth. For example, the Wave Glider (Liquid Robotics) can operate almost indefinitely but is limited to operation on the surface. Conversely, the REMUS 100 and REMUS 6000 can reach depths of 100 and 6000 m respectively but can only operate for a period of approximately 8 and 12 h respectively. A combination of long operation time and high efficiency would result in a vehicle that could perform more demanding tasks and reduce operation cost. If a vehicle's operation time is short, an entire crew and servicing vehicles must attend to the AUVs deployment, operation and recuperation in remote sea locations. Nature has already developed mechanisms and methods to achieve this desired level of performance. Different species of fish and mammals are able to swim for extended periods of time, reach high depth and travel long distances. Whales are able to reach depths greater than 1800 m (Tyack et al 2006) and tunas have been known to swim over 5800 km during migration (Stokesbury et al 2007). One particular type of animal that can swim with low energy cost and reach depths down to 7000 m is the medusa (Kramp 1959). This meets many of the criterions set forth for future generation AUVs.
Medusa also known as jellyfish, can be categorized by their propulsion mechanism (Dabiri et al 2005). Rowing jellyfish are known to be more efficient swimmers in comparison to jetters (Sahin et al 2009, Dabiri et al 2010). In rowers, the interaction of starting and stopping vortices results in larger thrust and hydrodynamic efficiency (Dabiri et al 2005). Additionally, this propulsion method is responsible for their feeding mechanism. As jellyfish swim, they capture prey from the same water flow that is used to create thrust. The microscopic preys get caught and immobilized in the tentacles from where they are transported to the mouth and digested. Jellyfish are able to travel using very little energy even though their oscillating mode of propulsion is not necessarily the most efficient in terms of hydrodynamics. Jellyfish Froude efficiency ranges from 0.09–0.53 (Dabiri et al 2010), compared to approximately 0.8 in fish (Webb et al 1984, Videler and Hess 1984). Froude efficiency is the ratio of useful power to useful power and induced power (Alexander 2003):
where v is the vehicle velocity and vw is the water velocity driven backwards. The useful power here is the thrust produced by the vehicle times the vehicle velocity. The induced power is the rate at which kinetic energy is added to the wake. The cost of transportation (COT) can be used to determine how much energy is required to transport a mass for a unit of distance. While the Froude efficiency accounts for hydrodynamic losses, the COT accounts for all vehicle losses required for locomotion. The COT is calculated as:
where P is the input power and m is the vehicle mass. The COT for a 0.8 kg Stomolophus meleagris and Aurelia aurita is 0.87 J (kg ⋅ m)−1 and 0.49 J (kg ⋅ m)−1 respectively (Larson 1987, Gemmel et al 2014). Comparatively, the COT for fish and runners the same mass is approximate 1.29 J (kg ⋅ m)−1 and 11.5 J (kg ⋅ m)−1 respectively. The projected COT for a Stomolophus and an Aurelia the same mass as Cyro (76 kg) is 0.47 J (kg ⋅ m)−1 and 0.38 J (kg ⋅ m)−1 respectively. Though the COT for Cyanea capillata is not currently available, it is likely to fall somewhere between the Stomolophus and Aurelia since it is a rower which swims at lower frequency like the Aurelia and has a tentacle type oral structure as opposed to a filter oral structure as the Stomolophus. The low COT of jellyfish is mainly due to their low metabolic rate. The dual function locomotion and feeding mechanism makes the animal even more energy efficient but foraging is not taken into the calculation of COT. The foraging aspect of jellyfish propulsion may be of interest in robotic applications where filtering is required such as for energy harvesting, sensing and cleaning. The jellyfish's low energy consumption comes in great part from its low metabolic rate. Larson (1987) quantified the metabolic rate by measuring the weight specific respiration rates which he found to be 48 mL (h ⋅ kg)−1 for active medusae.
An AUV capable of such low energy consumption is highly desirable for military and civilian applications. The objective of our research is to design an AUV that mimics the morphology, motion and performance of jellyfish. In this paper, we focus on replicating the kinematics of the Cyanea capillata with Cyro to achieve similar hydrodynamic performance while keeping the same general morphology. Large dimensions were chosen for the vehicle for multiple reasons. Efficiency increases with size and payload room also increases. Additionally, little is known on how scale affects the hydrodynamics of jellyfish propulsion for sizes over 100 cm in diameter.
In most cases jellyfish have a uniform bell, implying that it is nearly axi-symmetric. A jellyfish bell shown in figure 1, consists largely of mesoglea which is a very soft gel-like material enclosed by epidermis. The bell also houses sensory organs called rhopalia and digestive organs called gonads. The swimming muscles are located in the region under the bell called subumbrella. Jellyfish are limited in their muscle structure as they only have a single layer of swimming muscles. Tentacles passive in motion extrude from the bell margin or from the subumbrella and are primarily used for capturing prey (Mayor 1910). Jellyfish consists of more than 95% water (Lowndes 1942) and are nearly neutrally buoyant.
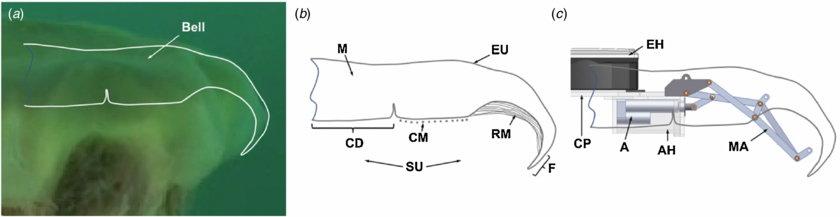
Figure 1. (a) Image of a 50 cm C. capillata in ocean water with digitized profile. The exumbrella was digitized directly from the image shown and the subumbrella profile was approximated based on Gladfelter's (1973) anatomical analysis. (b) Schematic of a C. capillata cross-section showing the mesoglea (M), exumbrella (EU), central disc (CD), circular muscles (CM), radial muscles (RM), flap (F) and subumbrella (SU). (c) Mechanical arm (MA) with linear actuator (A), actuator housing (AH), central plate (CP) and electronics housing (EH). A superposition of the C. capillata subumbrella and exumbrella profiles shows the robotic analogues to the different anatomical parts.
Download figure:
Standard image High-resolution imageSeveral vehicles inspired by jellyfish have been reported in literature (Guo et al 2003, Yang et al 2007, Villanueva et al 2009, Yeom and Oh 2009, Najem et al 2012, Nawroth et al 2012, Marut et al 2012). The designs of these vehicles are mainly a function of the actuators employed for achieving deformation. Limitations in mimicking the morphology and maintaining biomimetic kinematics are related to the difficulty in replicating the circular contraction of jellyfish. Jellyfish are capable of contracting their subumbrellar muscles up to 50% (Villanueva and Priya 2010) which results in uniform deformation of the bell during swimming. In addition to the small form factor in which a jellyfish is able to achieve this deformation, the flexible nature of its body creates a difficult engineering challenge. The flexible structure of jellyfish prevents the need for parts moving about each other. It also allows deformation to occur in the elastic regime of the material and elastic energy to be stored at very low losses during contraction for the relaxation phase. This prevents frictional losses commonly found in propulsion mechanism that use rigid structures. Jellyfish robots reported in literature are smaller than approximately 17 cm in diameter even though some jellyfish can reach dimension over an order of magnitude greater.
Bell segmentation helps alleviate mechanical issues that occur when trying to replicate a uniform bell with artificial materials. In a previous study (Villanueva et al 2011), Robojelly was developed to mimic the Aurelia aurita species which has a uniform bell structure. Radial actuators were used to deform the Robojelly bell as opposed to circular actuators utilized by A. aurita. Circular actuation is currently not feasible given current actuator technology when considering energy consumption and form factor. Deforming a uniform bell with a discrete number of radial actuators causes a folding effect in the bell material between each actuator. The Cyanea capillata species has a naturally occurring segmented bell design (Mayor 1910, Kramp 1961, Russell 1970) which can be replicated more authentically than a uniform bell given current limitations in actuator technology. The effects of bell segmentation on the resulting hydrodynamics have not been quantified in literature. It is possible that segmentation is a contributing factor allowing C. capillata to become some of the largest jellyfish found in nature. Cyro was developed and characterized with intent to serve as a research platform to further the understanding on hydrodynamic, kinematic and morphology traits of this particular species and large medusa in general.
2. Design and fabrication
Cyro was designed to be modular for the ease of accessing the mechanical and electrical components as required for parametric studies. The actuator housing was more prone to water leaking then the electronic boxes due to the active motion of the actuators. Thus, separating the actuator housing prevented water leaks from reaching the electronics. Another motivation for modularity is the reduction in complexity for fabrication. Initially, a central hub design was considered for housing all the electronics and actuation mechanism. The large scale of the vehicle caused issues with fabricating a large central hub that could accomplish all the required functions. The vehicle modules included the actuation mechanism, electronics, artificial mesoglea, central plate, mechanical arms and actuator housing as shown in figures 1–3. There are eight arm assemblies representing the eight C. capillata bell segments. Each arm assembly comprises of a mechanical arm, actuator and actuator housings that attach to a central plate. The electronics housing is positioned at the center of the vehicle and clamped on the central disc. The artificial mesoglea consists of a large single piece of silicone and is attached to the mechanical arms and central plate. The artificial mesoglea is passive and is responsible for generating the hydrodynamic forces which propel the vehicle. The design and fabrication of the mechanical arm, artificial mesoglea and vehicle assembly are described in the following subsections while the electronics, actuator boxes, central plate and electronics box are described in the appendix.
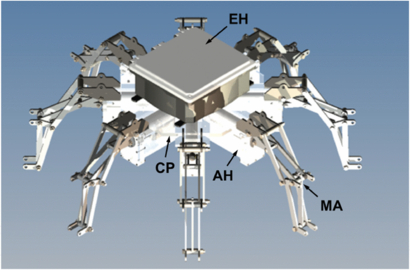
Figure 2. CAD model of Cyro without the artificial mesoglea. Shown in the figure are the electronics housing (EH), mechanical arms (MA), actuator housing (AH) and central plate (CP).
Download figure:
Standard image High-resolution image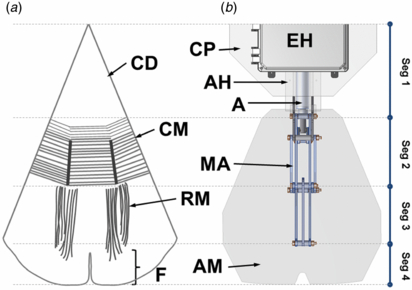
Figure 3. (a) Anatomical schematic of the bottom view of a C. capillata bell section (1/8th). This image is redrawn from Gladfelter (1973) and the labels are described as circular disc (CD), circular muscle (CM), radial muscles (RM) and flap (F). (b) CAD drawing showing the bottom view of a robotic bell segment that includes the artificial mesoglea (AM), mechanical arm (MA), actuator (A), actuator housing (AH), electronics housing (EH) and central plate (CP). The side-by-side comparison of C. capillata and robotic bell segment shows the robotic analogues to the different anatomical parts for each segment (Seg).
Download figure:
Standard image High-resolution image2.1. Mechanical arms
Limitations in actuator technology prevent a direct substitution of artificial actuators in biomimetic robots to achieve the same function and morphology as natural muscles. Therefore, other actuation strategies need to be employed in order to mimic the motion and morphology of natural animal. Gladfelter (1973) analyzed the locomotion system of the C. capillata. The C. capillata uses two different sets of muscles to swim; circular muscles (CM) and radial muscles (RM). Gladfelter observed that the CM were first to contract followed by the RM at the beginning of a swim cycle. The CM brought the bell from a near horizontal angle to 45° while the RM deformed it to near 90°.
A kinematic analysis of the C. capillata bell by Villanueva et al (2013) provides details on the function of the different anatomical parts during swimming. In this prior study, the animal analyzed was 50 cm in bell diameter and was filmed in the Atlantic ocean off the Norway shore. This video is a representation of the largest Cyanea capillata we could obtain and extract kinematics for design inspiration of Cyro. The kinematic analysis was made using a four-segment representation of the C. capillata exumbrella. Segments here represent discretized sections of the bell exumbrella as opposed to bell segments which refer to the eight 'arms' of the C. capillata. The exumbrella is the outer surface of the bell as shown in figure 1(b). In this model, segment 1 is the analogue to the central disc (CD) which is a passive region at the center of the mesoglea as shown in figures 1 and 3. Segment 2 and 3 are the analogues to the CM and RM respectively. Segment 4 is analogous to the flap (F) which is a passive section of mesoglea that spans from the end of the RM to the bell margin.
2.1.1. Arm kinematics
The kinematics of the natural animal was analyzed in terms of the angle formed between two exumbrella segments as shown in figure 4. The CD angle (θ1) is formed between the horizontal and segment 1. The circular muscle angle (θ2) is formed between segment 1 and 2, and so on. See Villanueva et al (2013) for a clear depiction of the angles and their behavior as a function of time. The total cycle time of this animal was found to be 5.4 s with a contraction time of 2 s, cruise time of 1 s and relaxation time of 2.4 s. It was found that the circular muscles initiate contraction with a total change in angle of 42°. When contraction begins, the RM and flap are still relaxing. The RM started to contract 0.6 s after the circular muscles and decreased its angle by 20°. The passive CD also underwent a 20° decrease due to the compliance of the structure resulting from the actuation of both muscle sets. The flap conversely, undergoes an increase in angle during contraction. This is seen as a flaring outward geometry during contraction (figure 4, t = 2.6 s and 3 s). A 1 s 'cruise time' is present after contraction where the bell holds its contracted position (figure 4, t = 4.6 s). This is followed by the relaxation phase which is initiated by the circular muscles whose angle starts increasing (figure 4, t = 1.2 s). At that moment, the CD angle also increases but the RM angle further decreases. This could be due to further muscle contraction or the hydrodynamic forces overpowering the elastic energy of the structure as it relaxes. The flap follows a similar trend as the RM segment. The flap angle decreases for the first 2 s of relaxation and then starts increasing.
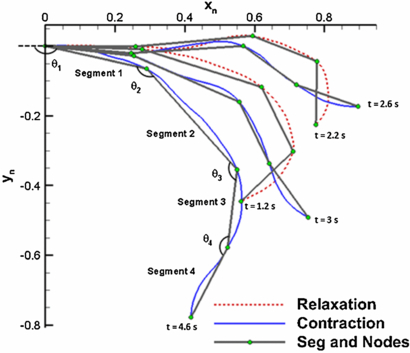
Figure 4. Selected C. capillata exumbrella profiles during contraction and relaxation over a swimming cycle. The cycle begins with relaxation, and the time at which each profile occurs is labeled. Segments and nodes were found using the optimization node detection method described in Villanueva et al (2013). The angles formed between segments for kinematics analysis are labeled. The x- and y-axis positions values normalized by exumbrella half arclength in the relaxed position. This image is redrawn from Villanueva et al (2013).
Download figure:
Standard image High-resolution imageFor Cyro, the number of actuators was minimized while keeping control over the eight different bell segments. The mechanisms considered for replicating the circular contraction based on linear or rotary actuators resulted in overly complex and energy consuming designs. A system consisting of one linear actuator and a mechanical arm per bell segment resulted in the desired performance and fitted within the space constraints of the C. capillata morphology as shown in figures 1 and 3. Eight independent control platforms are therefore present on the vehicle.
2.1.2. Arm design
The CD (segment 1) is passive and undergoes the least amount of rotation in a swimming cycle. This region of the mechanical system was set as a fixed segment as shown in figures 1(c) and 3(b) which provides a mounting location for the rigid components of the vehicle. The fixed segment is covered by mesoglea which is free to move passively similar to the natural animal. The circular muscles (segment 2) are replaced by the mechanical arm and linear actuator which directly actuates this segment as shown in figures 1(c), 3 and 5. CAD images of the mechanical arm are shown in figure 5 with the arm in the contracted (a) and relaxed positions (b) along with and image of a physical arm in the relaxed position in figure 5(a). The mechanical arm in this segment consists of a four-bar mechanism as shown in figure 5. The RM (segment 3) are replaced by the mechanical arm which actuates this section of the bell also based on the motion of the four-bar mechanism as shown in figures 1(c), 2 and 3(b). The different joints are labeled in figure 5(a) with letters (A–H) and the different links can be described by their limiting joints such as LBC which is the link between joints B and C. The arm is connected to a linear actuator (PA-14-4-50, progressive automations) (LAB) by a transfer link (LBC) as shown in figures 5(a), (b) and 10. The flap region (Segment 4) is replaced by passive artificial mesoglea extending past the mechanical arm. The lag in segment 3 and 4 during relaxation is critical for the reproduction of the hydrodynamics of the C. capillata. The mechanical arm was designed with added passivity in segment 3 in order to replicate this motion. The passive link consists of a slotted link (LGH), as shown in figures 5(a), (b) and 6 which allows the segment to move further inwards during relaxation. A string attaches to LGH near joint G and becomes taut as the arm fully relaxes. This causes tension on the slotted link and pulls segment 3 to a fully relaxed position. Segment 4 is designed to passively replicate the lagging effect using the compliance of the artificial mesoglea.
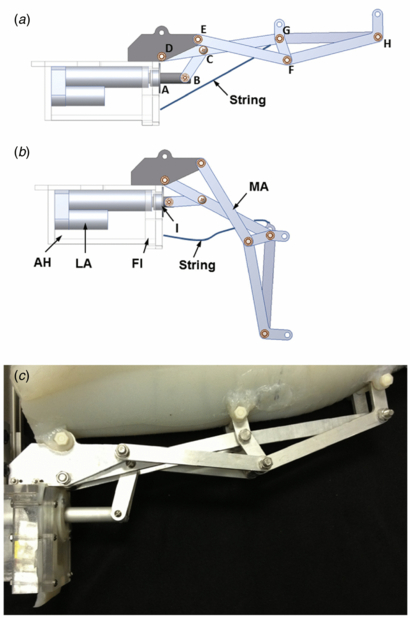
Figure 5. Mechanical arm (MA) in the (a) relaxed and (b) contracted positions. Also shown is the actuator housing (AH), linear actuator (LA), flange (Fl) and insert (I). (c) Picture of the assembled mechanical arm, actuator housing and artificial mesoglea.
Download figure:
Standard image High-resolution image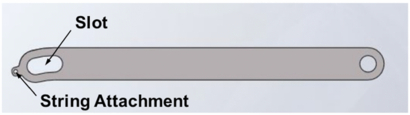
Figure 6. Slotted link (LGH) for added passivity in segment 3 during relaxation. The string attachment allows the link to regain its fully relaxed position as the rest of the arm relaxes.
Download figure:
Standard image High-resolution image2.1.3. Joint detection
The C. capillata has natural joints which are indentations in the mesoglea to reduce the force required for deformation. Mechanical joints in Cyro serve a similar purpose as they allow motion of the linkage system. The link lengths were determined based on joint location. Three joint detection methods were developed to find possible mechanical joint locations for Cyro's design. Joint locations are quantified in terms of exumbrella arclength from the apex divided by half the exumbrella arclength in the relaxed position. The first joint detection method consists of analyzing the anatomy of a small C. capillata in Gladfelter (1973) (with exact diameter unknown). The properties and functions of anatomical feature led to four possible mechanical joint locations. The anatomical feature locations were measured with animal laid flat on its exumbrella. Arclength were measured from the center of the bell and turned into percentages by normalizing by the total subumbrella arclength measure from the center. At 40% subumbrella arclength, a circular joint in the mesoglea separates the CD and circular muscles. This location is prone to deformation and is considered as a good location for a mechanical joint analogue. Similarly, at 64% there is a transition between the circular muscles and RM. The change in actuator type is also a location prone to more deformation. Lastly, at 88% is the end point of the RM and beginning of the flap. This location marks a transition from a passive to an active region and was also chosen as a mechanical joint location. In addition, the lack of muscles in the passive region causes the flap to be more compliant which affects its dynamics during swimming. The second method consists of finding the areas of the exumbrella with largest curvature over a full cycle. Exumbrella profiles over two full swimming cycles were obtained through video digitization of the natural animal in a previous study (Villanueva et al 2013) An example of exumbrella profile with reconstructed subumbrella profile is shown in figure 1(a). Kinematic artifacts due to the rotation of the animal and motion between the camera and animal were corrected using a video correction technique as described in Villanueva et al (2013). The curvature method resulted in joints at 36%, 64% and 82%. The third method consists of an error analysis between a discrete bell model and the natural exumbrella profiles. The error analysis method resulted in joint locations at 26%, 60% and 80% which are illustrated in figure 4 and listed in table 1 along with the results of the other joint detection methods. The joint locations from the error analysis method give the most accurate representation of the natural kinematics. However, this method does not take into account several factors relevant to vehicle design such as material properties and structural mechanics involved in recreating the kinematics. It assumes that the joints will be placed on the exumbrella. This is also true for the curvature joint detection method. In the case of Cyro, a rigid mechanical structure deforms the artificial mesoglea which is located above the structure. In other words, the joint will be located closer to the subumbrella as in the natural animal then the exumbrella as assumed in the optimization method and curvature method. Therefore, the anatomical joint detection method should provide a better prediction for the location of Cyro's mechanical joints. The subumbrella arclength percentages found from the anatomical analysis were used directly to establish the joint locations on the mechanical arm.
Table 1. Joint locations as determined by the C. capillata anatomy from Gladfelter (1973), the C. capillata curvature joint detection method and the C. capillata error analysis joint detection method from (Villanueva et al 2013). Mechanical joint locations of the mechanical arm (Cyro arm) are given assuming a flap length of 12%. The joint locations measured on the artificial mesoglea (Cyro exumbrella) are also shown. Joint locations are given in percentages of exumbrella arclength and relaxed position. Joint 1 for all methods is taken at 0% which corresponds to the bell apex. The last joint is at the bell margin (100%).
| Joint detection method | Joint 2 | Joint 3 | Joint 4 |
|---|---|---|---|
| C. capillata anatomical | 40 | 64 | 88 |
| C. capillata curvature | 36 | 64 | 82 |
| C. capillata error analysis | 26 | 60 | 80 |
| Cyro arm | 38 | 65 | 88 |
| Cyro exumbrella | 39 | 66 | 88 |
The chosen joint locations for Cyro's mechanical arm design were based on the anatomical joint detection method and are shown in table 1. The error between the robotic and natural jellyfish only resulted in a maximum of 3% error using this method. The lengths of each link from joint to joint used to construct the mechanical arm are shown in figure 5 and listed in table 2. The linkages were made of 0.64 cm thick aluminum sheets and were milled out using a CNC. Stainless steel bolts and aluminum spacers were used at the joints. The resulting mechanical arm is shown in figures 5(c).
Table 2. Lengths of the different links in the mechanical arm between joints. Link LAB represents the linear actuator which changes length from 0.64 to 4.45 cm.
| Link | Length (cm) |
|---|---|
| LAB | 0.64–4.45 |
| LBC | 8.36 |
| LCD | 10.03 |
| LDA | 5.12 |
| LDE | 7.59 |
| LEF | 17.27 |
| LFG | 4.32 |
| LGD | 22.53 |
| LGH | 18.59 |
| LFH | 17.72 |
2.2. Artificial mesoglea
The artificial mesoglea was designed based on thickness percentages from Gladfelter (1973), and Dawson (2005). The dimensions were scaled assuming a linear trend with bell diameter. Cyro's bell diameter was chosen to be 170 cm which was determined by the dimension of the selected motors, mechanical architecture and objective vehicle dimension. Each bell segment was fabricated individually along with the central hub. Individual bell segments were further divided into four separate sections in order to create the 3D shape shown in figure 7. Figure 7(a) shows the complex geometry of the C. capillata in the relaxed position and figures 7(b) and (c) show a CAD model of the artificial mesoglea with individual pieces color coded. Molds were created for each section by milling the proper geometric cavities from lumber blocks. The individual artificial mesoglea sections were made out of Ecoflex 0010 (smooth-on) silicone. This material was chosen because of its mechanical properties and its casting characteristics. This silicone is soft and has a density of 1040 kg m−3 which is close to that of water (1000 kg m−3) and helps achieve the neutral buoyancy of the vehicle. This material was also chosen because of its tear strength of 3850 N m−1, which adds to the robustness of the vehicle. When assembled, the bell segments have a concave geometry with cavity in the subumbrella to promote the same folding effect during relaxation and the same expansion during contraction.
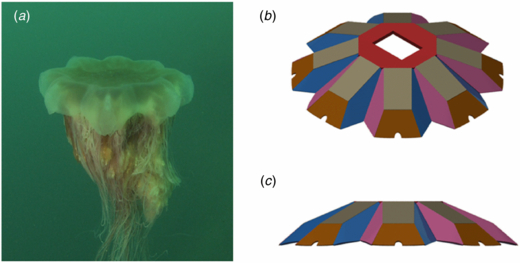
Figure 7. (a) C. capillata in the relaxed position. CAD model of the artificial mesoglea, (b) isometric and (c) front view. The different colors of the artificial mesoglea represent the sections fabricated separately.
Download figure:
Standard image High-resolution image2.3. Full vehicle assembly
Cyro is fully autonomous with electronics and battery (HHR300 SCP, Panasonic) stored onboard as described in the appendix. A CAD model of the fully assembled vehicle and an image of the actual vehicle are shown in figure 8. The center of mass (CM) and center of buoyancy (CB) were designed to keep the vehicle stable during upward swimming. This was achieved by designing the CM to be lower than the CB by a distance of 7.87 cm. Table 3 lists the buoyancy force for each component. Negative buoyancy means the component sinks. The results show that the vehicle was made negatively buoyant so that any thrust produced would be a result of propulsion and not positive buoyancy. The vehicle's moments of inertia were taken about the CM and are reported in table 4. Buoyancy forces and moments of inertia were obtained using the CAD model which was made in Inventor (Autodesk). The chosen coordinate system is centered at the CM and is shown in figure 9.

Figure 8. (a) CAD model of Cyro, and fully assembled Cyro deployed in water showing a view of the (b) subumbrella and (c) exubrella.
Download figure:
Standard image High-resolution image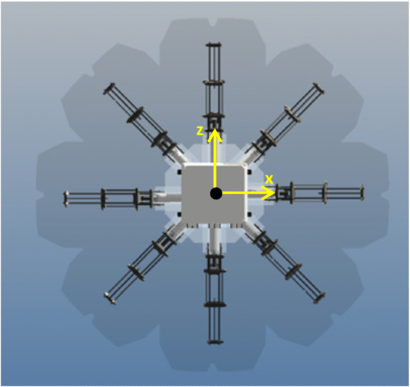
Figure 9. Coordinate system of the vehicle centered at the CM. The y-axis points into the page.
Download figure:
Standard image High-resolution imageTable 3. Specification for the different components on Cyro.
| Component | Volume (cm3) | Mass (kg) | Buoyancy force (N) |
|---|---|---|---|
| Mesoglea Bell | 36 964 | 38.41 | −15.12 |
| Electronics box/wires | 10 219 | 7.79 | 23.57 |
| Arm assembly (x8) | 17 711 | 25.28 | −74.73 |
| Center plate/fasteners | 2452 | 3.71 | −12.45 |
| Arm/tentacles | 115 | 0.45 | −4.00 |
| Buoyancy foam (top) | 9349 | 0.32 | 88.52 |
| Buoyancy foam (bottom) | 1688 | 0.09 | 15.57 |
| Totals: | 78 498 | 76.06 | 21.35 |
Table 4. Moments of inertia (kg cm−2) calculations for the full vehicle with respect to vehicle's CM and coordinate system shown in figure 9.
| Ixx = 82 208.33 | Ixy = 35.12 | Ixz = 49.75 |
| Iyx = 35.12 | Iyy = 144 681 | Iyz = −3031.75 |
| Izx = 49.75 | Izy = −3031.75 | Izz = 82 237.6 |
3. Methods and materials
3.1. Mechanical arm model
An analytical model of the mechanical arm design was derived in order to analyze the arm kinematics and adjust the design parameters if needed. The mechanical arm can be modeled as a set of rigid links that pivot about joints. A simplified representation of the link and joint mechanism is shown in figure 10. The arm mechanism can be split into three different sections acting on a 2D plane. The first section consists of points A–D and is referred as the translating mechanism. Link AB (LAB) consists of a linear actuator which drives the arm and LDA is fixed. The section defined by points D–G is a four-bar mechanism. The section defined by points FGH is passive and contains a link (LGH) which is a slotted link as shown in figure 6. The slotted link was considered as a regular link with a prescribed elongation during simulation ranging from 0.64 to 4.45 cm. The analytical model solves the mechanical arm by separating it into its three sections. Refer to the appendix for a full derivation of the mechanical arm analytical model.

Figure 10. Diagram of the arm mechanism model. Joint locations are labeled by letters A–H while the links are labeled by L and the joints bounding them (i.e. LAB). LBD is an artificial link used only for computation. Angles θ1–θ4 and ϕ3–ϕ8 are the angles formed by links. Angles a–e are angles used for computation. The coordinate system shown is the global coordinate system used for solving the arm model.
Download figure:
Standard image High-resolution image3.2. Thrust quantification
A thrust stand was developed to quantify the forces produced by a single bell segment during swimming. This can be extrapolated to approximate the thrust produced by the full vehicle which provides an assessment of the vehicle's capability to propel itself. Design requirements for the thrust stand included the ability to measure force underwater and to isolate the x- and y-components of force during contraction and relaxation. Figure 11 shows a free body diagram of the force created by the bell segment during actuation along with a schematic and experimental setup of the thrust stand.

Figure 11. (a) Schematic of the thrust stand showing the rollers, ball and socket joint, journal bearings and load cells. (b) Image of the experimental setup with thrust stand and bell segment in water. (c) Close-up view of the thrust stand.
Download figure:
Standard image High-resolution imageThe thrust stand design consists of two vertical 110 kg S-load cells (LC101–250, Omegadyne) for measuring the force in the y-direction. Each vertical-load cell is on a slider at one end and on bearings at the other. This provides a degree of freedom in the x-direction and about the z-axis. One 23 kg S-load cell (LC101–50, Omegadyne) measures force in the x-direction. This load cell is positioned on a ball joint which allows rotation about the x-, y- and z-axis. This design assumes small displacement in the y-direction and neglects the effects of friction at the supports. The load cells are kept out of water and the forces are distributed through t-slotted aluminum beams of 3.8 × 3.8 cm in cross-section. The y-component of force is the sum of both y-direction load cells. The x-component of force is measured directly by the 23 kg load cell. The hydrodynamic center and CM movement of the mechanical arm over an actuation cycle significantly change the direction of the reaction forces causing oscillation in the system. The two-vertical-load cell setup adds stability and reduce oscillation as the arm rotates. This thrust stand also prevents the need for submerging force measuring devices. The output of the load cells were recorded with a data acquisition card (NI 9215, National Instruments) at a sampling rate of 1000 bits per second (bps). A hundred samples were averaged giving 10 samples per second which were then filtered with a second order low pass Butterworth filter. The 56 × 50 × 3 cm3 bell segment was tested in a tank measuring 170 × 150 × 80 cm3.
3.3. Swim testing and kinematics tracking
The vehicle was tested for its ability to swim vertically and autonomously. This test was conducted in a swimming pool which had a 120 cm shallow end and a 420 cm drop off. See figure 12 for a schematic of the test setup. A camera (HDR-CX260, Sony) in an underwater case (SPK-HCG, Sony) was setup on a tripod positioned in the shallow end and recorded the vehicle kinematics at 30 fps. A 23 cm diameter buoy was used to keep the vehicle steady at a depth of 182 cm before actuation. The buoy was attached to the vehicle via a rope and four attachment points on the central plate. The rope was kept slack during active testing to prevent the buoyancy force from the buoy to act on the vehicle. The camera and its weighted tripod were placed on the flat surface of the shallow end of the diving well.
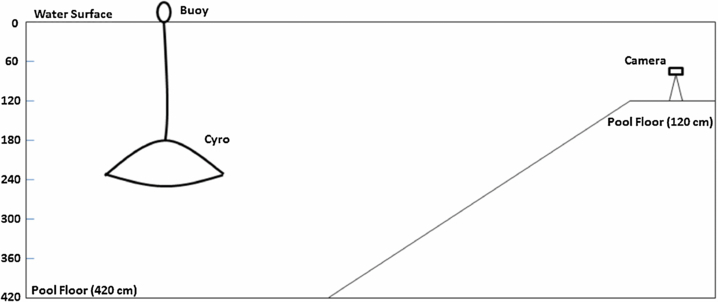
Figure 12. Schematic representation of the indoor pool used for vehicle testing. The objects in the image are not to scale. The deepest part of the pool is 420 cm and accounts for the majority of the pool area. The camera was positioned on a shallow 120 cm section of the pool.
Download figure:
Standard image High-resolution imagePreliminary testing inside the pool was done to determine suitable operating parameters for swimming. The following sets of parameters were varied: relaxation rate, relaxed pause time, contraction rate and cruise time. Relaxation rate is the rate at which the bell opens. Relaxed pause time is the time spent in the fully relaxed position. Contraction rate is the rate at which the bell closes. Cruise time is the time spent in the fully contracted position. A LabView (National Instruments) program was developed and utilized to vary these parameters by wirelessly updating the onboard controller using two Xbee wireless transceivers. Tracking markers shown in figure 13 were positioned on the artificial mesoglea for tracking the vehicle and bell kinematics. The markers were perforated hollow plastic balls with negligible buoyancy force and were dark in color for high contrast with the mesoglea edging and pool background. Markers were placed along the actuating arms at the margin (1, 9, 13), apex (5), the mechanical arm tips (2, 8, 12) and over the joints (3, 4, 6, 7, 10, 11) of Cyro's mesoglea. The video used for bell kinematics analysis was chosen so that the tracking balls numbered 1 through 9 in figure 13 were aligned parallel with the image plane of the camera for an accurate perspective on the vehicle's kinematics. Bell kinematics of Cyro were tracked by digitizing the position of the tracking balls over a full swimming cycle. The positions were digitized from the recorded video using ImageJ and corrected for vehicle rotation using the procedure described in Villanueva et al (2013). The points were zeroed about the apex (tracking ball 5) and normalized by the exumbrella arclength in the relaxed position. The power consumption of the vehicle was monitored during swim testing using a cascading op-amp circuit. Current and voltage across the battery were sampled at 20 Hz using this circuit and then stored as analogue voltage signals in the onboard memory module. The cascading op-amp circuit was designed to withstand a maximum current of 40 A.
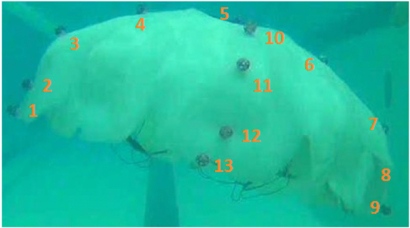
Figure 13. Picture of Cyro in the fully contracted position illustrating the position of the tracking balls used to generate discrete representations of the vehicle's bell kinematics.
Download figure:
Standard image High-resolution image4. Results
4.1. Bell kinematics
The C. capillata bell kinematics were obtained from a previous study (Villanueva et al 2013). These bell profiles along with margin and flexion point trajectories are shown in figure 14(a). The cycle time for this estimated 50 cm in diameter jellyfish was 5.4 s. The flexion point is defined as the location where the flap begins and corresponds to the mechanical arm tip on Cyro. The C. capillata's bell margin follows an outer path during contraction and an inner path during relaxation. This loop helps increase thrust during contraction while reducing drag during relaxation. The kinematics are also important for the formation of starting and stopping vortices and the interaction between the vortices is a crucial aspect of the rowing propulsion (Dabiri et al 2005). Cyro's margin trajectory stays nearly constant during contraction and relaxation. The lack of looping is due to segments 3 and 4 not bending inwards by a large enough angle during relaxation. Segment 3 has the slotted link which is designed to allow inwards bending during relaxation but the stiffness of the artificial mesoglea when stretched during contraction prevents it from passively doing so. The looping at the flexion point is much less then at the bell margin and Cyro mimics this well. Comparing the trajectories of both animal and robot (figures 14(a) and (b)), we can see that the C. capillata is able to achieve more displacement in the x- and y-directions. The C. capillata achieves 0.14 and 0.19 units of normalized deformation more in the x- and y-direction respectively than Cyro. This is mainly due to segment 1 being fixed on Cyro and not allowing the 20° rotation of the CD region during swimming. To show this clearly, the C. capillata kinematics are shown in figure 14(c) with segment 1 fixed. The resulting trajectories are compared with Cyro and the original C. capillata kinematics in figure 14(d). The flexion point trajectory of the C. capillata with fixed segment 1 now has a displacement difference of 0.16 units in the x-direction and only 0.03 units difference in the y-direction then Cyro. This is closer to Cyro and confirms the limitation of having a fixed segment 1 in the y-direction but it does not account for the lack of deformation in the x-direction. The limitation in the x-direction is related to the design of the mechanical arm. The trajectories in figure 14(d) also show discrepancies between the initial locations of the natural and robotic profiles. This is due to variation in the initial exumbrella profiles (figures 14(a) and (b)).

Figure 14. Selected bell profiles with flexion point and margin trajectories for (a) the C. capillata, (b) Cyro and (c) C. capillata with fixed segment 1. (d) Flexion point trajectories for Cyro, C. capillata, C. capillata with fixed segment 1, and arm model with and without prescribed passivity.
Download figure:
Standard image High-resolution imageThe results in figure 14(d) show the tip trajectory of the mechanical arm model. Results are shown with and without the passive link simulated. The passivity adds looping to the trajectory. It is difficult to compare the trajectory with the natural animal since the error in processing of the natural profiles is of the same order as the loop of the arm model with passivity. Also, the model trajectories are lower than that of Cyro. This is because the trajectories were tracked on the artificial mesoglea of the robot as opposed to directly on the mechanical arm as done in the simulation. After accounting for these differences and the error in tracking Cyro profiles, the model shows a good representation of the mechanical arm.
4.2. Thrust
The forces exhibited by a single bell segment were measured using a thrust stand in static water. The x- and y-components were measured over one actuation cycle and are shown in figure 15. The cycle begins with relaxation where the arm moves upwards and creates a negative force in the x- and y-directions. The average force magnitude in the x-direction is higher than the y-direction for this phase as shown in table 5. The contraction phase results in positive forces in both directions. Cruise time results in very low magnitude forces as can be expected since the arm is not moving. The contraction phase produced average forces approximately 3X and 11X larger in the x- and y-components respectively than in the relaxation phase. Overall, this resulted in an average force of −0.1 N in the x-component and 3.49 N in the y-component over the full cycle. Multiplying the y-component by eight for the other bell segments, we can approximate the total thrust produced by the vehicle to be 27.9 N during one cycle. These results predict that the vehicle will be able to produce a positive force which will yield net forward displacement assuming it is near neutral buoyancy. Part of the force in the x-direction will be directed toward the y-component force since water in the subumbrella will face hydrodynamic forces equal in magnitude and opposite in direction in the x-component due to symmetry. Most of the thrust is produced during the last half of the contraction cycle when the bell's contraction rate reaches its peak. The slower contraction rate at the beginning of the contraction cycle is related to the transfer link (LBC) which engages the mechanical arm into rotary motion driven by the linear actuator. See power consumption results in figure 16(a) for a corresponding delay which explains the smaller hydrodynamic load at the beginning of contraction.
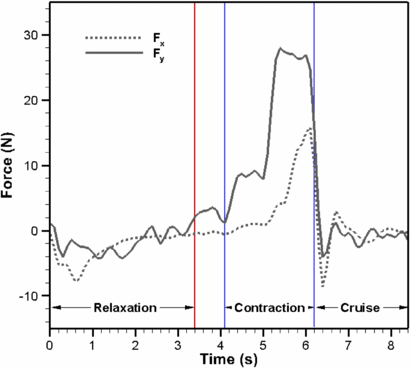
Figure 15. x and y force components of one bell segment over an actuation cycle. Relaxation and contraction refer to the linear actuator pulling and pushing respectively. Cruise time is a period when the actuator is off and in the contracted position. The actuator is also off for a short period (0.7 s) between relaxation and contraction.
Download figure:
Standard image High-resolution image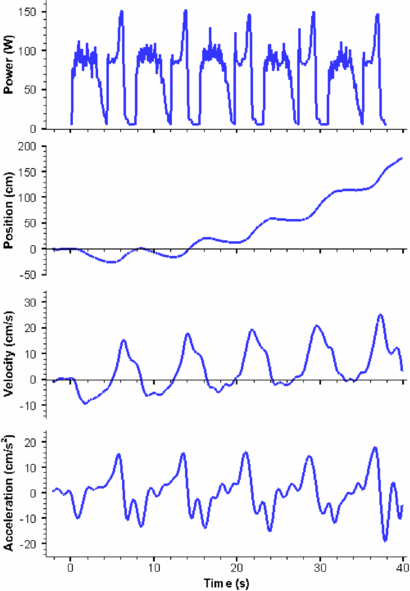
Figure 16. Power consumption and vehicle kinematics over five cycles of actuation. The results show that the vehicle is near neutral buoyancy before actuation (t < 0 s). Cyro swims until it reaches a distance of approximately 5 cm below the water surface which marked the end of the fifth cycle. The bell was initially in the contracted state.
Download figure:
Standard image High-resolution imageTable 5. Time and average force components as measured with the thrust stand for each actuation cycle phase and for a full cycle.
| Relaxation | Contraction | Cruise | Full cycle | |
|---|---|---|---|---|
| Time (s) | 3.4 | 2.1 | 2.2 | 8.4 |
| Fx (N) | −2.58 | 4.85 | −0.411 | 0.1 |
| Fy (N) | −1.7 | 16.9 | 0.155 | 3.81 |
Some oscillation is seen in the system as the linear actuator reaches its maximum position at the end of the relaxation and end of the contraction. This is an artifact of the segment being clamped. Some noise in the y-component is due to the load cell being rated for a much higher magnitude than the forces measured. Load cells with higher sensitivity at lower magnitudes would help improve the signal to noise ratio.
4.3. Upward swimming performance
Cyro was tested in a pool for its overall swimming ability. Initial actuation settings were chosen to match that of a natural C. capillata of the same size as Cyro which were found by extrapolating the contraction time over the cycle period of smaller animals. The biomimetic projections were then adjusted based on visual inspection of preliminary testing to improve the robot's performance. The chosen parameters for upward swimming was done with a relaxation time of 3.4 s, a relaxation pause time of 0.7 s, contraction time of 2.1 s and cruise time of 2.2 s. This results in a cycle time of 8.4 s and actuation frequency of 0.12 Hz. The contraction corresponds to the highest pulse width signal (100% duty cycle) of the motors and a slower pulse width signal (55% duty cycle) during relaxation.
The vehicle was put at a depth of 182 cm measured to the apex of the vehicle. Prior to actuation, the vehicle was raised slightly to remove tension from the rope and buoy and allowed to sink for approximately 2 s which is the time prior to zero in figure 16. It can be seen from the sinking time that the vehicle had a near neutral buoyant state. Cyro was then powered (t = 0 s) and allowed to swim freely to the surface. The apex of the vehicle was tracked over time and the resulting position, velocity and acceleration in the y-direction as a function of time are plotted in figure 16 along with the associated power consumption. Upon actuation, the vehicle was initially in a contracted state. The bell created a negative (down) force as it relaxes which sent the vehicle below its initial position. The cycle continued with a contraction that gave positive (toward the surface) displacement. The vehicle continued positive motion in the y-direction during cruise time. As the bell relaxed, the vehicle underwent a negative velocity until the fifth cycle where it stayed near 0 cm s−1. This cycle repeated itself five times before the vehicle broke the water surface. The overall displacement of the AUV for five actuation cycles was 177 cm and the maximum displacement achieved by one complete stroke cycle was 63 cm on the last stroke, as shown figure 16. The vehicle built momentum throughout the five cycles but did not reach a steady state velocity. The average velocity and acceleration were 4.2 cm s−1 and 0.17 cm s−2 respectively over the five cycles. The maximum velocity and maximum acceleration were 25.5 cm s−1 and 18 cm s−2 respectively which were achieved during the last stroke. These results prove the vehicle's ability to propel itself autonomously.
4.4. Power consumption
A cascading op-amp circuit on-board the AUV measured the power drawn from the battery. Instantaneous values of current (ii) and voltage (Vi) were recorded at a sampling rate of 20 Hz. These numbers were recorded through two analogue-to-digital converters on the microcontroller. Power consumption was then calculated as Pi = Viii. Figure 16(a) shows the resulting plot of power consumption over time for the five actuation cycles recorded during the swim test. The controller and sensor use 5 W which is seen as an offset when the actuators are off in the power consumption results. The resulting power data was processed using a second order Butterworth filter with cutoff frequency of 5 Hz. The average power consumption over one full swimming cycle was 70 W. The average power consumption in-air without artificial mesoglea was 48 W. Therefore, 22 W was consumed in moving the artificial mesoglea and generating the hydrodynamic forces. Out of the 48 W required for in-air actuation, 5 W was for the electronics and therefore, 43 W was required for moving the mechanical arm and compensating for mechanical losses. The total energy consumed was 218 J during contraction and 314 J during relaxation. The vehicle's total efficiency can be calculated using:
where P and T are the average power consumption and thrust of vehicle over the fifth cycle. The average thrust was approximated to be 27.9 N which results in a total efficiency of 0.03. The COT for Cyro was 10.9 J (kg ⋅ m)−1, as defined by equation (2) with an average velocity of 8.47 cm s−1 taken during the fifth cycle, average power consumption of 70 W and body mass of 76 kg.
5. Discussion
Cyro showed its ability to swim autonomously while having a similar physical appearance and kinematics as the Cyanea capillata. Measurements of the C. capillata's performance were not available for animals of similar dimensions as Cyro. Therefore, the main metric used to evaluate the degree of mimicry is the bell kinematics. The number of actuators in Cyro's design was reduced from one set of circular muscles and one set of RM per bell segment to a single linear actuator. Also, segment 1 of the C. capillata was set as a fixed plate which limited the bell's range of motion. The passivity of segments 3 and 4 of the C. capillata was replicated but the kinematic results showed that the motion was not matched. The bell margin trajectory of Cyro did not have as much looping as the C. capillata and the mechanical arms did not bend passively as desired during relaxation. This is due to the artificial mesoglea keeping too much tension in the arm which reduces the compliance with hydrodynamic forces. The improvement of passivity will be the subject of future work since the bell kinematics directly affects the hydrodynamics of the vehicle and therefore its performance as seen in natural jellyfish (Costello and Colin 1994, 1995, Colin and Costello 2002, Bajcar et al 2009, Sahin et al 2009, Wilson and Eldredge 2011). Also, the bell segments of the C. capillata have a complex 3D geometry which was roughly approximated in this study. Natural C. capillata will have to be scanned in order to replicate its bell geometry with higher accuracy. Further, the bell kinematics of this 3D structure will require more analysis as only one plane in the spanwise (radial) direction of a bell segment was considered in this work.
Thrust measurements of a single bell segment provided an approximation of thrust production for the whole vehicle. Several assumptions were made for this approximation. The mesoglea of the bell segment does not have a CD region covering the top portion of the arm though this should not have much effect when the arm is clamped. It also does not have adjacent segments on each side. These limitations allow water to flow in regions where it would not be able to do so in the fully enclosed bell. Water in the subumbrella flowing in the x-component is able to keep moving in the x-direction without being met by equal and opposite forces due to the symmetry of the full vehicle. These limitations will likely underestimate force in the y-component. The thrust stand design used for this experiment was able to seclude the x- and y-components of the total force upon actuation. This design was also able to reduce oscillation in the system due to the pitching motion of the bell segment. The thrust stand will serve as a method to test different artificial mesoglea and mechanical arm designs in order to increase performance and efficiency.
Poor looping in Cyro's bell trajectory should result in higher drag. This is compensated by a faster contraction rate as seen when comparing ratio of the contraction time over one full cycle of the C. capillata and Cyro which are 37% and 25% respectively. The jellyfish is limited by its single layer of muscles while Cyro is not. It is possible that for an artificial system such as the C. capillata the optimal contraction rate is not the same as the natural animal due to different losses in the mechanical and electrical systems. The swimming performance of Cyro was observed to improve with contraction rate but further characterization will be required to determine an optimum which maximizes proficiency or efficiency. The vehicle total efficiency and COT were found to be 0.03 and 10.9 J (kg ⋅ m)−1 respectively but these numbers rely on the average velocity of the fifth cycle of actuation where the vehicle had not yet reached a steady state velocity. The average velocity at steady state will be higher and therefore increase the efficiency and COT.
Energy expenditures of relaxation and contraction are 314 J and 218 J respectively. More energy is therefore spent in opening the bell then contracting it. Though the arms move at a faster rate during contraction, they move for a longer time during relaxation. Losses in the actuator and opposing gravitational force on the arm cause this higher energy consumption. The natural jellyfish's approach is to spend more energy during contraction and store enough elastic energy in its structure to passively relax. The level to which this is advantageous in an artificial design will be the source of future investigation.
Power consumption is an important criterion for this type of vehicle. The current design can last for over 3 h of continuous swimming with the 16.8 V nickel metal hydride battery (HHR300 SCP, Panasonic). The power consumption analysis revealed the high losses of energy in the mechanical system. Removing the need for actuators during relaxation could help reduce the losses associated with the actuators. The total efficiency of Cyro (0.03) was found to be less than jellyfish Froude efficiency which ranges between 0.09 and 0.53. As previously mentioned, the Froude efficiency does not account for all losses but the COT does. The COT of Cyro (10.9 J (kg ⋅ m)−1) was found to be over one order of magnitude larger than the projected COT for a Stomolophus (0.47 J (kg ⋅ m)−1) and an Aurelia (0.38 J (kg ⋅ m)−1) of the same mass as Cyro. Several strategies will have to be employed in order to decrease the COT for missions lasting on the order of weeks and months. The robot will need to be more biomimetic by reducing power consumption and adding the ability to harvest energy. As pointed out in the introduction section, jellyfish are able to swim with a very low metabolic rate. Therefore, more attention needs to be paid toward replicating the bell kinematics at a low energy cost. Energy harvesting from the ocean environment will be required to replenish the energy supply of Cyro for extended mission time and range. Some energy harvesting strategies have already been investigated for this vehicle (Joshi et al 2011).
The Reynolds numbers of the 50 cm Cyanea and Cyro are approximately 61 000 and 336 000 respectively. This was calculated based on the margin velocity during contraction and using the bell diameter as the characteristic length. In future hydrodynamic studies, the Reynolds number will have to be manipulated accordingly. This can be done by changing the size and contraction rate of Cyro. However, Cyro currently shows an improper pattern with its contraction rate. It is approximately the same as the 50 cm Cyanea while contraction rate is expected to decrease with size (McHenry and Jed 2003). Cyro's improper contraction rate and bell kinematics indicate that improvements in the swimming mechanism are needed. Cyro needs to produce more thrust a lower contraction rates. Lower contraction rates would also increase Froude efficiency since Froude efficiency increases with decreasing fluid output velocity as shown in equation (1).
Cyro has shown the ability to achieve a basic level of autonomy. This platform can be expanded to accommodate more autonomous capabilities. Sensory feedback coupled with adaptive control and the ability to turn will allow the vehicle to achieve more complex objectives. The understanding of turning mechanism is currently an ongoing research with both natural and robotic jellyfish.
Acknowledgments
The authors gratefully acknowledge the financial support from the Office of Naval Research through grant #N00014-08-1-0654. The authors would like to acknowledge the contribution of the 2010–2011 Virginia Tech Biomimetic UUV team for their contribution to the design of Cyro. Among them, William Newman and Kenneth Hodges made an outstanding contribution. The authors would also like to acknowledge the contribution of the 2011–2012 Virginia Tech Biomimetic UUV team for their contribution in the manufacturing and testing of Cyro. In particular, the authors would like to thank Josh Melson who worked on the preliminary designs of the thrust stand and Devin Bohanan who helped with determining the specifications of the vehicle.
Appendix:
A.1. Electronics and structural components
An electronics platform was developed for providing a means to control Cyro underwater while simultaneously collecting, storing, analyzing, and communicating sensory data. All onboard electronics, including the eight linear actuators were powered by a rechargeable 16.8 V nickel metal hydride battery (HHR300 SCP, Panasonic). The battery had a 10 Ah capacity and a 40 A maximum current discharge. The electronics consisted of two microcontrollers, one pressure sensor, eight custom made H-bridge DC motor controllers, a custom made power monitoring circuit, a wireless communication module, a data storage unit, and an inertial measurement unit. Waterproof connectors were added to the box to interface with external wires. Table A1 describes each electrical component and its function while figure A1 outlines the overall interaction between them.

Figure A1. Block diagram showing interconnection between components. Color coding of blocks is based on functionality.
Download figure:
Standard image High-resolution imageTable A1. Electronic components for the control platform and their respective functions.
| Component (company, model) | Function |
|---|---|
| Microcontroller (1) (mega 2560, arduino) | Microcontroller responsible for collecting and storing data from sensor inputs |
| Microcontroller (2) (mega 2560, arduino) | Microcontroller responsible for DC linear actuator control |
| Inertial measurement unit (3DM-GX3–25, microstrain) | Inertial measurement unit, returns euler angles and angular rates |
| Power monitor (custom made) | Measures instantaneous operational power consumption of robot |
| Pressure sensor (300, ultrastable) | Measures hydrostatic pressure of surrounding water |
| (used to calculate depth of robot) | |
| Data storage unit (MicroSD card module, libelium) | Stores data from all sensors during operation |
| H-Bridge DC motor controllers (custom made) | Allows for speed and direction of eight individual |
| actuators to be manipulated independently | |
| DC linear actuators (PA-14-4-50, | Drives each arm segment of robot |
| progressive automations) | |
| Wireless communication module (xbee, maxstream) | Sends stored data on SD card to external computer wirelessly. |
| Also receives parameter changes from external computer. | |
| External computer | Hosts LabView program which sends and receives data to/from robot wirelessly |
Eight DC linear actuators (PA-14-4-50, progressive automations) were selected to drive each arm segment of the robot. The actuators have a maximum force output of 23 kg and originally had a 10 cm stroke length. Due to the design of the mechanical arms, it was necessary to adjust the maximum and minimum stroke limits of each actuator in order to prevent collisions between mechanical parts. This was done by rearranging the two limit switches inside each motor to achieve the exact stroke length necessary to drive the arm segments to their proper relaxed and contracted positions.
The onboard microcontroller allows for the eight linear actuators to be controlled independently. An analogue pulse width modulation (PWM) signal is sent from the microcontroller through the H-bridge DC motor controller to a single arm, allowing for the contraction rates, relaxation rates and stroke lengths to be varied. Each arm has its own corresponding PWM signal and H-bridge circuit. The H-bridge circuits were designed to handle a continuous current draw of 10 amps and a max current draw of 20 amps in order to account for back-EMF of the actuators. Additionally, flyback diodes were added to each circuit to further protect against back-EMF. A schematic of the H-bridge circuit as well as a list of components making up the circuit are shown in figure A2 and table A2 respectively.

Figure A2. Schematic of the H-bridge circuit used to control one of the linear actuators. Individual components are described in table A2.
Download figure:
Standard image High-resolution image
Table A2. List of components used in H-bridge circuit shown in figure A2.
| Component | Description | Value/part no |
|---|---|---|
| P1, P4 | Logic input | 0–5 V input |
| P2, P3 | Output to motor | 16.8 V output |
| PS | Power supply | 16.8 V input |
| R1, R3 | Resistor | 10 kΩ |
| R2, R4 | Resistor | 20 kΩ |
| C1, C2, C3, C4 | Capacitor | 100 µF |
| D1, D2, D3, D4 | Diode | 1N5408 |
| Q1, Q2 | BJT | 2N2222A |
| Q3, Q5 | BJT | TIP147 |
| Q4, Q6 | BJT | TIP142 |
Each of the eight actuators was housed in a custom made acrylic box, as shown in figures 1–3. The dimensions for the inside of the box were 5 cm × 10 cm × 20 cm. The acrylic on the top, bottom and sides was 0.8 cm thick, while the front and back panels were 1.27 cm thick. Flanges made of 1.27 cm acrylic were attached at the front of the side plates and were used for attaching the front plate. IPS Weld-On #16 Acrylic Solvent Cement was used to bond all the edges of the box together. The actuator was secured to the back plate of the box with three screws. The front plate was made removable for access to the motors and was secured in place with bolts running through the front plate and the side flanges. A soft silicon gasket provided the seal between the front plate and flanges. The actuator rod passed through an aluminum insert that held a dynamic seal (type B Polypak, Parker). The dynamics seal allowed linear motion of the rod during actuation while sealing the box from water. A 1.27 cm acrylic central plate was used as the base platform to secure the electronics box and each of the actuator boxes. This plate was octagonal in shape with each side having dimension of 19.7 cm in length. Actuator boxes were bolted to the underside of the plate while the electronics box was bolted on the topside.
The electronics box measured approximately 30 × 25 × 10 cm3 and was located at the apex of the vehicle to assist the wireless communication and maintenance during operation. The sixteen cell battery pack was placed at the bottom of the box in a separate acrylic housing to further protect it against water. By laying the battery cells horizontally, instead of grouping it vertically as the stock battery is arranged, additional space within the box was created to house the remaining electronics. The electronics were located on top of the battery housing within the box. Waterproof connectors on two sides of the box allowed power to be transferred from the battery to each actuator.
A.2. Analytical model derivation for the mechanical arm
The kinematics of the translating mechanism is first solved for. The translating mechanism is a four bar mechanism which can be simplified since LDA is fixed and LAB does not rotate. The driving variable of the mechanical arm is LAB, which is the varying length of the translating actuator. The distance between B and D is defined as LBD and is not an actual link. It separates the quadrilateral formed by the translating mechanism into two separate triangles whose angles can be solved by the law of cosines as follows:
where:
The angles are in the global coordinate system shown in figure 10. This gives θ2:

and the angle of interest θ3:

Next, the four-bar mechanism can be solved in terms of LAB. The loop closure equations of the four-bar mechanism are:
where ϕ4 is set equal to 180° in order to simplify the system. We are interested in solving for ϕ5. To do so, ϕ6 is isolated and both sides of equations (A.8) and (A.9) are squared:

Equations (A.10) and (A.11) are then expanded and added. After grouping the terms, the following form can be obtained:
where:

Equation (A.12) is known as the Freudenstein equation. The following trigonometric properties are then substituted in equation (A.12):
Grouping the terms, we arrive at the following equation:

where:


Equation (A.18) is a quadratic equation which can be solved using:
Similarly, we can solve for ϕ6 and obtain the following:
where:


and:
Next, we solve for the passive section of the mechanical arm. The angles ϕ8 and ϕ7 can be solved by noticing that the passive section is a triangle with constant location with respect to LFG. Using the law of cosine we obtain the angles determining the triangle:
The angles dictating the position of LGH and LFH are then determined using:


The four-bar mechanism and passive section are related to the translational mechanism using the following relationship:

where α is used to convert the coordinate system to the global coordinate system used in solving for the translational mechanism. α can also be used to convert angles ϕ4–ϕ8 into the global coordinate system as follows:

These angles along with the different link lengths L, fully describe the position of the arm mechanism as a function of LAB.