

Abstract
A detailed review and analysis of literature values for the absorption cross-section of ozone at room temperature at the mercury-line wavelength (253.65 nm, air) is reported. Data from fourteen independent sets of measurements spanning the years 1959–2016 were considered. The present analysis is based upon a revised assessment of all Type A and Type B uncertainty components for each previously reported cross-section. A consensus value for the absorption cross-section of 1.1329(35) × 10−17 cm2 molecule−1 is recommended based on statistical analysis of the weighted data. This new cross-section value is 1.23% lower and its uncertainty sixfold smaller than the uncertainty of the conventionally accepted reference value reported by Hearn (1961 Proc. Phys. Soc. 78 932–40).
Export citation and abstract BibTeX RIS

Original content from this work may be used under the terms of the Creative Commons Attribution 3.0 licence. Any further distribution of this work must maintain attribution to the author(s) and the title of the work, journal citation and DOI.
1. Introduction
Gas phase ozone (O3) plays a key role in the chemical and radiative equilibrium of the Earth's atmosphere because of its high chemical reactivity and intense absorption spectrum. Ozone occurs naturally in both the stratosphere and the troposphere. In the stratosphere it is produced by a reaction of atomic oxygen with O2 and provides an effective screen for organisms from harmful ultraviolet (UV) solar radiation. While the broadband spectroscopic features in the UV and visible (VIS) spectral regions absorb incoming solar radiation, the narrowband rotation-vibration features spanning the infrared (IR) provide the long-wavelength feedback that make ozone an important greenhouse gas.
In the troposphere, ground-level ozone is a harmful pollutant that is caused by the photochemical decomposition of nitrogen oxides and volatile organic compounds. Technology for accurately monitoring local ozone concentrations in urban settings is required to identify sources and locations of ozone, to ensure compliance with local emissions regulations, and to notify communities when unsafe conditions occur. There are also numerous long-range (spatial and temporal) observations from aircraft, balloon-borne probes and satellites, which provide spatiotemporal information on the global status of ozone and which require accurate spectroscopic properties of ozone.
Most quantitative measurements of ozone concentration in the laboratory and field involve linear absorption spectroscopy methods. Of the many ozone light absorption features from the UV to IR, the Hartley UV band near 255 nm provides one of the strongest absorption signatures, making it attractive for ground-level ozone concentration retrievals where low detection limits (mole fractions in air at the nmol mol−1 level) are required. Relatively inexpensive and rugged mercury-vapor lamps are used as light sources in closed-path absorption spectrometers for measuring ground-level ozone in many laboratory and field applications. These lamps emit incoherent light in the UV and VIS regions at numerous discrete wavelengths, with by far the most intense emission occurring at the wavelength 253.65 nm (in air) [1], which corresponds to the 6 1S0 ← 6 3P1 inter-combination band electronic transition of gaseous elemental mercury (Hg0). Coincidently, this mercury transition occurs near the wavelength maximum of the ozone Hartley band, thus making mercury-vapor lamps attractive for compact UV absorption photometers that measure ozone. Therefore, direct absorption methods employed by these mercury-lamp photometers require knowledge of the 253.65 nm absorption cross-section to provide ozone concentration derived from measurements of sample absorbance and optical pathlength. Thus, when using mercury-lamp photometry, the minimum combined standard uncertainty in the measured ozone concentration can be no smaller than that of the ozone absorption cross-section at 253.65 nm.
In the 1980s, Bass and Paur of the United States National Bureau of Standards (NBS), now known as the National Institute of Standards and Technology (NIST), developed the NBS Standard Reference Photometer (SRP) instrument which eventually became an international standard for the measurement of tropospheric ozone. Based on the abovementioned reasons, Bass and Paur recognized that a mercury-vapor lamp would make a good light source for their standard ozone photometer. After following the United States Environmental Protection Agency (U.S. EPA) guide on ozone calibrations developed in 1979 [2], they adopted the ozone absorption cross-section at the mercury line as a reference value. In 1961, this cross-section was measured by Hearn to be equal to 1.147 × 10⁻¹⁷ cm2 molecule−1 with a reported relative standard uncertainty of 1.4% [3]. Bass and Paur also measured the absorption cross-section of ozone over an extended spectral region relative to this reference value [4, 5].
Since the development of the NBS SRP, more than 60 of these photometers have been constructed by the NIST and now serve as primary standards for national and international ozone monitoring networks, such as the WMO global atmosphere watch (GAW) Programme [6, 7]. Several realizations of the NIST SRP are maintained at the International Bureau of Weights and Measures (French acronym BIPM), one of which is the reference for international comparisons of ozone standards coordinated by the BIPM [8]. In practice, SRPs maintained by State Parties to the Metre Convention are regularly compared within the framework of the international comparison BIPM.QM-K1 (See for example [9]).
Meanwhile, results of several studies have called into question the confidence in Hearn's conventionally accepted value for the ozone 253.65 nm absorption cross-section. Given that ozone is highly reactive, the measured ozone concentration in the experiments of Bass and Paur [4] and others discussed below were susceptible to difficult-to-assess uncertainty associated with sample impurity, leading to a potential bias in the reference absorption cross-section. To quantify this bias, SRP-based UV absorption measurements were compared to independent determinations of ozone concentration based on gas phase titration (GPT). The latter technique involves reacting ozone in air with nitrogen monoxide (NO) and measuring either the loss of NO or the gain of the reaction product, nitrogen dioxide (NO2) to deduce the ozone concentration in the sample. In two independent realizations of the GPT method, a 2%–3% bias in the ozone reference absorption cross-section was observed by the National Institute for Environmental Studies of Japan (NIES) [10] and the BIPM [11], with the two GPT methods reporting higher ozone concentrations than the SRP measurements. The most likely explanation was a systematic deviation in the ozone reference absorption cross-section, which usually represents the major uncertainty component in ozone measurements based on UV photometry.
The 253.65 nm cross-section is also relevant to ground- and satellite-based measurements of atmospheric ozone using broadband spectroscopic methods operating throughout the UV, VIS and IR spectral regions, and for which accurate knowledge of ozone absorption cross-sections in these wavelength regions is essential. Efforts to improve the accuracy of the ozone absorption cross-section have continued, both at the mercury-line wavelength for tropospheric measurements using SRP instruments, and over larger spectral regions for stratospheric ozone measurements using other types of spectrophotometers, such as Dobson and Brewer instruments. This situation motivated the creation of the absorption cross-section for ozone (ACSO) committee, which began in 2008 as a joint initiative of the International Ozone Commission (IO3C), the World Meteorological Organization (WMO) and the IGACO ('integrated global atmospheric chemistry observations') O3/UV Subgroup. In their summary article [5], the ACSO committee recommended cross-section data for several types of ground- and satellite-based measurements of atmospheric ozone and emphasized the need for more high-quality laboratory measurements of ozone cross-sections with combined relative uncertainties better than 1%. These laboratory measurements, which must span the UV and VIS regions to ensure wavelength continuity and consistency between independent measurements, are especially challenging because more than seven orders of magnitude variation in cross-section must be covered. The principal recommendation of the ACSO committee was the abandonment of the ozone absorption cross-section values in the Huggins band measured by Bass and Paur [4] and its replacement by the values measured by Serdyuchenko et al in 2014 [12] for Dobson and Brewer spectrophotometers [13, 14] and those measured by Brion, Daumont and Malicet in the 1990s [15] for satellite retrievals. A complete list of references can be found in the ACSO report [5]. Importantly, the recommended abandonment of the Bass and Paur values in the UV region, which Bass and Paur determined in measurements relative to the Hearn [3] value, also implied a shift from Hearn's conventionally accepted value for the 253.65 nm ozone absorption cross-section.
As discussed by Birk et al, Drouin et al, Picquet-Varrault et al, Smith et al, [16–19] and others, knowledge of ozone line intensities in the IR region has been rather contentious and uncertain over the last few decades, with inconsistencies in the literature data at the 4% level. Indeed, many of these IR measurements are anchored to the ozone absorption cross-section at the mercury-line wavelength, which is the subject of the present work. Although consistency at the percent level between the ozone cross-section and line intensity data spanning the UV, VIS, IR and far-IR spectral regions has not yet been demonstrated, progress to that end is being made. For example, in a recent study, intensities of ozone rotation-vibration transitions in the 10 µm wavelength region were measured with a relative uncertainty of 1.5% by comparison to pure rotational transitions in the far-IR region having a known rotational dipole moment [17]. In the near term, we foresee new measurements, such as a recent laser-based cross section measurement at 325 nm [20] as well as ab initio calculations of potential energy surfaces and transition moments [21] that are expected to provide more self-consistent ozone cross-sections and line intensities with relative uncertainties at the 1% level or better from the IR to far IR regions, as already demonstrated for H2O, CO2 and CH4 line intensities [22–25]. In the long term, UV and VIS cross-sections also may be calculated at the same level of accuracy. Because of numerous 253.65 nm ozone cross-section measurements and the ubiquity of ozone-measuring instruments at this wavelength, the mercury-line cross-section will continue to be an important anchor point for scaling spectroscopic measurements of ozone concentration. Consequently, rigorous assessment of the combined uncertainty of the mercury-line ozone cross-section has become a high priority.
In view of the recommendation of the ACSO [5], together with new values of the 253.65 nm ozone absorption cross-section published in the last decade [11, 26] which also showed lower values than the Hearn value by about 2%, the Gas Analysis Working Group of the Consultative Committee for Metrology in Chemistry and Biology (CCQM/GAWG) convened a task group to review all published measurements of this quantity performed since 1950. The task group was charged with recommending a consensus-based mercury-line cross-section value and associated uncertainty to be adopted in standard photometric instruments for measurements of tropospheric ozone concentration.
This article reports on the outcome of the review performed by the present task group, explaining the method and policy of the review in section 2, and how this resulted in a selection of the fourteen literature values listed in section 3. The different instrumental methods used to measure the ozone absorption cross-section are discussed in section 4, together with their metrological traceability and the minimum sources of uncertainties that would be expected. Revised uncertainties are given in section 5. The mathematical treatment applied to the fourteen selected values for the ozone absorption cross-section at the mercury-line wavelength and associated uncertainties are detailed in section 6, resulting in the estimation of a new recommended value with a relative combined standard uncertainty of 0.31%. Details regarding how the uncertainties of the literature values were treated and reassessed are given in the supplementary material (stacks.iop.org/MET/56/034001/mmedia).
2. Method and policy of the review
2.1. Data selection
The following four criteria were applied to decide which data were to be included in the statistical treatment to calculate a recommended value of the ozone absorption cross-section at the mercury-line wavelength:
- Publication date: only data from papers published in peer-reviewed journals between 1 January 1950 and 31 December 2016 were considered.
- Published value: the publication had to clearly state a value of the ozone absorption cross-section at the wavelength 253.65 nm (air). Because it is recognized that the variation of the absorption cross-section at this wavelength with temperature is weak (fractional change of −5 × 10⁻⁵ K−1 at 295 K) [27, 28] all measurements performed at temperatures close to 295 K within 5 K were selected. Values could be inferred from a publication if the description included all information to perform a straightforward calculation of the ozone absorption cross-section.
- Repeats: in case a laboratory had reported two or more values from similar measurements carried out several years apart, the latest result was considered to supersede previous ones.
- Independence: particular attention was given to the independence of data. Some groups measured the ozone absorption cross-section at multiple wavelengths within the Hartley band (including the wavelength 253.65 nm) relative to a value that had been published earlier. Although these publications were not considered in the final selection, they were analyzed if they brought further useful information to the measurements performed by the group.
2.2. Data correction
In analyzing the data, the task group had the prerogative to estimate that the authors had missed or underestimated an effect, for example, when an effect which would bias the measured value had not yet been discovered. In this case, rather than modifying the reported value itself, an additional uncertainty component was calculated. The unreported bias δ was estimated, and it was assumed that there was equal probability for the value σ to be in a range [σ, σ + δ]. Thus, a rectangular distribution of the uncertainty associated with the bias was considered, resulting in a standard uncertainty component equal to u = δ/√ 3 in the direction of the bias only. This component was further combined with the stated standard uncertainty.
2.3. Uncertainties
In evaluating how the uncertainty associated with a result was obtained, the philosophy of the Guide to the Expression of Uncertainty in Measurement [29] was followed. This meant that the original uncertainties could be modified, if, for example, it was found in the paper that they were not properly combined, or if the estimator (experimental standard deviation for example) was not considered appropriate. All uncertainties were expressed as the standard uncertainty, and the expanded uncertainty was specified only when reporting the recommended value.
3. Selection of publications
A first selection of publications can be found in the review paper of Orphal [30]. This review considered a total of 28 papers, classified into three categories: absolute measurements at single wavelengths (eight papers), absolute measurements over large spectral regions (12 papers), and relative measurements (eight papers). The last category was not considered according to our independence criterion, reducing the selection to 20 papers. Values of the ozone 253.65 nm absorption cross-section were measured in seven papers of the first category, and eight of the second, resulting in the selection of 15 publications [3, 15, 27, 28, 31–41]. Brief descriptions of groups that had more than one publication on ozone mercury-line cross-sections are given below.
Mauersberger and co-workers at the University of Minnesota (USA) published three articles on the 253.65 nm ozone absorption cross-section in 1986 and 1987, two of which used pressure measurements to estimate ozone concentrations [27, 37]. In [27] they addressed the temperature dependence of the cross-section over the range 195 K–351 K, whereas in [37] they performed measurements at room-temperature only. The relative difference between the two reported room-temperature values was 0.09%, showing excellent long-term reproducibility, whereas an additional room-temperature measurement performed with an alternative method (based on the ozone vapor pressure at liquid-argon temperature [38]) was 0.5% lower than the other two values. The authors mentioned in the last publication that the lower cross-section value was not to be preferred. Therefore we selected only the value measured by pressure and published in [37].
Between 1992 and 1995, Brion, Daumont and Malicet worked in the same group of the University of Reims (France) and published three articles on the UV absorption cross-sections of ozone in the Hartley and Huggins bands [15, 32, 36]. The two studies from 1993 and 1995 reported the temperature dependence of the ozone absorption cross-section. We selected the 253.65 nm absorption cross-section from the 1992 article, which focused on the room-temperature measurements.
Although Vigroux [40] measured the absorption cross-section in the Hartley band, he encountered difficulties which precluded reporting measurements of the ozone cross-section at the mercury-line wavelength. Therefore, results from this publication were not included.
In a study to support the global ozone monitoring experiment (GOME), Burrows et al [31] from the University of Bremen measured the wavelength and temperature dependence of the ozone absorption cross-section in the UV and VIS regions. These measurements were made with a grating spectrometer (0.2 to 0.3 nm resolution, spectral coverage from 231 to 794 nm) and a variable-temperature multi-pass sample cell, while the ozone concentrations were determined by GPT with NO. The same group also published NO2 and O3 cross-sections by Fourier-transform spectroscopy (FTS) in [42] and [43], in which this latter measurement was judged to be of better quality. However, because the FTS measurements were scaled to the GOME spectrometer measurements, only the first publication [31] was selected.
Since the review of Orphal [30], new values of the ozone absorption cross-section at the mercury-line wavelength have been reported by Dufour et al [44], Gorshelev et al, [45] and two by Viallon et al [11, 26]. The last two publications report independently measured values (one by UV absorption, the other by GPT) and were selected although they were measured by the same group. Although Gorshelev et al [45] were affiliated with the same university as Burrows et al, [31] the two experiments were separated by fifteen years, with different instrumentation and more importantly independent methods for determining the ozone concentration. Consequently, we consider these two ozone cross-section measurements to be independent.
Unlike the ACSO report [5], we also considered the GPT measurements performed at the NIES by Tanimoto et al [10]. Although the ozone absorption cross-section was not explicitly specified by the authors, the publication provides all the information required to easily determine the magnitude and uncertainty of this value.
A recent study of ozone performed at the Université Pierre et Marie Curie (UPMC) by Janssen et al was reported during the ACSO committee meetings. This work yielded one publication on the preparation of highly purified ozone [46]. We used this study to guide the estimation of additional uncertainties in ozone sample purity (where applicable) that were not originally considered. However, the unpublished results of Janssen et al did not contribute to our final list of measured mercury-line cross-sections, because no measurements of this quantity were reported in the published manuscript [46].
The final selection of fourteen publications listed in table 1 was scrutinized by the present task group. Values are identified with the acronym of the lead author's institution rather than the names of the authors, except for Hearn [3] because the current conventional value is referred to with his name, and for Griggs [34] because the laboratory no longer exists.
Table 1. List of the fourteen independent publications selected to calculate the consensus value of the ozone absorption cross-section at 253.65 nm.
| Identification | Author(s) | Traceability | Sample purity |
|---|---|---|---|
| AFCRC-59 [35] | Inn and Tanaka | Ozone pressure | Assumed pure |
| Hearn-61 [3] | Hearn | Ozone pressure | Degradation to O2 considered |
| JPL-64 [33] | De More and Raper | Oxygen pressure | Assumed full conversion of O3 to O2 |
| Griggs-68 [34] | Griggs | Ozone pressure | Assumed pure |
| JPL-86 [39] | Molina and Molina | Ozone pressure | Assumed pure |
| UniMin-87 [37] | Mauersberger et al | Ozone pressure | Assessed by mass spectrometry |
| HSCA-88 [41] | Yoshino et al | Ozone pressure | Assumed pure |
| UniReims-93 [32] | Daumont et al | Ozone pressure | Degradation to O2 considered |
| UniBremen-99 [31] | Burrows et al | NO2 cross-section via GPT | NA |
| UPMC-04 [44] | Dufour et al | Ozone pressure | Assumed pure |
| NIES-06 [10] | Tanimoto et al | NO/N2 standards via GPT | NA |
| UniBremen-14 [45] | Gorshelev et al | Ozone pressure | Degradation to O2 considered |
| BIPM-15 [26] | Viallon et al | Ozone pressure | Assessed by residual pressure measurements |
| BIPM-16 [11] | Viallon et al | NO/N2 standards via GPT | NA |
4. Measurement methods, traceability and uncertainties
The selected publications can be categorized according to their measurement methods to facilitate making critical comparisons between the data. At first, two groups can be distinguished in terms of how the ozone number density (or its time derivative) in the light-absorbing sample gas were determined: (1) those in which the ozone number density of nominally pure ozone samples was calculated from the ideal gas law in terms of the measured total gas pressure (with corrections for residual sample impurity) or those in which the ideal gas law and the measured time derivative of total gas pressure were used to infer the time derivative of the number density caused by the decomposition of ozone to O2, and (2) those in which GPT of ozone in air with NO was implemented in addition to the UV absorption measurement to provide the ozone number density. For the GPT-based measurements, the traceability and uncertainties of the measured ozone concentration are different than those of the pressure-based measurements on pure ozone samples, as will be discussed in the following sections. Further, unlike the measurements on pure ozone samples, the GPT measurements largely avoid uncertainties caused by sample impurity and ozone decomposition. In addition, all the absorption measurements reported here can be classified according to the light source/spectrometer combination used (e.g. mercury lamp with narrowband filter, single-frequency laser, or broadband lamp with dispersive element). The following section lists the various methods and comments on the expected sources of uncertainties.
4.1. Absorption measurements performed (directly or indirectly) on pure ozone samples
Among the fourteen selected publications, eleven groups performed absorption measurements on ozone samples, thereby deriving their traceability from observations of ozone pressure, as listed in table 1. This method includes the preparation of a sample of gaseous ozone and the measurement of its absorption at the mercury emission wavelength inside a gas cell. Within this general description, a distinction can be made according to the sample preparation methods and the absorption measurements. However, all methods considered here (including the GPT-based measurements) invoke the Beer–Lambert law to evaluate the 253.65 nm ozone absorption cross-section, σ, which has dimensions of area per molecule. In the absence of intensity saturation effects, this analysis yields
in which  is the napierian absorbance of the sample expressed in terms of the radiant power transmitted by the absorption cell with ozone (P) and without ozone (P0), and l is the effective optical path length of the light propagating within the gas cell. The number density of ozone in the gas cell, n, is calculated from the ideal gas law as
where T is the measured gas temperature, kB is the Boltzmann constant, x is the mole fraction of ozone and p is the measured gas pressure.
From equations (1) and (2), the minimum set of uncertainty sources includes those from measurements of the absorbance A, the light path length l in the absorption cell, the cell temperature T, and the ozone partial pressure xp given by the product of ozone mole fraction and total pressure. These uncertainties are listed below with some further consideration regarding possible additional uncertainty components.
4.1.1. Measurement of absorbance A.
Ideally, absorption measurements are performed with a monochromatic light source at the wavelength of interest. We note, however, that the emission spectrum from mercury lamps is not perfectly monochromatic. Specifically, radiation at the 253.65 nm (in air) line corresponds to the 6 1S0 ← 6 3P1 inter-combination band transitions of all seven naturally occurring mercury isotopes. This emission spectrum spans a frequency range of only 25 GHz, which corresponds to a wavelength range of 5.4 pm and a fractional frequency (or wavelength) width of 2.1 × 10⁻⁵. Further, while the mercury-vapor lamps used by four groups (Hearn-61 [3], JPL-86 [39], UniMin-87 [38], and HSCA-88 [41]), do emit quasi-monochromatic light at 253.65 nm (in air), approximately 13% of the irradiance is distributed among 40 widely separated wavelengths over the 230 nm–579 nm range [1]. For completeness, we evaluated the spectrally integrated mercury lamp irradiance weighted by the ozone absorption spectrum and estimated that more than 99% of the absorption is associated with the 253.65 nm line. The closest and next-important mercury line occurs at 265.204 nm (air) and can be effectively removed with an appropriate filter with a bandwidth of 10 nm or less. We therefore checked in those publications whether a filter was used or a correction was applied.
Five other groups measured the ozone absorption cross-section over a large spectral range (AFCRC-59 [35], JPL-64 [33], Griggs-68 [34], UniReims-92 [32], UniBremen-14 [45]). In this case, wavelength dispersive grating spectrometers of various kinds were used, which would be expected to be associated with an added uncertainty source associated with the finite resolution of grating spectrometers. This finite resolution in wavelength can be converted into a cross-section uncertainty based on the local spectral logarithmic derivative,  for the Hartley band ozone absorption spectrum.
Finally, the UniBremen-14 [45] value at the mercury wavelength was calculated relative to measurements performed in another part of the absorption spectrum. Spectral slices were concatenated together, and this was considered as an additional source of uncertainty.
Variations in the source beam intensity, and imperfect signal normalization and detector/baseline drift likely contributed to measurement variation and uncertainty. However, given that we usually lacked detailed information about these factors, we assumed that these effects were captured by the reported measurement uncertainty, based on scatter and irreproducibility.
4.1.2. Optical path length in the absorption cell.
While the Beer–Lambert law relies on the knowledge of the optical path length of the light inside the sample, this value is often assumed to be equal to the geometrical length of the cell. However, this assumption may be inappropriate for two reasons. First, divergent light can result in unwanted reflections of the light from the cell walls which reaches the photodetector, and second, reflections from cell windows can result in multiple passes through the cell. Both effects tend to increase the effective optical path length, leading to a positive bias in the measured absorber concentration or absorption cross-section.
In 2006, Viallon et al quantified the effect of multiple reflections by comparing ozone mole fractions in synthetic air obtained with two SRP instruments (each with two cells nominally 90 cm in length) that differed primarily in the orientation of the sample cell output windows [47]. The first SRP had cells with parallel end windows perpendicular to the light path while the other SRP had cells with end windows which were tilted by 3° within the plane of reflection and relative to normal incidence of the light beam. The SRP with the tilted windows yielded ozone mole fractions that were systematically 0.6% lower than those measured by the SRP with the parallel windows.
Of the fourteen studies considered here, nine of these used gas cells with nearly parallel windows perpendicularly oriented with respect to the light path and separated by 0.5 cm–38 cm [3, 32–35, 38, 39, 41, 45]. Two other studies used non-bias-corrected SRP instruments [10, 44], for which we assumed that multiple reflections lead to a similar bias (0.6%) as demonstrated by Viallon et al [47]. A known total bias for these SRP instruments (which incorporates the multiple-reflection effect) was accounted for as mentioned in section 4.1.6.
To guide our estimation of the multiple-reflection bias for the nine studies with relatively short cells, we modelled light propagation between two parallel windows of intensity reflectivity R (at each interface) separated by l and enclosing a medium of absorbance  where n is the absorber number density. Summing the transmitted beam intensity over multiple reflections and applying the Beer–Lambert law, the relative bias in the measured cross-section (or absorber concentration) caused by neglecting reflections is
in which  is the effective intensity reflectivity of each two-surface window. Here,
  is the deviation between the apparent absorption cross-section σ' and the true value, σ. Assuming UV-grade fused silica as a standard window material for the sample cells, we estimate
  = 0.077. For these nine studies, based on the reported cell length, sample pressure and 253.65 nm absorption cross-section of ozone, A ranged from 0.5 to 2.7 and
  spanned 0.21%–0.76% with an average value of nearly 0.5%. In contrast, we assumed that there was no multi-reflection bias for the results of Burrows et al [31] because they used a multi-pass cell with an optical path length of 985 cm. Similarly, no bias was assumed for the two sets of measurements reported by Viallon et al [11, 26] because their sample cells had tilted windows. For each work considered, the specific bias correction was incorporated into the combined measurement uncertainty (as a negative-sided component of the uncertainty) but was not used to modify the reported value of the ozone cross-section.
4.1.3. Temperature.
All groups measured the temperature of the gas in the absorption cell, usually by measuring the temperature of the cell itself. Some groups used a temperature-controlled cell to perform measurements over a range of temperatures. While it could be argued that the cell temperature is different than the gas temperature, it has been checked at the BIPM that both measurements provide nearly equivalent results [26]. During the review of the articles, we checked that the uncertainty of the temperature probe was correctly considered, and we verified that all groups waited sufficient time for the gas to thermally equilibrate with the cell.
4.1.4. Ozone pressure.
It is important to note that the Beer–Lambert law relies on the accurate knowledge of the ozone number density, which is deduced by the ideal gas law from the ozone partial pressure and sample temperature (equation (2)). Because pressure sensors measure the total pressure, much effort was made by several groups to produce a pure sample of gaseous ozone, thereby ensuring that the measured total pressure was indeed the ozone pressure. This assumption of sample purity is critical and was carefully investigated by a few groups (UniMin-87 [38], BIPM-15 [26], and Janssen et al [46]) who measured impurities in ozone samples.
In many of the studies considered here, ozone was prepared in the liquid phase from pure oxygen and further purified by pumping. This preparation method was first employed by Inn and Tanaka [35] and subsequently reproduced by many authors. Pure gaseous oxygen is introduced into an 'ozonator' which consists of a container equipped with electrodes that apply sufficiently high voltage to decompose molecular oxygen (O2) into atomic oxygen (O). Gaseous ozone is subsequently formed by collisions and recombination of O and O2. The gas mixture then passes through a cold region of the system immersed in liquid nitrogen, which traps the ozone as a liquid. The ozone is then released into a gas cell by warming the condensate. We note that detailed descriptions of the ozonators that were used are typically not provided in the papers.
When using the ozonator method, authors usually assumed that the ozone sample was pure and measurements of ozone density were traceable to the total pressure. However, some authors estimated the purity of the gas sample and corrected their results accordingly. Ozone mole fraction values between 92% [35], 99% [37], and up to 99.6% [26] were reported. When not evaluated, this was considered as a missing source of uncertainty.
A variation of the pure ozone method was proposed by Hearn [3] who stated that ozone may decompose in time to O2, with the caveat that the only remaining impurity should be O2. He thus proposed to include the ozone decomposition rate in the pressure measurement, making its measurements traceable to the ozone partial pressure. Daumont et al in Reims University also applied the same principle [15, 32], although the assumption that the only impurity is oxygen was called into question by the work of Mauersberger [37] who found O2 present in the sample at the 0.6%–0.8% level as well as combined amounts of H2O, CO and CO2 at the 0.2%–0.3% level. It was also observed by Viallon et al [26] and by Janssen et al [46] that CO2 was created by decomposition of ozone.
Another variation of this method was developed by Molina and Molina [39], who prepared ozone from oxygen and collected it on silica gel maintained at 77 K. This method was subsequently criticized by Yoshino [41] who stated that silica gel also traps oxygen.
One additional effect, which was highlighted by Janssen [46] and by Viallon [26], is the difficulty in accurately measuring the pressure of pure ozone with a capacitance diaphragm gauge. It is standard practice to maintain these gauges at higher-than-ambient temperature, usually near 45 °C, to obtain stable measurements. However, ozone was found to decompose faster in contact with stainless steel heated at this temperature. When not considered, an uncertainty associated with the thermal decomposition of ozone was included.
4.1.5. Isotopic variations.
None of the studies considered here made any mention of the relative abundance of the various isotopocules (corresponding to all ozone isotopologues and isotopomers) comprising the sample gases. However, we note that by far the most abundant ozone isotopocule is 16O16O16O, which accounts for approximately 99.29% of ozone at terrestrial conditions, with the 16O16O18O and 16O18O16O isotopocules having relative abundances of 0.398% and 0.199%, respectively [48]. Thus, we extend the caveat that our reported 253.65 nm absorption cross-sections correspond to the isotopically weighted value that is representative of naturally occurring ozone. In the case of ab initio calculations and IR measurements of rotationally and isotopically resolved transitions, precise comparisons of the measured transition moments and/or intensities of the 16O16O16O isotopocule with the UV cross-section reported here will need to account for this distinction.
4.1.6. Use of a transfer instrument.
Two groups measured the ozone absorption cross-section on pure gaseous samples at another wavelength, in the UV region at the BIPM (value BIPM-15 [26]) and in the IR region at the UPMC (value UPMC-04 [44]), and deduced the absorption cross-section value at the mercury-line wavelength by comparison with an SRP into which mixtures of ozone in air are introduced. In that case, an additional uncertainty component coming from the SRP was expected (without the Type B cross-section contribution). Furthermore, in the history of SRPs, biases were observed in 2006 at the BIPM [47], which were corrected in all SRPs in the following years. Therefore, the SRPs used by the UPMC in 2004 [44] (and NIES in 2006 [10]) were subject to a known bias, leading to an added uncertainty component. Possible correlations due to the existence of these biases were examined. It was observed that the biases were different in each version with the instruments used by the BIPM having no more bias at the time of measurements. Therefore, it was concluded that correlations were negligible.
4.2. Measurements performed on ozone-in-air mixtures
Measurements performed via GPT at the BIPM (value BIPM-16 [11]), the NIES (value NIES-06 [10]), and at Bremen University (Value UniBremen-99 [31, 43]) are traceable to measurements of another compound, and this was expected to be reflected in the uncertainty. However, the traceability for the NIES-06 value was incomplete, because the specified uncertainty for the NO in nitrogen gas standard came from a comparison result rather than from the provider of the standards.
We also considered the efficiency of the reaction between NO and O3 (or O3 to NO2 conversion). For example, it was observed at the BIPM that ozone was not fully converted to NO2, and this unreacted ozone fraction was corrected. Therefore, an additional uncertainty component was introduced to the NIES-06 value, because the occurrence of unreacted O3 was not accounted for in the original study.
Finally, both the NIES-06 [10] and BIPM-16 [11] values were calculated using a comparison between the ozone concentration as measured by GPT on one side, and by a UV absorption cell within an SRP on the other side. Therefore, because both experiments used an SRP as a transfer instrument, we included the uncertainty components already listed in section 4.1.6 for those results.
5. Selected values and revised uncertainties
All papers were reviewed to identify the stated uncertainties, to compare with expected sources described in section 4, and to decide on potential addition of missing components. The details of each paper review are given as supplementary material only, and the summary in this section lists the ozone absorption cross-section measured by each group with its stated standard uncertainty, and the uncertainty after review. The standard uncertainty for the derived NIES-06 [10] absorption cross-section was inferred from the publication because there was no published value for this quantity.
Table 2 summarizes the reported cross-sections and original uncertainties, as well as our revised uncertainties and effective weighting factors (specified below) for each entry. As previously mentioned, the revised uncertainties are two-sided where the asymmetry accounts for known experimental biases in the absorption path length and ozone number density. These two types of biases lead to single-sided uncertainty components of opposite sign denoted by  (negative-going) and
  (positive-going) respectively. Specifically, for nine of the fourteen studies considered here, unaccounted-for multiple reflections would cause reported absorption cross-sections to be higher than the true value: an effect that would contribute to
  . To estimate the magnitude of each component uncertainty, we use a standard uncertainty equal to
  where δ is the estimated relative bias based on the range of experimental conditions. Similarly, for the studies involving purified ozone, we calculated the positive-going uncertainty components
  based on reported (or our estimate of) sample impurity abundances. One special case with positive-going uncertainty components is UPMC-04 [44] where we included published biases in the absorption photometers used by the group.
Table 2. Reported ozone absorption cross-sections,  (in 10−17 cm2 molecule−1) at 253.65 nm (air) and corresponding reported standard uncertainty
  as found in the selected publications given in table 1. The combined standard uncertainties after review are designated by negative- and positive-going uncertainties designated by
  and
and  , respectively. The resulting dimensionless weighting factors returned from our statistical analysis are given by
  .
.
| Publication | i |  |
 |
 |
 |
 |
|---|---|---|---|---|---|---|
| AFCRC-59 | 1 | 1.141 | 0.057 | 0.033 | 0.037 | 0.007 |
| Hearn-61 | 2 | 1.147 | 0.024 | 0.022 | 0.022 | 0.018 |
| JPL-64 | 3 | 1.157 | 0.046 | 0.046 | 0.046 | 0.0041 |
| Griggs-68 | 4 | 1.129 | 0.017 | 0.022 | 0.023 | 0.017 |
| JPL-86 | 5 | 1.157 | 0.012 | 0.012 | 0.009 | 0.078 |
| UniMin-87 | 6 | 1.136 | 0.006 | 0.008 | 0.006 | 0.180 |
| HSCA-88 | 7 | 1.145 | 0.008 | 0.009 | 0.011 | 0.086 |
| UniReims-93 | 8 | 1.130 | 0.015 | 0.016 | 0.015 | 0.036 |
| UniBremen-99 | 9 | 1.150 | 0.030 | 0.030 | 0.030 | 0.0095 |
| UPMC-04 | 10 | 1.150 | 0.004 | 0.022 | 0.023 | 0.017 |
| NIES-06 | 11 | 1.122 | NA | 0.009 | 0.009 | 0.110 |
| UniBremen-14 | 12 | 1.120 | 0.018 | 0.020 | 0.023 | 0.019 |
| BIPM-15 | 13 | 1.127 | 0.005 | 0.005 | 0.005 | 0.340 |
| BIPM-16 | 14 | 1.124 | 0.010 | 0.010 | 0.010 | 0.086 |
With the exception of UPMC-04 in which our relative uncertainty was nearly five times greater than the literature value, the revised uncertainties were generally only slightly larger than the original reported values (average ratio of 1.15). For the case of AFCRC-59, our uncertainty was lower than the originally reported value by about 40%.
6. Calculation of a consensus value
Starting from the literature values for the 253.65 nm ozone absorption cross-section and our revised uncertainties given in table 2, we computed the consensus value,  and its standard uncertainty,
  , and expanded uncertainty
  , using a Monte Carlo method and the DerSimonian-Laird (DSL) estimation procedure described below.
For the eight cross-section values in table 2 that were asymmetric, we modeled the individual measurement results (measured value and associated uncertainty) with skew-normal distributions [49] in which, for the ith result, the mean was equal to the measured value,  , and the 16th and 84th percentiles were equal to
  and
and  , respectively. To understand why the 16th and 84th percentiles were chosen, note that in a Gaussian (or, normal) distribution, the probability of a value lying within one standard deviation of the mean is 68%. Because the distribution is symmetrical around the mean, the probability of a value smaller than the mean minus one standard deviation is 16%, and the probability of a value greater than the mean plus one standard deviation is 84%.
We subsequently fit a random-effects model to the data, using the DSL procedure as implemented in the NIST Consensus Builder [50]. The measured cross-section values used in this model are those reported by the laboratories as given in table 2. For each measurement result including an asymmetric uncertainty, the associated standard uncertainty was the standard deviation of the skew-normal distribution described above, whereas for the others, the model used was a Gaussian (or normal) distribution with mean cross-section equal to the measured value,  and standard deviation equal to the our assigned uncertainty
  . Because the DSL procedure estimates the contribution from 'dark uncertainty' [51] to be zero, the DSL estimate of the cross-section is the conventional weighted average, with weights proportional to the reciprocal squared standard uncertainties. These normalized weights, denoted by
  , are given in table 2.
We then carried out the uncertainty analysis using the Monte Carlo method described by Koepke et al [50], except that the sampling for the cases with asymmetric uncertainties used the skew-normal distributions described above. This approach produced a sample size of 5 × 10⁴ drawn from the probability distribution of the consensus value. Examination of this sample reveals that this distribution differs significantly from Gaussian, even though it is only mildly asymmetrical.
The average of the sample of consensus values obtained from the Monte Carlo method, and the DSL estimate of the cross-section described above, both have five significant digits in common:  = 1.1329 × 10⁻¹⁷ cm2 molecule−1. The associated standard uncertainty is
  = 0.0035 × 10⁻¹⁷ cm2 molecule−1. A symmetric coverage interval (centered at the estimate of the cross-section) that is believed to include the true value of the cross-section with 95% probability was derived from the probability distribution described above. Its half-width is the expanded uncertainty for 95% coverage
  = 0.0069 × 10⁻¹⁷ cm2 molecule−1.
Our analysis also quantifies the relative influence of each datum to the consensus value via the resulting weighting factors given in table 2. Here, the most significant weighting factors correspond to those of BIPM-15 [26], UniMin-87 [37], and NIES-06 [10]. These values are given by ωi = (0.34, 0.18, 0.11), respectively. Together, these three measurements account for slightly more than 60% of the weighted-mean value, with nearly 90% accounted for by also including HSCA-88 [41], BIPM-16 [11] and JPL-86 [39]. Notably, the current reference value for the absorption cross-section from Hearn [3] yields a weight ωi = 0.018 and therefore contributes a relatively small amount to the final result. We also used these factors to compute an ensemble-averaged temperature of 296.5 K, obtained by the weighted addition over all reported temperatures. Given the relatively small temperature dependence of the ozone cross-section, we will consider the final consensus value specified below to be referenced to 296 K, consistent with the choice of standard reference temperatures for spectroscopic databases such as HITRAN [52] and GEISA [53].
Our final result, the Hearn value [3] and the recommended cross-section given in the 2015 status report of the WMO/ACSO O3/UV committee [5] are summarized in table 3. Our consensus value cross-section is 0.4% smaller than that recommended by WMO/ACSO with an uncertainty that is 2.6 times smaller; a statistically significant difference quantifying the value added by the present analysis. Figure 1 also graphically summarizes these results, showing the data scatter, the revised uncertainties and the expanded uncertainty (95% confidence interval). Most importantly, when our consensus value for the ozone absorption cross-section at 253.65 nm is compared to Hearn [3], its value is smaller by 1.23% and its uncertainty is a factor of six times lower.
Table 3. Reported values for the ozone absorption cross-section at the 253.65 nm (air) mercury-line, at room temperature. The last column corresponds to our final results described in the text.
| Hearn-61 [3] | ACSO [5] | This work | |
|---|---|---|---|
 (10−17 cm2 molecule−1) (10−17 cm2 molecule−1) |
1.147 | 1.137 | 1.1329 |
 (10−17 cm2 molecule−1) (10−17 cm2 molecule−1) |
0.024 | 0.009 | 0.0035 |
 (%) (%) |
2.1 | 0.79 | 0.31 |
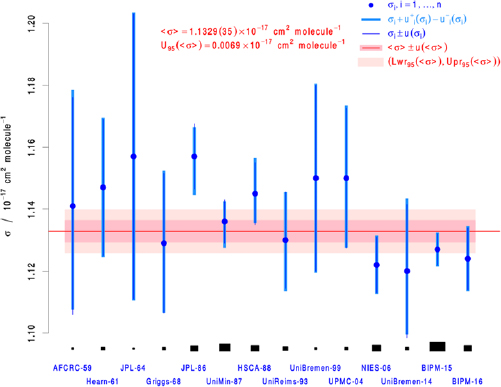
Figure 1. Graphical summary of the literature data and Monte-Carlo/DSL analysis to yield the consensus value and uncertainty for the ozone absorption cross-section at the 253.65 nm (air) mercury-line. The blue dots and the thick, light blue, vertical line segments represent the measurement results σi +  (σi) and σi −
  (σi). The thin, blue, vertical line segments represent σi ± ui(σi), where ui(σi) is the standard deviation of the fitted skew-normal distribution, or of the Gaussian distribution, depending on whether the reported uncertainty is expressed asymmetrically or not. The two horizontal bands in different shades of pink represent two coverage intervals for the true value of the cross-section (approximately 1-sigma and 2-sigma wide, respectively). The areas of the black rectangles are proportional to the weights used to form the consensus value as a weighted average of the measured values.
Download figure:
Standard image High-resolution image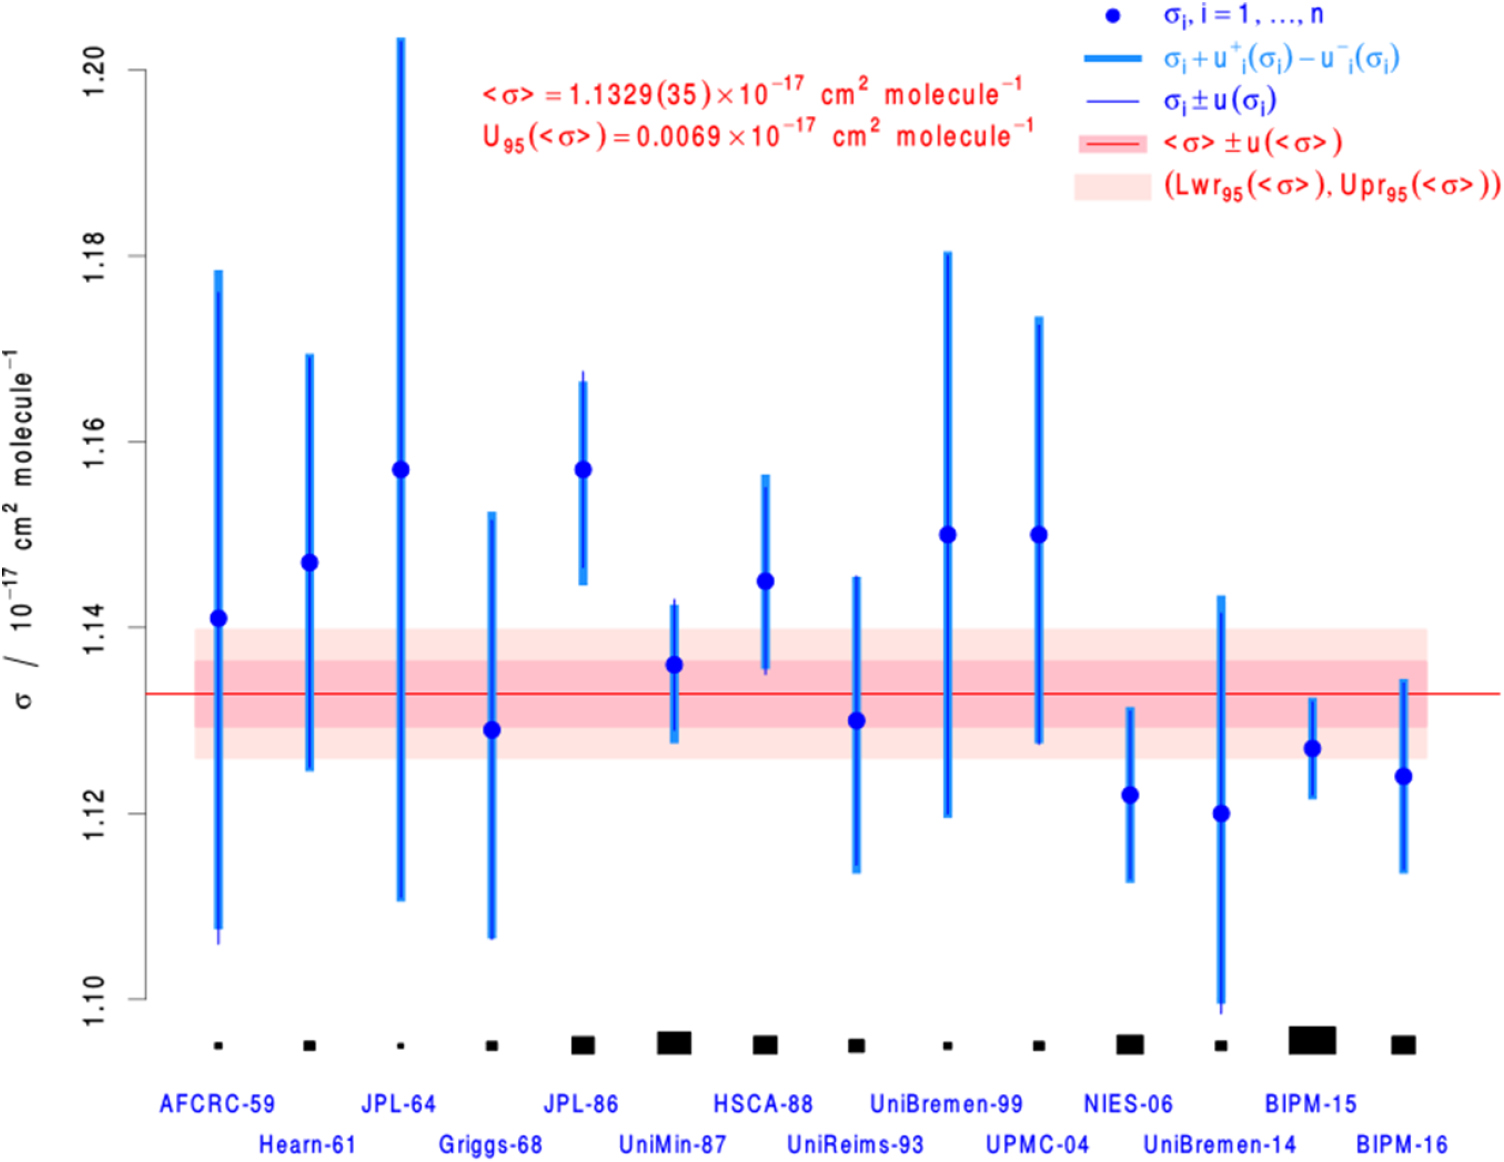
7. Conclusion
In summary, we have completed an uncertainty analysis of fourteen previously published and independent room-temperature measurements of the ozone absorption cross-section at the mercury-line wavelength (253.65 nm). Based on a weighted average of the data, the consensus cross-section value is 1.1329(35) × 10−17 cm2 molecule−1, which represents a statistically significant change in magnitude and reduction in uncertainty by comparison to the conventionally used Hearn value. For mercury-lamp photometers used to monitor air quality, we recommend that our consensus cross-section eventually replaces that of Hearn. We note that all things being equal, adoption of our consensus cross-section value in mercury-lamp photometers will increase the reported atmospheric ozone mole fractions by 1.23%, potentially affecting the number of exceedances of legal threshold limits as was calculated for example by Sofen et al [54]. Because of such ramifications, a coherent strategy for adoption and dissemination of this recommended cross-section value must be agreed-upon by appropriate parties and stakeholders.
Finally, we note that the ozone absorption cross-section at 253.65 nm (air) which is archived in HITRAN 2016 equals 1.145 × 10⁻¹⁷ cm2 molecule−1. This value is 1.06% greater than our recommended value and 0.17% smaller than that of Hearn. Thus, the ozone Hartley-band cross-sections given in HITRAN 2016 and other databases may be rescaled accordingly. Using our consensus value of 1.1329 × 10⁻¹⁷ cm2 molecule−1, other ozone band cross-section or line intensity data throughout the UV, VIS and IR that are referenced to other Hartley-band measurements at 253.65 nm (air) also can be rescaled.
Acknowledgments
The CCQM/GAWG Task Group thanks the management and parent organizations of all committee members for supporting this effort.
Portions of the research described in this paper were performed at the Jet Propulsion Laboratory, California Institute of Technology, under contract with the National Aeronautics and Space Administration, California Institute of Technology. Government sponsorship acknowledged.