


Abstract
Understanding how diffusion takes place within nanocrystals is of great importance for their stability and for controlling their synthesis. In this study, we used the strain sensitivity of Bragg coherent diffraction imaging (BCDI) to study the diffusion of iron into individual gold nanocrystals in situ at elevated temperatures. The BCDI experiments were performed at the I-07 beamline at Diamond Light Source, UK. The diffraction pattern of individual gold nanocrystals was measured around the (11-1) Bragg peak of gold before and after iron deposition as a function of temperature and time. Phase retrieval algorithms were used to obtain real space reconstructions of the nanocrystals from their measured diffraction patterns. Alloying of iron with gold at sample temperatures of 300 °C–500 °C and dealloying of iron from gold at 600 °C were observed. The volume of the alloyed region in the nanocrystals was found to increase with the dose of iron. However, no significant time dependence was observed for the structure following each iron deposition, suggesting that the samples reached equilibrium relatively quickly. The resulting phase distribution within the gold nanocrystals after the iron depositions suggests a contraction due to diffusion of iron. Our results show that BCDI is a useful technique for studying diffusion in three dimensions and alloying behaviour in individual crystalline grains.
Export citation and abstract BibTeX RIS

Original content from this work may be used under the terms of the Creative Commons Attribution 3.0 licence. Any further distribution of this work must maintain attribution to the author(s) and the title of the work, journal citation and DOI.
Introduction
Understanding and controlling how the diffusion process works at the atomic scale is an important question in synthesis of materials. For nanoparticles, the stability, size, structure, composition, and atomic ordering all become dependent on position inside the particle and diffusion not only affects all of these properties but is itself affected by them [1–4]. Much of the interest in nanotechnology arises from the ability to limit or control diffusion, for example in the construction of multilayers or core–shell nanoparticle systems [5–7]. Much of the commercial interest in nanoparticle catalysts, for example, comes from being able to locate an expensive element strategically at locations which are most effective for reaction [8–10]. The properties itemised above are fundamental in determining the suitability of a particular nanocrystal construct for applications. Thus, investigating the mechanisms and effects of diffusion in nanocrystals will help in their controlled synthesis to obtain the desired properties.
Conventional methods for studying diffusion in solids all have limitations [11]. Direct methods such as mechanical and sputter profiling [12], secondary ion mass spectrometry [13, 14], and electron microprobe analysis [15, 16] investigate diffusion by measuring the profile of the diffusing element in a solid material. These methods provide only a macroscopic quantity, the diffusion coefficient. On the other hand, indirect methods such as quasielastic neutron spectroscopy [17–19] and Mössbauer spectroscopy [20–22] can provide microscopic information on the diffusion process but are limited to a narrow number of isotopes and relatively fast diffusivity values. Moreover, these existing methods for diffusion studies in solids tend to average the signals over a number of structures. Spatially resolved diffusion measurements are important for nanocrystals because sample heterogeneity is significant and can affect results. Transmission electron microscopy (TEM) allows diffusion to be studied in individual nanoparticles [23, 24]. However, TEM is limited to thin samples (<100 nm) and the thinning during sample preparation can be destructive. Hence, due to the limitations described above, there is a need for imaging techniques which are sensitive to slower dynamics and allow the diffusion behaviour in individual nanocrystals to be investigated at the atomic scale and in three dimensions (3D).
Bragg coherent diffraction imaging (BCDI) is a developing technique utilising coherent x-rays which allows strain within individual nanocrystals to be mapped in 3D [25–27]. Due to the coherence of the x-ray beam, optical elements are not required to probe the structure of an individual nanocrystal. The diffraction pattern of an object is measured and from that, the 3D structure of the object in real space is reconstructed using iterative phase retrieval algorithms [28–30]. The phase retrieval algorithms involve switching between the real and Fourier domain through the use of fast Fourier transform and application of the measured data or known constraints in each domain until convergence is reached.
The reconstructed electron density consists of magnitude, usually referred to as amplitude, and phase which correspond to the crystal morphology and strain, respectively. When a region in a crystal is strained, the atoms displaced from the ideal lattice will diffract x-rays with a phase shifted from that of the unstrained regions. The phase shift can be expressed as
where u(r) is the displacement vector and Q is the scattering vector. Hence, the strained region in the crystal will be manifested in the final image as a region of complex density with the same magnitude as the rest of the crystal but with a phase shift of Δϕ(r). BCDI has a picometre strain sensitivity which is higher than the spatial resolution of the technique (10–20 nm). The ability to image strain below the spatial resolution is due to the fact that strain fields are long-ranged and therefore, atomic level displacements or distortions can be identified by their strain signatures. Since the phase shift is the scalar product of the scattering vector and displacement field, only the projection of the displacement field onto the selected Q-vector is measured.
The ability of BCDI to image strain in 3D in individual nanocrystals is extremely useful and highly novel. BCDI has been used to obtain the full strain tensor in nanocrystals [31, 32] and to study the structure of and strain within nanowires [33–35] and other materials [36–38]. It has also been applied in the study of dynamic processes such as investigation of lattice dynamics [39].
The strain sensitivity of BCDI can be utilised to investigate the diffusion of atoms into a nanocrystal. Diffusion is expected to induce lattice distortions which are then measurable by BCDI thus giving insight into the process. The use of BCDI in studying diffusion was previously investigated by Xiong et al [40] by looking at copper diffusion in an individual gold nanocrystal.
This study builds on the previous work and utilises BCDI to investigate the 3D diffusion behaviour in another gold alloy system: gold–iron. Incorporation of iron into nanoparticles can be used to introduce interesting magnetic properties: pure iron is ferromagnetic with high saturation magnetisation. However, it is prone to oxidation and has high cell toxicity when used in a medical context. On the other hand, gold nanoparticles have interesting optical properties and their surface can be functionalised. Hence, by synthesising gold–iron nanoparticles, one can obtain a material with both magnetic and optical properties which has the capability of being made biocompatible and protected from oxidation. Gold–iron nanoparticles have potential for applications in magnetic resonance imaging, hyperthermia, and targeted drug delivery [41–44].
Methodology
Preparation of gold nanocrystals
Gold nanocrystal samples were prepared using the dewetting method to obtain an array of isolated particles on a silicon-wafer substrate. Silicon wafers were first cleaned with a Pirahna solution, which is a mixture of 3:1 concentrated H2SO4 to 30% H2O2. A 5 nm titanium layer was then deposited onto the silicon-wafer followed by the deposition of an 18 nm gold layer through thermal evaporation. The thin film was then annealed in air at 980 °C for 12 h in a laboratory furnace to dewet the film from the substrate to form isolated gold nanocrystals. The titanium film acted as an adhesion layer to help sample stabilisation [45, 46].
The gold nanocrystals were imaged using a JEOL JSM-660LV scanning electron microscope (SEM) at a voltage of 25 kV. Figure 1 is an SEM image of a sample containing the dewetted gold nanocrystals, which have spherical or curved regions and flat facets. The average Feret diameter (longest distance between any two points along a region of interest boundary) of the sample is 428 ± 211 nm.
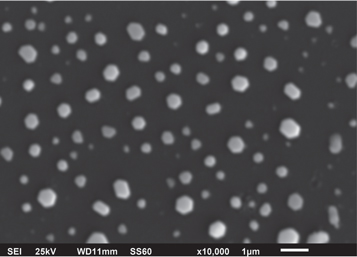
Figure 1. SEM image of the gold nanocrystals, at a magnification of ×10000, obtained by the dewetting method.
Download figure:
Standard image High-resolution imageBCDI experimental set-up
The BCDI experiments were performed at the I-07 Beamline at the Diamond Light Source, UK. The sample was mounted on a hexapod sample stage in the vertical scattering geometry. The motions of the hexapod sample stage were passed through the wall of an ultra-high vacuum chamber, which was kept at a pressure of 10–10 mbar, through the use of bellows and rotary vacuum seal [47]. The energy of the incident x-ray beam was set to 9 keV, selected using a Si-(111) double crystal monochromator with an energy resolution (ΔE/E) of <1 × 10⁻⁴. This gives a longitudinal coherence length of 690 nm, larger than the maximum optical path length difference of the x-rays passing through the sample. The spatial coherence length is 2.76 μm and 1.10 μm in the horizontal and vertical direction, respectively. These values are larger than the size of the gold nanocrystals in the sample thus ensuring spatial coherence in the experiments.
A pair of high-resolution slits (JJ x-ray, Denmark) was placed before the sample to define the size of the beam. The horizontal and vertical slit sizes were set between 15 and 20 μm depending on the density of the diffracting nanocrystals in the sample. The incidence angle of the x-ray beam at the sample surface normal was set to 4° to reduce the beam footprint and avoid getting crowded or overlapping diffraction patterns on the detector frame.
The evaporation of iron onto the sample was achieved using an EGN4 mini electron beam evaporator from Oxford Applied Research, UK. Iron rods of 2 mm diameter and 23 mm in length were used for the iron deposition.
The diffraction from the sample was measured using a Pilatus 100 K detector (Dectris Ltd, Switzerland) with 487 × 195 pixels of 172 × 172 μm pixel size. The detector was positioned 1.52 m away from the sample. This ensured the diffraction from the sample was in the far-field and gave sufficient diffraction oversampling, required for phase retrieval during the reconstruction process, of more than two pixels-per-fringe for all samples. A flight tube, which was under vacuum, was placed between the sample and the detector to reduce the absorption of x-rays by gas molecules which would otherwise decrease the number of photons reaching the detector.
Sample measurements
The gold nanocrystals were measured before the deposition of iron. The sample and detector were oriented along the off-specular (11-1) Bragg reflection of gold. The {111} family of planes of fcc gold is the strongest preferred orientation of gold at silicon substrate. An isolated diffraction pattern, which represents an individual nanocrystal, from the sample was selected. A rocking curve of the Bragg diffraction was then obtained by an ω-scan to yield a 3D data set, rotating the sample around the Bragg peak over a small angular range of less than half a degree with a step size of 0.005°. The selected diffraction pattern was measured continuously around the (11-1) Bragg reflection of gold for several hours after the deposition of iron finished.
Three samples were examined in this study. Iron was deposited onto the samples at different sample temperatures in several stages as shown in table 1. Nanocrystal 3 was heated to a sample temperature of 600 °C after the two stages of iron deposition. The sample stage was heated to the desired sample temperature by electron bombardment of a filament placed behind the sample. The sample temperature was controlled by varying the filament current. A thermocouple was used to read the temperature at the sample stage.
Table 1. Parameters for iron deposition.
| Layer thickness of iron, nm | ||||
|---|---|---|---|---|
| Nanocrystal | Sample temperature, °C | 1st stage | 2nd stage | 3rd stage |
| 1 | 400 | 4.72 | 9.44 | 9.44 |
| 2 | 300 | 4.72 | 9.44 | — |
| 3 | 500 | 4.72 | 9.44 | — |
Reconstruction of the gold nanocrystals
The iterative phase retrieval algorithms were performed in MATLAB R2013a using a version of the 'matlabPhasing' package. An initial estimate of the object was made from an array with the same size as the measured data. Inside the array was the support of the object consisting of a uniform distribution of random numbers from zero to one. The support of the object defined the boundary in which the object was allowed to exist and was used as the real space constraint. This support was allowed to evolve during the iterations using Shrinkwrap [48]. Shrinkwrap was applied every five iterations of the algorithm and the support was kept fixed in between. The magnitude of the measured diffraction pattern was used as the Fourier space constraint.
A guided approach [28] was used together with the error reduction (ER) and Hybrid Input Output (HIO) algorithms [29]. A feedback parameter of 0.9 was used for the HIO algorithm. Sixteen independent runs consisting of 200 iterations each were performed. Each run had a different random start. The 200 iterations started with ER. The algorithm was switched to HIO at the 5th iteration and was switched back to ER at the 180th iteration. After the 16 independent runs of the ER/HIO algorithm, the solution with the minimum sharpness, defined as the fourth power of the amplitude, in real space was selected as the template for the next generation of 16 independent runs of the ER/HIO algorithm. The template was used to generate the new set of initial guesses for the next generation. This was performed by taking the geometric average of the template and the remaining solutions. The new set of initial guesses consisted of the template and the fifteen resulting solutions after the breeding. Eight generations of sixteen independent runs of the ER/HIO algorithm were performed in total. After the eight generations, the average of the five solutions with the lowest sharpness was calculated and considered to be the final solution.
The real space pixel size, s, of the reconstructions, was determined through the following equations


where D = 1.52 m is the sample to detector distance, d = 172 μm is the pixel size of the detector, N is the array size of the data, and Δθ = 0.005° is the step size of the rocking curve scan.
3D images of the reconstructions were viewed using the software ParaView version 4.1.
Results and discussion
The diffusion of iron into individual gold nanocrystals was examined at sample temperatures of 300 °C–600 °C as shown in table 1.
Figure 2 shows the change in the diffraction pattern of nanocrystals 1 and 3 after the iron depositions. Before iron deposition, it can be observed that the pattern is locally symmetric about the centre of its Bragg peak. This apparent centrosymmetry is a known symmetry of the Fourier transform of a real object, hence suggests the sample image is real at this stage, i.e. without strain. Furthermore, the diffraction pattern of the nanocrystals is characterised by radial flares of intensity with fringes of modulation. The flares in the diffraction patterns point along the directions of the crystal facets and result from the enhancement of intensity along these directions, which is a well-known diffraction effect called a crystal truncation rod [49, 50]. Meanwhile, the fringes of modulation arise from the coherence of the beam incident on the sample, causing interference of the scattered waves from all parts of the sample.
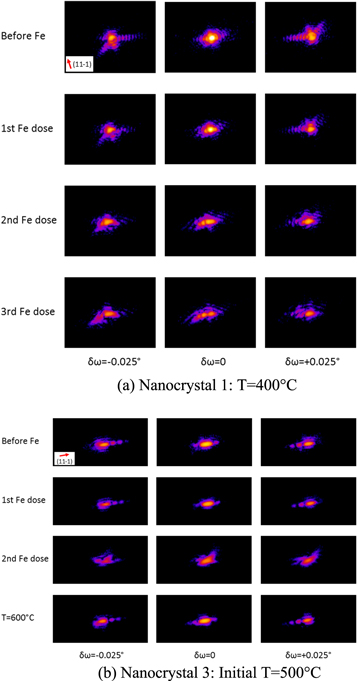
Figure 2. Changes in the diffraction pattern of the nanocrystals after iron deposition.
Download figure:
Standard image High-resolution imageAfter the iron depositions, the diffraction pattern of the nanocrystals became more asymmetrical. The asymmetry of the diffraction pattern signifies the presence of strain, which could be due to the diffusion and insertion of iron atoms into the gold lattice leading to lattice distortions from the ideal lattice of gold. In the inverted image, the presence of strain causes the image density to become complex-valued resulting in the loss of its centrosymmetry in its diffraction pattern. Furthermore, it can also be observed in the diffraction pattern of the nanocrystals that the flares were reduced after the iron depositions. This suggests that the flat facets were disappearing and that the nanocrystal surface was becoming rounder or rougher as more iron alloyed with gold. A similar change in the diffraction pattern of nanocrystal 2 after iron deposition at 300 °C was observed (see figure S1 is available online at stacks.iop.org/NJP/20/113026/mmedia in supplementary materials).
For nanocrystal 3, it can be observed that after increasing the sample temperature to 600 °C, the diffraction pattern became more symmetrical, resembling the diffraction pattern of the nanocrystal before the iron deposition at 500 °C. The flares of intensity in the diffraction pattern point towards the nanocrystal facet directions again. This suggests that the distortions in the nanocrystal were relieved after the increase in temperature.
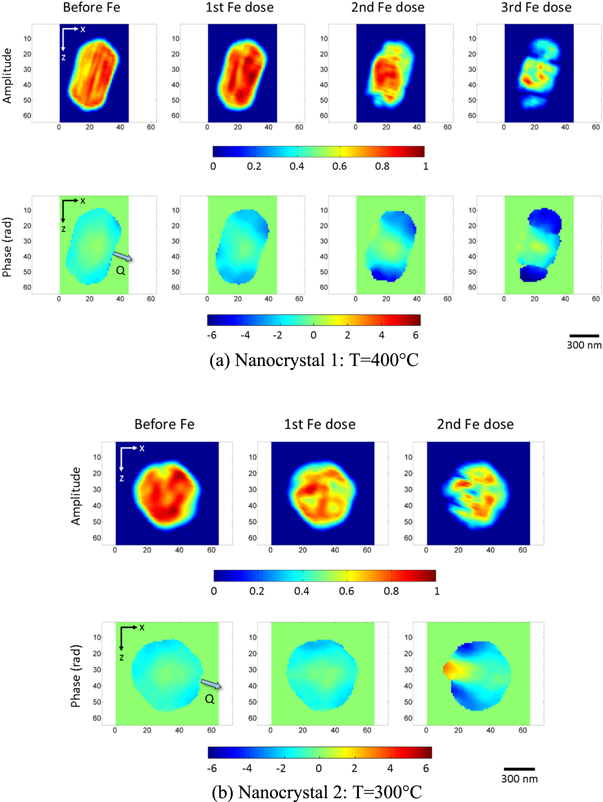
Figure 3 shows the amplitude and phase of the reconstructed images of the nanocrystals before and after iron deposition. The images shown are xz-cut planes, which are parallel to the substrate plane, taken near the centre of mass. Refer to figures S2 and S3 in supplementary materials for all the images during the time series performed after each stage of iron deposition. Positive phase values represent displacements along the Q-vector, which is (11-1) here, while negative phase values represent displacements along the opposite direction. The total amplitudes and root-mean-squared (rms) phases in the nanocrystals during the time series after each stage of iron deposition were calculated and are shown in figure 4. The total amplitude values shown were normalised against the total amplitude for the control samples.
Download figure:
Standard image High-resolution image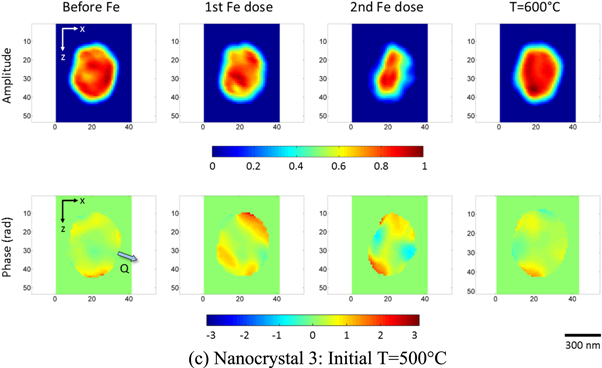
Figure 3. Reconstructed amplitude and phase images near the centre of the nanocrystals before and after iron deposition (1 pixel = 16.28 nm). The direction of the Q-vector, which is along the (11-1) direction, is shown by the arrow in the control phase images.
Download figure:
Standard image High-resolution image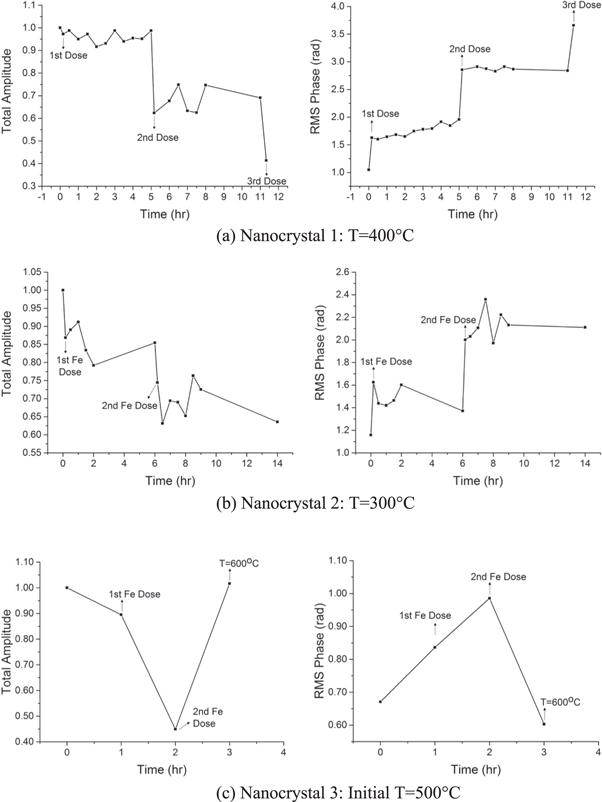
Figure 4. Changes in the amplitude and phase of the nanocrystals over time after iron deposition.
Download figure:
Standard image High-resolution imageIt can be observed from the amplitude images and calculated total amplitudes of the nanocrystals that the amplitude decreased after each stage of iron deposition. The amplitude in the shell decreased significantly causing a broader distribution of amplitude values. The density fluctuations (striped pattern) that can be observed in the reconstruction of nanocrystal 1 before the iron depositions is a well-known artefact of BCDI which arise from Fourier series termination errors in the reconstructions, particularly of sharp-edged objects [51, 52]. Meanwhile, the phase images and calculated rms phases of the nanocrystals show that the phase increased after each stage of iron deposition, indicating deviation from the ideal lattice of gold attributed to the diffusion of iron into the gold nanocrystals. The diffusion of iron is presumed to cause substitutional alloying of iron with gold which then resulted into a different lattice parameter.
In here the measurements were done at the (11-1) Bragg peak of gold and hence, the phase in the alloyed region of the nanocrystals would be shifted from that of the unalloyed region due to the change in the lattice parameter. Furthermore, for nanocrystals 1 and 2, the amplitude and phase did not change significantly during the time series after each stage of iron deposition. This suggests that the diffusion of iron into the nanocrystals occurred very fast at 300 °C and 400 °C, relative to the measurement time. No time series was performed for nanocrystal 3.
It can be further observed that after each stage of iron deposition, the sharp edges where the crystal facets meet, became rounder and the surface became rougher as the facets disappeared due to the decrease in amplitude in the shell. This is consistent with the changes in the diffraction patterns noted above.
The decrease in the amplitude in the shell after the iron depositions was not necessarily due to disappearance of material. It can be attributed to the alloying of iron with the gold nanocrystals leading to the loss of the gold crystalline order. The scattering amplitude of a material is the Fourier transform of the electron density. Since iron atoms have fewer electrons than gold, the scattering amplitudes of the nanocrystals were reduced in the regions where gold was alloyed with iron. Furthermore, since the lattice parameter of the gold–iron alloy becomes smaller with increasing iron content, this will cause distortions. Hence, the alloying of iron with gold in the nanocrystals results in lattice contraction. Since the measurements of the nanocrystals were done at the (11-1) Bragg peak of gold, a significant change in the lattice constant in the alloyed regions in the gold nanocrystals could cause these regions to not contribute to the signal in the detector frame thus leading to a decrease in the measured amplitude. If a new crystal phase of alloy were to form, as in the case of gold–copper [40], this would take away from the gold diffraction peak, but iron and gold are continuously miscible.
Furthermore, it can be observed from the phase images of the nanocrystals that the increase in phase after the first iron deposition was confined in the shell signifying that the core region remained unalloyed with iron and that the iron diffusion only reached a certain depth from the surface. After more iron was added, the depth of the distorted region continued to increase signifying that iron was diffusing further into the nanocrystals and that the volume of the alloyed region was increasing. It is possible that given enough iron concentration, the whole crystal would alloy with iron after some time. In addition, it can be observed that the decrease in amplitude in the shell after the iron depositions overlaps with the distorted regions confirming that the core remained unalloyed; the alloyed region was confined in the nanocrystal shell. We note that the strain observed in BCDI is a differential quantity, which directly sees gradients; if the whole crystal were uniformly alloyed, the Bragg peak would simply shift and retain its unstrained shape.
In addition, it can also be observed that after the sample temperature was increased to 600 °C for nanocrystal 3, the crystal returned toward its original shape before deposition and the phase in the nanocrystal decreased. This could be due to dealloying of iron at the higher temperature thus restoring the gold crystalline material in the nanocrystal and relieving the distortions. Complete phase segregation of iron and gold in gold–iron nanoparticles at 600 °C has been observed by Velasco et al [53]. A more interesting possibility is that the iron simply becomes more uniformly distributed within the crystal. So as long as the overall shape has not changed by alloying, the homogeneous distribution of iron will give the whole crystal a smaller lattice parameter, but no strain gradients. The Bragg peak will be shifted, but this might not be noticed because thermal expansion acts in the opposite direction.
Line-outs of the phase in nanocrystal 1 were taken along the z-axis direction and are shown in figure 5(a). The phase is seen to decrease from the surface to the core showing the variation in the distortions with depth. It can be further observed that the boundary between the alloyed and unalloyed region of the nanocrystal became clearer as more iron was deposited. This is evident from the change in the gradient of the curves when more iron was deposited. These observations report the gradient in the iron concentration, decreasing with depth. Both the increase in phase and the increase in volume of the alloyed region at each stage of iron deposition are clearly evident in the line-out profiles. The same observations were found for the other nanocrystals (see figure S4 in supplementary materials).

Figure 5. Line-out of phase of nanocrystal 1 before and after iron deposition.
Download figure:
Standard image High-resolution imageIf a line-out of the phase along the Q-vector, as sketched in figure 6(a), for each stage of iron deposition in nanocrystal 1 is taken, the line-out profiles shown in figure 5(b) are obtained. This direction passes through the facets which align or almost align with the Q-vector unlike the z-axis line-outs. The phase obtained from this line-out is less than the phase observed for the other facets in the nanocrystal; the strong negative phase is associated with the facets not-aligned with the Q-vector. It can be further observed from figure 5(b) that after the second and third iron depositions, the phase goes from positive to negative from the left side to the right side of the nanocrystal. This phase pattern signifies an inward contraction, sketched in figure 6(b). This means that after the second and third iron depositions, there is enough iron concentration to cause a significant change in the lattice constant in the alloyed region in the nanocrystal. This quantitative way of presenting the data agrees generally with the interpretation of the phase images. The contraction can also be seen for the other nanocrystals and was already observed after the first iron deposition for nanocrystal 3. This may be understood as coming from very different diffusion rates at 500 °C than at 300 °C and 400 °C. Note that the Bragg density only records the atoms on lattice sites which contribute to the Bragg peak. When disorder is introduced, the total amount of Bragg density is reduced, unlike the real physical density. There is no conversation of Bragg density expected. Bragg density is not the same as physical density and sees only the crystalline ordered part.
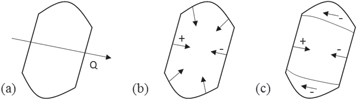
Figure 6. Phase patterns expected for different distortions. (a) Line-out taken along the Q-direction. (b) Inward contraction of the nanocrystal and the corresponding phase pattern that should be observed. (c) Overall phase pattern observed for the nanocrystals.
Download figure:
Standard image High-resolution imageThe radial inward contraction would not be visible in the not-aligned facets because BCDI is only sensitive to displacements along the Q-vector of the chosen Bragg peak and, therefore, perpendicular displacement components would not be observed [54, 55]. Hence, the strong negative phase observed in these not-aligned facets of nanocrystals 1 and 2 (positive phase for nanocrystal 3) cannot be explained by the radial contraction. The phase pattern in the shell region near these facets occupies a cylindrical shell with displacements opposite to the Q-vector (towards the Q-vector for nanocrystal 3). Again, the difference in the sign of the displacement between nanocrystal 3 and the other nanocrystals may arise from very different diffusion rates at 500 °C than at 300 °C and 400 °C. The overall phase pattern for the nanocrystals is illustrated in figure 6(c). If a lateral contraction were present in the facets not-aligned with the Q-vector, the phase pattern would consist of both positive and negative phases in the corners of the facets [55].
The phase pattern of the nanocrystals and decrease in amplitude after each stage of iron deposition can be seen more clearly in the 3D phase isosurface images shown in figure 7. A threshold level of 25% was used where amplitude values below this level were not shown. The isosurface images clearly show a strong negative phase (positive phase for nanocrystal 3) on the shell except on the two facets along the Q-vector. Furthermore, it can be observed clearly that the alloyed region in the nanocrystal increased after each stage of iron deposition. See figure S5 in supplementary materials for the 3D phase isosurface image of nanocrystal 2.

Download figure:
Standard image High-resolution image
Figure 7. Phase isosurface images of the nanocrystals before and after iron deposition (1 pixel = 16.28 nm). The colour of the isosurface image represents the phase of the complex amplitude.
Download figure:
Standard image High-resolution image
The presence of dislocations alone also cannot produce the strong phase pattern observed in the nanocrystal facets not aligned with the Q-vector. This is because of the symmetry in the distortions around dislocations. A dislocation would cause the bending of the lattice planes surrounding the dislocation. These distortions would cause opposing signs of phase shifts [35, 56] since the directions of the distortions around the dislocation are of opposing signs. Indeed, dislocations have a signature phase pattern of a 2π rotation. A dislocation loop would produce the same phase pattern in 3D and these have indeed been seen in BCDI experiments [57, 58]. However, the presence of dislocations in the nanocrystals cannot be completely eliminated as it is possible that the resolution in the experiments is not enough to view a single dislocation. Hence, the net amount of phase shift from dislocations measured over a larger volume of the nanocrystals would be zero.
It is possible that there are other defects present in the nanocrystals that cause the strong phase pattern. Since the diffusion of iron into the gold nanocrystals results in a smaller lattice constant in the alloyed region (the nanocrystal shell), there will be a lattice misfit between the alloyed region and gold core. The interface between the two is therefore highly unstable. To accommodate the lattice misfit, misfit dislocations may occur. Such misfit dislocations become energetically favourable above a certain critical thickness of the alloyed region [59]. The formation of misfit dislocations for gold–iron film on gold substrate has been observed experimentally for gold–iron film thickness of 10 Å [60]. Misfit dislocations can then dissociate into Shockley partial dislocations when they glide which leave behind intrinsic stacking faults in the nanocrystals [61, 62].
Stacking faults can break the symmetry in the phase shift observed from the simple radial contraction pattern and formation of dislocations described above and produce an overall negative phase shift (or positive phase shift) in the facets not aligned with the Q-vector. The x-rays passing through the faulted region below or above the stacking fault plane will be diffracted with a phase shift of Q·R, where R is the displacement vector [59, 63]. For fcc metals, the phase shift is restricted to 2πn/3 where n = 0, ±1, ±2, .... The faulted region becomes invisible when the displacement vector is perpendicular to the Q-vector because in such case, the phase shift is zero. The choice of faulting slip direction is not random in the presence of strain and is biased in the direction of strain relief. Indeed, the strong negative phase shift (positive phase shift for nanocrystal 3) was not observed in the facets whose directions almost align with the Q-vector because in this case R is perpendicular to the Q-vector and hence, Q·R = 0. However, additional imaging experiments are required to confirm the presence of stacking faults or other defects in the nanocrystals.
Similar changes in amplitude and phase were observed for another nanocrystal after three stages of iron deposition at a sample temperature of 400 °C (see figures S6 and S7 and table S1 in supplementary materials).
Conclusions
The results from the study show the ability of BCDI to study the 3D diffusion and alloying behaviour in individual nanocrystals at the atomic scale. The changes in the structure of individual gold nanocrystals as a result of diffusion of and alloying with iron at different temperatures and metal doses were successfully investigated with picometre strain resolution.
Alloying of the gold nanocrystals with iron was observed at sample temperatures of 300 °C–500 °C while dealloying of iron from gold was observed at 600 °C. The diffusion of iron was found to be confined to a shell of the nanocrystal, whose volume increased after each stage of iron deposition. No significant changes were observed in the gold nanocrystals during the time series performed after each iron deposition thus suggesting that a state of quasi-equilibrium had been reached with a few minutes after each stage of iron deposition.
The phase pattern in the facets of the nanocrystals which are aligned with the Q-vector showed contraction within the nanocrystals. The contraction within the nanocrystals, however, cannot explain the strong phase pattern observed in the facets which do not align with the Q-vector. The phase associated with these facets decreased with depth from the nanocrystal surface which can be due to the iron gradient decreasing with depth in the alloyed regions.
Acknowledgments
We thank Professor Alexander Korsunsky, Professor Felix Hofmann, and Dr Edmund Tarleton for advice and discussion on the manuscript. This work was supported by an EPSRC grant EP/I022562/1, 'Phase modulation technology for x-ray imaging' and an ERC Advanced Grant 227711, 'Exploration of strains in synthetic nanocrystals'. Work at Brookhaven National Laboratory was supported by the US Department of Energy, Office of Basic Energy Sciences, under Contract DE-SC00112704.