


Abstract
The accuracy of neutron scattering cross sections is the gauge for the realistic outcome of a neutron transport simulation. To improve the traditional harmonic physics model used in such simulations, we revisit the slow neutron transport theory in crystalline materials and aim to develop a unified model that has good performance for neutron transport problems in crystals in a wide range of temperatures and pressures. The quasi-harmonic approximation (QHA) correlates phonon evolution explicitly with unit cell volume. Therefore, it is capable of evaluating a variety of material properties at finite temperatures. In this work, we show numerically that it is a very effective tool for our application as well. Within the framework of QHA, we calculate the temperature dependent characteristics of phonons in three elemental crystals, namely Be, Mg and Al. Based on the obtained results, our calculated neutron total cross sections agree closely with experimental transmission cross sections in a large temperature range below the melting point. We show that as the harmonic cross section model ignores the effects of phonon softening in these crystals, it underestimates the total inelastic cross sections at high temperatures. In the case of Al, we observe that such underestimation is up to 7% at room temperature. In addition, we study the phonon–phonon scatterings in Al. We observe that the cross section is insensitive to the finite phonon lifetimes even at 800 K.
Export citation and abstract BibTeX RIS

Original content from this work may be used under the terms of the Creative Commons Attribution 3.0 licence. Any further distribution of this work must maintain attribution to the author(s) and the title of the work, journal citation and DOI.
1. Introduction
The objectives of this work are twofold. We show the limitations of the traditional harmonic neutron cross section model and the closer agreement with data when employing the quasi-harmonic approximation (QHA). We also investigate the feasibility of studying the deviation of vibrational density of states (VDOSs) using the transmission cross sections measured at different conditions.
After the pioneer works [1–3] on the neutron scattering in crystals in the 1950s, researchers from General Atomic established a practical methodology [4, 5] to produce neutron scattering cross sections in crystalline materials. In this methodology, force constants are obtained by fitting simple interatomic force models with measured neutron scattering data to calculate the lattice VDOSs (e.g. [6, 7]) . The resultant VDOS is then fed into the cross section model in the harmonic incoherent approximation [8, 9]. In such a way, the VDOS is elevated to be the only lattice dynamical property that the total inelastic neutron scattering cross sections depend on. This methodology simplifies the treatment of coherent effects and always predicts smooth angular distributions of the scattered neutrons. Although it is not realistic to describe small energy transfer scatterings in strong coherent scatters, it facilitates adequately accurate simulation of neutron slowing down and transport in a wide range of applications. Being physically sound and computationally inexpensive, this methodology has successfully served the community for many decades now (see the development histories in the headers of the state-of-the-art thermal neutron data files in [10, 11]). Since the last decade, the VDOS produced by modern density functional theory (DFT) calculations [12] have been used to estimate neutron cross sections (e.g. in [13–15]) to either revisit neutron transport problems or account for missing materials in the standard neutron data libraries. Interestingly, a comparison study [16] suggests that the cross sections calculated based on the VDOS given by the DFT methods do not produce any remarkable differences in the estimated criticality factors of graphite-based reactors. As a result, the state-of-the-art thermal neutron data for graphite in JEFF [10] are still produced using the original VDOS. Of course, considering that there are a wide variety of applications besides criticality calculations, it may be difficult to justify the procedure of selecting VDOS to cover all the technical aspects. On the other hand, in any application, understanding the uncertainties associated with the results is as important as obtaining the actual results. In that respect, a notable development for the uncertainty estimation that is based on the cross section sensitivity to the input VDOS has been recently proposed [17]. What is concerned in this work is the uncertainties of the harmonic approximation used at high temperatures from the physical perspective. When the traditional harmonic approximation is employed in a Monte Carlo neutron transport model, the simulated scattering process does not provide a good representation over a wide range of temperatures. Very often, if the VDOSs used for cross section calculation is a good fit at low temperatures, the disagreement between the calculated and measured cross sections becomes significant at high temperatures, and vice versa. As the strict harmonic model has been inherited by the downstream general Monte Carlo particle transport codes, such as MCNP [18] and Geant4 [19, 20], we expect that the simulations of neutron slowing down and transport in many high temperature crystalline materials are subject to relatively large uncertainties, because the lattice properties may be modified significantly by anharmonic effects.
Neutron nuclear interaction with a nucleus depends strongly on the incident energy and motion of the nucleus. At high incident energies, nuclei motions in a material can be considered as independent of each other, and follow a Maxwellian of temperature. Based on this so-called free-gas approximation, the Doppler effects on cross section resonances can be accurately modelled at finite temperatures [21]. However, because of interference effects, such approximation can no longer hold true in condensed matter where the wavelength of an incident neutron is comparable with the range of which the motions of nuclei are coupled. Therefore, in order to model the scattering process, material structural and dynamical properties need to be understood.
The collective excitations of crystal lattice can be described quantum mechanically as phonons [22]. A phonon is a quantum state of an energy transfer in a scattering and is characterizable by vibrational energy and eigenvector. The kinetics of neutron–phonon scattering obey energy and momentum conservation, and phonon characteristics are directly observable in the neutron double differential cross sections of single phonon scattering [23]. In classical mechanics, the maximum fraction of energy deposition of a neutron scattering in matter depends only on the mass of the target nucleus; while in quantum mechanics, this strict limit does not exist. The reason is that there is no constraint to the number of phonons that may be present in the scattering process at any given incident energy, though the scattering probability quickly decays beyond the classical limit. Generally, at a higher incident energy, a greater number of phonons are more likely to be involved in the scattering process. To ensure that the process of neutron slowing down can be described quantum mechanically in an adequately large energy range, neutron scatterings with up to hundreds of phonons may be evaluated in the cross section calculation. In the epithermal region, without the possible contribution from the resonances, the neutron scattering cross section is approaching the limiting free-gas scattering cross section. Such behaviour can be understood as a suppression of the interference effect, when the neutron wavelength becomes much shorter than the atomic coupling distances. This intrinsic characteristic is also valuable when calibrating neutron cross sections from neutron transmission measurements. In modern Monte Carlo neutron transport codes, the transition energy between the thermal scattering model and the free-gas model is set at about 4 eV.
In the harmonic lattices, phonons are not interacting with the media and therefore have infinite lifetime; also, the interatomic forces are linear with the atom displacement distance, of which the distribution is a simple Gaussian. In contrast, the principle effect of anharmonicity is allowing phonon–phonon interaction and altering the Gaussian atomic displacement behaviour. In principle, the departure of Gaussian behaviour should be treated explicitly as the high order propagators of a many-body problem [24]. The parameters needed to describe the higher order anharmonicity can be captured by molecular dynamic simulations [25, 26]. However, such simulation is computationally demanding. Moreover, iterations of calculations are required to produce adequate data to cover a large temperature range. On the other hand, in the view that phonons evolve only with lattice volume expansion, and not interacting with the media, the QHA showed very good performance in modelling the thermodynamics of many crystalline materials up to the melting point [27, 28]. Typically, a linear relationship between the phonon energy deviation and the volume expansion is assumed, so that the iterations of simulations can be avoided. As the crystal thermodynamics and neutron scattering cross sections are closely related [29], it is of our particular interest to assess if the total cross sections calculated in the framework of QHA agree with data from transmission measurements.
In metals, electron states near the Fermi level can in principle alter the interatomic force constants significantly, and therefore also the VDOS; while in practice, such phenomenon is greatly suppressed by effective conduction electron screening [30]. In general, it is expected that the electron–phonon interaction has small impact to the VDOS at finite temperatures, except of course some special cases, e.g. [31].
The experimentally derived DOS from inelastic neutron scattering spectra is known as the GDOS (generalised VDOSs) [32, 33]. The difference between the GDOS and the actual VDOS are originated from the fact that neutron is not only sensitive to phonon by also to the neutron scattering length and atomic mass.
Transmission measurements have a superb simplicity to normalise the raw data into the absolute scale, and are feasible in a relatively weak neutron beam. The total inelastic scattering cross section is the integral of double differential cross sections over a well-defined boundary, within which all the phonon harmonic and anharmonic properties are contained. Unfortunately, it is challenging to study phonon characteristics directly from transmission cross sections. The main difficulty is that the contributors to the total cross section is a mixture of all neutron interaction processes. In addition, the cross section curve contains very few features. A prior work [34] shows a method that derives directly the VDOS using solely the transmission cross sections in some hydrides. The obtained VDOS agree with those measured from neutron inelastic spectrometers. However, the applications for such technique may be limited to materials that contain strong incoherent scatters. We tackle the usefulness of transmission cross sections of studying VDOS from a different prospective. Instead of deriving directly the VDOS from those data, we investigate the feasibility of studying the VDOS deviation by comparing the transmission cross sections at different sample conditions.
In section 2, we briefly introduce our method of calculating neutron cross sections. In section 3, we compare the calculated total cross sections from harmonic and quasi-harmonci models with experimental data complied in the EXFOR data library [35]. The sensitivity of the total cross section to phonon energy shift and energy broadening are discussed in the same section. In section 4, we discuss the validity of the incoherent approximation employed in our cross section calculations and study VDOS deviations from transmission cross sections at different temperature. This work is summarised in section 5. The detailed DTF calculation procedures are described in the appendix.
2. Method
2.1. Double differential cross sections
In this section, we briefly introduce the scattering theory. The assumptions made in the process of formula development for cross section calculation are emphasised. More detailed introduction to the theory can be found in [3, 23].
Given by Van Hove [1], the double differential scattering cross section can be expressed as
where b is the scattering length, ω is the phonon frequency,  is the momentum transfer, G is the so-called time-dependent pair-correlation function, which is the probability of finding an atom at position r at time t. I is the intermediate scattering function, which is the Fourier transform of
  in space.
  is the Fourier transform of
  in time. I can be expressed as

where d is the atom index, u is the instantaneous displacement.
Strictly speaking, the exponential factors in equation (2) do not commute, and the evaluation of equation (2) in anharmonic crystals was given by Maradudin and Fein [24]. In the limiting case where the crystal is harmonic, only the leading terms of the anharmonic expression need to be evaluated. In that case, equation (2) can be simplified as [24, 36],

In the special case that r = 0, equation (3) becomes the intermediate function for the incoherent scattering, Is, which describes the correlation of an atom with itself at different time. The Fourier transform of Is in time is strictly valid to represent the incoherent scattering of the atom in a general harmonic lattice, implying that the total incoherent scattering of a lattice can be decomposed into the independent contributions from individual atoms.
The Debye–Waller factor,  , is a measure of the vibrational effects to the elastic scattering cross sections. In harmonic crystals, where the displacements are small compared to atomic distances, it can be expressed as

where  is the phonon eigenvector, ns is the Bose–Einstein function, Md is the mass of the dth nucleus, j is the normal mode index, N is the number of unit cells.
In a cubic Bravais crystal (i.e. elemental cubic crystal), the square sum of the eigenvectors at any k-point in the Brillouin zone is unity. In that case, atomic displacement is isotropic, so equation (4) can be simplified as

where ρ is the VDOS, which is a probability density function, and can be expressed as

where  is the vibrational energy. For crystals in the ideal powder form, equation (5) is expected to be close to exact in a general lattice, because the isotropically randomised crystallite orientations largely remove the angular dependence effects.
Sjölander [3] showed that the self-intermediate scattering function in a harmonic cubic Bravais lattice can be expressed in a simple form as

where

Comparing equation (5) and equation (8), it is straight forward to obtain the Debye–Waller factor in an isotropic material as  , where
  is linear with
  , so with the mean-square displacement. It is possible to integrate the Fourier transform of equation (7) directly to obtain the total inelastic cross section [37]. The challenge is that the integrand of the equation is highly oscillating and the error is less straight-forward to estimate. Moreover, the information of the contribution from a specific number of phonon scattering is missed in this way, it is then disabled the possibility to study the contribution from multiple phonons scattering. We therefore are more in favour of evaluating this equation in the series of Taylor expansion [3, 38].In that method, the second factor in equation (7) is broken down into Taylor series as,

This technique is known as phonon expansion, where each term of n represents the contribution from the scattering process involving n phonons. It is also often labelled as the multiple phonon correction in the case of removing the multiple phonon scattering background from the raw data of neutron scattering measurements (e.g. in [39]).
The Fourier transform in time for each power of  is [3]

The partial incoherent scattering kernel  for each phonon term is then

The intermediate function of the coherent inelastic scattering is the case where both r and t are finite in equation (3). To ease the calculation, the incoherent approximation is employed in this work. In this approximation, the coherent inelastic scattering in a general lattice is treated as if it was the incoherent inelastic scatterings in a cubic Bravais lattice. In other words, the self-intermediate scattering function, equation (7), is chosen to represent the coherent scattering as well. The validity of this approximation is discussed separately in section 4.1. To apply this approximation in the total cross section calculation, b in equation (1) is substituted by  , where bi and bc are the bound incoherent and coherent scattering length, respectively.
The incoherent approximation is known to be unsuitable for the elastic coherent scattering (i.e. the Bragg diffraction), because this type of scattering depends highly on the crystal structure. In high quality single crystals, the Bragg diffraction is neglectable in the total cross section, since the diffraction condition is approaching a Dirac delta function, to which very few neutrons can fulfil. On the other hand, the materials used in the nuclear industry and many other places are often in their powder or polycrystal forms, where, ideally, the crystallites are isotropically distributed, so the Dirac delta function is significantly broadened. As a result, each symmetry-equivalent reflection families introduces a stepping rise, which is known as the Bragg edge, at the neutron wavelength that is twice of the corresponding atomic plane spacings. Unfortunately, because of the lack of handling crystal symmetries in our numerical implementation, the cross section of elastic coherent scattering is not included in our calculated total cross sections. However, this component is very distinctive and can be easily identified when comparing our calculated cross sections with those from transmission measurements.
2.2. Integrating the double differential cross sections
To simplify the evaluation of total cross section, we define the momentum and energy transfers in the dimensionless form, as shown in equation (12).

The total inelastic scattering cross section is the integral of the double differential cross section (i.e. equation (1)) over the boundary that defined by equation (13). It can be seen that the integration boundary is only defined by  , where the factor of temperature is introduced by the variable change from
  to
to  for which the Jacobian is kbT. Within this boundary, the scattered angle cosine μ is in the range
 ![$[-1,1]$](https://content.cld.iop.org/journals/1367-2630/19/10/103027/revision2/njpaa8ed4ieqn17.gif) , and the scattered energy
, and the scattered energy  is non-negative.

The energy transfer distribution function P is the integral over α

where Sn is non-symmetric and obeys the detailed balance, and has the analytic property of  . In this work, this integral is considered to be converged when the nth term contributes less than 0.01% to the sum of the lower terms For the calculations performed on the materials that studied in this work, this integral is well converged below 50 orders, because the neutron energies of interest are relatively small and the atoms are heavy. Equation (14) also indicates that the temperature dependency of the cross section is linear in first approximation. The total inelastic scattering cross section
  at incident energy E is

The scattering lengths, bi and bc, used in this work are taken from the table compiled in [40].
In the epithermal energy region,  approaches the limiting free incoherent scattering cross section
  , where ai is the free incoherent scattering length [41].
For the incoherent elastic scattering, indicated by equation (10) and (11), the scattering function has a simple form as

The Dirac delta function here emphasises zero energy transfer in this process. Integrating equation (16) over 4π and scaling by the incoherent cross section, we obtain the total cross section.

where  , it is the so-called B factor in crystallography.
2.3. The QHA
The dependence of phonon energy on the unit cell volume is traditionally described by the Grüneisen parameter defined in equation (18).

At a fixed pressure, the Grüneisen parameter of a phonon is often regarded as a constant, so that the deviation of phonon energy is linear with the deviation of the volume. Therefore, we can obtain the phonon energy as

where Vo and VT are the reference volume and the volume at a finite temperature T, respectively.
Generally, two methods can be used to obtain the VDOS defined in equation (6). For applications that are interested in high energy resolution, the tetrahedron method [42] is often employed. For a crystal at high temperatures (or even at room temperature), the sub-meV structures in the VDOS may not be observed, because as a type of quasi-particle, the phonon energy is broadened by the presence of different isotopes, phonon–phonon and electron–phonon scatterings. As a practical and simpler solution, the delta function in equation (6) is often replaced by a Gaussian. However, in this way, artificial contribution can be introduced to the part of VDOS where energy is approaching zero. It can be observed in equation (10) that the H1 function is extremely divergent in that region. Therefore, the width of the Gaussian kernel need to be tuned carefully to be small enough to avoid large artifact at low energies; while large enough to ensure no artificial structures can be produced at higher energies. In this work, the delta function is implemented in the same form as a classical damped oscillator [43]. The analytic property of such broadening function is naturally in consistent with the requirement in this work: the VDOS is vanishing when energy is approaching zero. Therefore, we can write the temperature dependent VDOS as

where  is the full-width-half-maximum of the broadening, and it is set to 0.5 meV for all the phonons. We justify this simple treatment of the broadening in section 3.4.
3. Result
3.1. Phonon softening
Detailed DFT calculation procedures of phonon mode Grüneisen parameters and crystal thermal expansion in the framework of QHA are presented in the appendix. Using the calculated results of Al, we compare the softening of four phonons with the experimental data from [44] in figure 1. The calculated phonon energies differs from measured energies by less than 5% in all cases, except when temperature is very close to melting point (i.e. 12% for the k-point  at 933.5 K).

Figure 1. Comparisons of the calculated softening of four phonons of Al in the [3, 1, 0] direction and the experimental data [44].
Download figure:
Standard image High-resolution imageFigure 2 shows the calculated dispersion curves of Al at 80 and 300 K using equation (19). Our QHA calculation predicts that the volume of Al unit cell expanded about 0.0769% at 80 K and 1.35% at 300 K. As the mode Grüneisen parameters of Al are roughly 2 (see figure A2(a) in the appendix), the solid curve of 80 K is expected to be hardly distinguishable from the dispersion curve predicted by the harmonic approximation; the phonons at 300 K are expected to be softened by roughly 3%, which is observable in the regions near the peaks of the curves. The calculated curves closely follow the structure of the data, e.g. the relatively small slopes of the blue curves for one of the transverse phonon branches in the regions that between K and X and that close to L. The absolute differences between the measured and calculated phonon energies are probably close to the error introduced in the process of extracting the data points. As the dispersion curve at 300 K is clearly distinguishable from that at low temperature, we expect QHA to be effective already at this temperature for the inelastic scattering in Al.
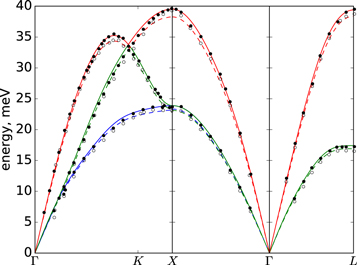
Figure 2. Measured [45] and calculated phonon dispersion relations in Al at 80 K (closed circles and full lines, respectively) and 300 K (open circles and broken lines, respectively).
Download figure:
Standard image High-resolution image3.2. Total neutron cross section
In this section, we benchmark our calculated total cross sections against the data compiled in EXFOR [35].
The predicted and measured cross sections of Al are compared in figure 3. The sudden rise of the measured cross sections at about 5 meV is due to the coherent elastic scattering in the powder sample used in the measurement. Such stepping behaviour can not be observed in the 298 K data from Grabcev, which is measured on a piece of high quality single crystal sample. It is notable that the coherent elastic and inelastic scatterings are two competing processes (see e.g. [16]). When the coherent elastic scattering becomes valid above its energy threshold, a moderate deviation on the VDOS may change the contribution ratio of the processes, but have a minor impact to the total cross sections. In Al, the capture cross section is the dominant process at low temperatures and low incident energies. It contributes over 97% to the total cross sections when the incident energy is 1 meV at 100 K. The predicted cross sections at 100 K systematically underestimate the measurement by about 0.06 b. Such discrepancies may be due to large capture cross section impurities in the sample. It can be observed that the measured points are all situated slightly above the curve predicted by the QHA model at higher temperatures.

Figure 3. Temperature dependent total cross sections of Al. Data shown are Grabcev 1979 (EXFOR 30528002) and Palevsky 1955 (EXFOR 11782004).
Download figure:
Standard image High-resolution imageThe comparisons on Mg are shown in figure 4. All the energies in the measurement are below the coherent elastic scattering threshold at about 2.66 meV, which is defined by the  atomic planes, so the Bragg edge can not be observed in the measured data. Similar to the case of Al, good agreement is observed at all temperatures, most of the measured points intersect with the predicted curves of the QHA model. The static model curves are systematically lower than the QHA curves in all cases, and the underestimation increases with temperature, indicating the phonon softening contributes positively to the cross sections. It can be understood as that with the softening of the VDOS,
  expressed in equation (8) is increased, and subsequently leads to the increase of S. As the integration boundary on S for the total cross section is unchanged, the final cross section is increased. At 781 K, the total cross sections are underestimated by about 7% around 1 meV.
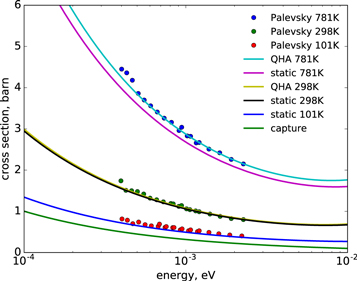
Figure 4. Temperature dependent total cross sections of Mg. Data shown are Palevsky 1955 (EXFOR 11782003).
Download figure:
Standard image High-resolution imageAs beryllium lattice is less sensitive to temperature, we observe that the differences between the static and QHA models are only distinguishable above 700 K. Figure 5 shows the comparisons between the predictions of the QHA model and the measured data at 100 and 300 K along with the weak capture cross section. At 300 K, the predicted curve is compared with data taken from two independent measurements. About 10% overestimation in the prediction can be observed below 1 meV. The cross sections at high temperatures are compared in figure 6. Similar overestimations are observed in Palevsky's data at 440 K. Predictions from both of the QHA and static models slightly underestimated the measured data from Kanda at higher temperatures, but most of the predictions are within the experimental uncertainties.

Figure 5. Temperature dependent total cross sections of Be at low temperatures. Data shown are from Kanda 1980 (EXFOR 21657002) and Palevsky 1952 (EXFOR 11204003 and 11204005).
Download figure:
Standard image High-resolution image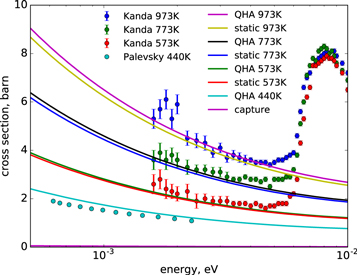
Figure 6. Temperature dependent total cross sections of Be at high temperatures. Data shown are from Kanda 1980 (EXFOR 21657003–21657005) and Palevsky 1952 (EXFOR 11204004).
Download figure:
Standard image High-resolution imageWe emphasise that the small discrepancies between the calculated and measured cross sections observed in this section may be already close to, if not small than, the uncertainty introduced by the incoherent approximation. Nevertheless, it is clear that the QHA model can effectively capture the additional growth of the cross section introduced by phonon softening, at least in the crystals studied in this work. We discuss the validity of this approximation in section 4.1.
3.3. Contribution from phonon softening
The increase of calculated cross sections due to phonon softening can readily be seen in the results presented in section 3.2. Because of the insignificant incoherent elastic contribution, those increases are almost entirely contributed by the inelastic scattering process, which is the principle process of neutron slowing down. In this section, we quantitatively study the contribution originated from phonon softening.
Figure 7 shows the quasi-harmonic contribution to the integral inelastic scattering cross section as a function of temperature and incident energy. Such contribution is defined as the ratio between the increased cross section, when applying the QHA in the place of the static model, and the cross section from QHA. The upper limit of the temperature in the figures is about 90%–95% of the temperature of the corresponding material melting point. Overall, the contribution to the cross section of Be is relatively weak. It can be observed from the colour bar, the maximum value in the figure is less than 7.5%. On the other hand, Al is very sensitive to temperature, the maximum discrepancy is about 19% at 900 K, and 7% at room temperature.
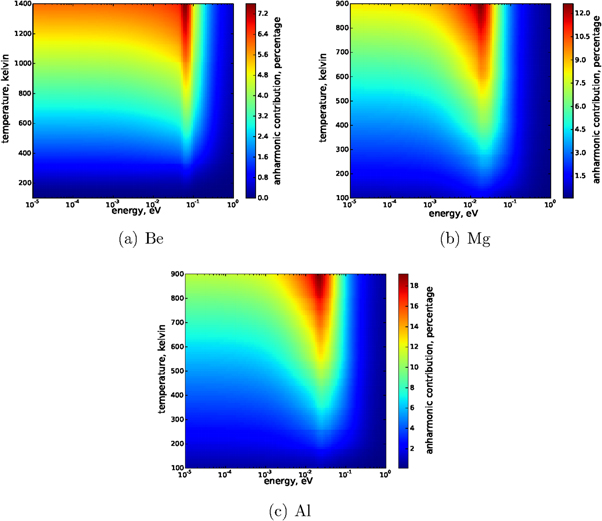
Figure 7. Quasi-harmonic contribution to the total inelastic cross sections in Be, Mg, and Al.
Download figure:
Standard image High-resolution imageAs expected, the global maximum for each material is observed at the highest temperature calculated. However, the energy location of the global maximum is material dependent, which indicates the dependency to the energy range of the phonon distribution. Observed from the figures, the locations are at about 0.06 eV, 0.016 eV and 0.02 eV in Be, Mg, and Al, respectively. At low neutron energies, in the  region, the quasi-harmonic contribution grows with temperature, but is insensitive to the incident energy. Above a few meV, the contribution also shows a strong dependency on the incident energy, likely due to the shift of the global minimum of the total cross section (see e.g. cross section curves at 800 K in figure 3). In the region close to eV, the predictions from both of the harmonic and quasi-harmonic models should approache the limiting free scattering cross section, regardless of temperature. Consistently, it can be observed in figure 7 that the quasi-harmonic contribution is diminishing at incident energies close to 1 eV.
3.4. Sensitivity to phonon finite lifetime
In this section, we assess the simple treatment of using a fixed global phonon linewidth in equation (20). Showed by Tang et al [46] in Al, accounting for the finite lifetime due to the three-phonon scattering process, the broadened quasi-harmonic VDOS agrees well with the VDOS that is derived from inelastic neutron scattering measurements at 750 K. For this particular metal, this finding can be interpreted as, firstly, the difference between the bare-phonon energy and the renormalized phonon energy is small in comparison with the energy shift due to volume expansion; secondly, the dominant contributor for phonon lifetime is the process of three-phonon scattering. Therefore, for the purpose of assessing our simple treatment for the linewidth, we study the effects of including the dominant contributor of the phonon linewidth in equation (20) in Al.
The calculated phonon linewidths at 300 and 800 K are shown in figure 8. At 300 K, phonons are highly concentrated around 35 meV, where the mean line width is about 1.45 meV. Such observation is in excellent agreement with the calculated results given in [46]. At both temperatures, the energetic longitudinal phonons have much broader linewidth than in the other two phonon branches. Phonon linewidths at 800 K are about twice of the those at 300 K, and the overall structures are broadly similar.

Figure 8. Phonon line width of Al, on the left at 300 K, on the right at 800 K. Transverse acoustic phonons are in blue and green. The longitudinal phonons are in red.
Download figure:
Standard image High-resolution imageWe found that when including the three-phonon scattering process in equation (20), the atomic mean-square displacement is reduced by a few percent at high temperatures. The calculated B factors from different models are compared with experimental data [47] in figure 9. As expected, the results from the harmonic model show linear relationship with temperature. The other two models show additional higher order T behaviour. However, none of them increase as fast as the experimental results with temperature. The results based on the broadened VDOS are systematically lower than that from the QHA model. As for the total cross sections, the results based on the broaden VDOS systematically underestimate the results from the QHA model. However, the maximum discrepancy we observed at 800 K is about 1% in the energy range between 10−5 and 1 eV.

Figure 9. Comparisons between calculated and measured [47] B factor of Al.
Download figure:
Standard image High-resolution imageBased on the findings in this section, we conclude that our total cross section model is insensitive to phonon linewidth.
4. Discussion
4.1. The validity of incoherent approximation in neutron transport problems
One of the major sources of the uncertainty in our model is the incoherent approximation, in which the inelastic scatterings are treated as purely incoherent. So the angular distribution does not contain any structure peaks. For neutron transport problems in an infinite scattering media, it is arguable if the interference effects are important at all. After a number of scatterings, the sharp peaks in the angular distributions arising from the single phonon scattering smear out. Therefore, we expect that the angular distribution modelled in the incoherent approximation is realistic when the material size is at least a few times of the inelastic mean free path.
However, the absolute error of the incoherent approximation in total cross section calculation is lattice dependent and not well understood. The main uncertainty is most likely introduced by the treatment to the single phonon scattering, which is the dominant inelastic process at low energies. For example, figure 10 shows the contribution of the single phonon scattering to the total inelastic cross section in Al. The single phonon scattering contribution is significant in the low energy region, where the flat plateaus are formed due to the  behaviour of the inelastic processes. Its contribution gradually decreases with the increased temperature, from about 98% at 100 K to about 73% at 800 K. Also the decay of the plateaus starts from a lower energy at increased temperature, from at a few tens of meV at 100 K to at a few meV at 800 K. This figure clearly shows the promotion of multiple phonon scatterings as a result of increased phonon population at higher temperatures. More importantly, it can be observed that the contribution from the single phonon scattering is significant in the energy region of interest in this work.
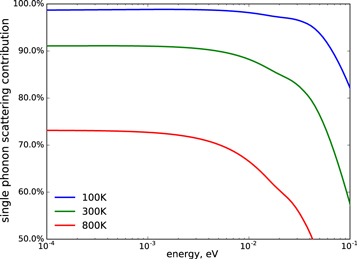
Figure 10. Contribution of the single phonon scattering to the total inelastic cross section of Al under the harmonic incoherent approximation at different temperatures.
Download figure:
Standard image High-resolution imageSuggested in [48, p 314], when applying the incoherent approximation to the energy differential single phonon scattering cross sections, the error rarely exceeds 20% if the integral domain of the solid angle is sufficiently large. We believe the net effect to the total cross section is effectively reduced in the process of integrating the differential cross section. Indicated by the good performance of the incoherent approximation shown in section 3.2, we expect the error introduced by this approximation is only a few percent for the materials studied in this work.
However, significant errors introduced by incoherent approximations have been reported previously in Be [49] and graphite [50] near room temperature, where the anharmonic effects are insignificant. Both [49, 50] calculate the coherent single phonon scattering explicitly, and employ incoherent approximation for the higher order scatterings. We shall refer their model as the quasi-coherent approximation.
For the graphite case, it has been reported that the calculated total cross sections using the incoherent approximation are only about 50% of those from measurement below the threshold energy of coherent elastic scattering [50]. Indicated by Bowman et al in a recent study [51], the measured data in [50] may be based on reactor grade graphite samples, of which the density could be lower than 80% of the density of ideal pyrolytic graphite due to the high porosity concentration. It has been shown in [51] that the measured total cross sections from high quality graphite closely agree with those predicted by incoherent approximation. Very recently, Hawari and Gillete [52] showed that using the VDOS calculated by molecular dynamics techniques, even the cross section of reactor grade graphite can be accurately calculated in the incoherent approximation.
Borgonovi and Sprevak [49] reported that the incoherent approximation can overestimate the cross section of Be by up to 20%. We compared the cross sections predicted in this work with the experimental data and the predictions by Borgonovi and Sprevak in figure 11. The quasi-coherent approximation curve from [49] overlay with experimental points. However, the incoherent approximation cross section curve (in red) from [49] shows less good agreement with the measured cross section than the curve (in green) calculated in this work. Indicated by figure 7 in [53], the phonon dispersion curve predicted by the lattice dynamics model used in [49] underestimates the measured data typically by 10%–20%, which can explain the overestimation observed in the red curve. So the good performance given by Borgonovi and Sprevak's quasi-coherent approximation is likely the result of the error in their numerical implementation cancelles out the error in the lattice dynamics model.

Figure 11. Comparisons of the total cross sections of Be from measurements, this work and the work described in [49].
Download figure:
Standard image High-resolution imageBoth of the works [49, 50] likely suffer from the error introduced by the numerical implementations. Nevertheless, the model they proposed is certainly more physically sound than the incoherent approximation, as the single phonon scattering can be treated much more realistically. Facilitated by modern ab initio methods and improved numerical techniques (e.g. the tetrahedron method), overcoming the technical hurdles for such advanced model and beyond should be feasible.
4.2. Recovering VDOS from neutron transmission cross sections
From the results presented in section 3.2 we can see that the increase of total scattering cross sections in the materials studied in this work are closely correlated to temperature as well as to the softening of phonon energy. Under these circumstances, studying neutron transmission cross sections of a crystal at different sample environments may provide a useful insight to the deviation of VDOSs of the material. As an example, we recover the VDOS of Al at 800 K from experimental transmission cross sections of Al powder at 100 and 800 K shown in figure 3.
We formulate the recovering model into a simple optimisation problem, assuming the cross sections at 100 K can be correctly calculated by using the harmonic VDOS. The VDOS deviation at 800 K can be described by the modification of the harmonic VDOS, of which the energy axis is scaled by a scalar value X1 , which is a parameter to characterise phonon softening in the place of mode Grüneisen parameters and volume expansion (see equation (19)), as a measure of the thermal dependency of the cross section. Finally, the discrepancies between calculated and measured cross sections are insensitive to neutron energy and temperature, so they can be described by a second scalar value X2. The quantity that we are trying to minimise is the sum of the mean squared errors between the measured cross sections and the corresponding calculated results at 100 and 800 K. Experimental cross section above  are removed in the calculation to eliminate coherent elastic scattering contributions. The higher order anharmonicity and experimental background may be oversimplified in our parameterisation, but this optimisation problem is primarily formulated to capture the softening of VDOS. We believe it can serve our purpose of demonstration.
We use the particle swarm optimisation [55] to find the best solution. The error is minimised when the softening parameter X1 equals 0.862 and the constant cross section error X2 equals 0.0508 b. The recovered VDOS is compared with the VDOS from our direct DFT calculations and that from a measurement at 775 K [54] in figure 12. The phonon softening effects can be observed in all the measured and calculated VDOS. The recovered VDOS shows good agreements with the VDOS obtained from the direct DFT QHA calculation, because our recovering model is quite quasi-harmonic. For instance, the finite lifetime of the phonon is not considered, and the anharmonic contribution to the Debye–Waller factor is also disregarded. Our recovered and the calculated QHA VDOS both overestimate the softening of the peak of the longitudinal phonons, of which the centre is at about 36meV in the harmonic VDOS. Such overestimation is expected. An excellent discussion regarding the QHA behaviour at high temperature can be found in [56].

Figure 12. Comparisons between the recovered the VDOS (PSO 800 K) of Al from transmission cross sections at 100 and 800 K and the calculated and measured VDOS. The 'Kresch 775K BvK' curve is extracted from [54].
Download figure:
Standard image High-resolution imageVDOS is very important for modelling thermal neutron transport and material thermodynamics. The direct measurement of VDOS by neutron scattering techniques can provide an initial VDOS before the VDOS deviation; while the VDOS deviation obtained from analysing transmission cross sections can be used to correct the background in the incoherent approximation. So these two methods are complementary. In principle, it is possible to measure the double differential cross sections and the total cross sections can be measured in one measurement. After all, enabling transmission measurement in an existing TOF neutron instrument amounts to introducing some relatively trivial add-on detectors in front of the instrument beamstop.
5. Conclusion
Due to the lack of taking the temperature induced VDOS deviation into account, the widely used harmonic inelastic cross section model is expected to contain large error at high temperatures. We found that such error may not be neglected in Mg and Al even at room temperature. We showed that within the framework of QHA, the calculated total neutron cross sections in Be, Mg and Al agree closely with measured transmission cross sections in a wide temperature range below the melting point. To reduce the uncertainty of neutron transport simulation, it seems important for the Monte Carlo codes to include a quasi-harmonic thermal scattering model.
The deviation of VDOS may originate from the change of temperature, pressure, defect, or any combination of them. We showed that it is feasible to study the deviation of the VDOSs from the material transmission cross sections at different temperatures. Further validation work is required to apply this method to general lattices and other mechanisms that cause deviations.
: Appendix. Ab initio calculations
The PWSCF code in the Quantum ESPRESSO suite (QE) [57] is used to perform DFT calculations in order to obtain the acting force on atoms and the total electron energy in a given lattice. Pseudopotentials used in calculations are taken from the 'efficiency' category of the standard solid state pseudopotentials (SSSP) version 0.7 [58]. The recommended kinetic energies cut-off by the SSSP are used in this work. The cut-off energies for the wavefunctions in Be, Mg and Al are 40, 35 and 30 Ry, respectively. The cut-off energy for the charge density and potential of each element is 8 times of that for the corresponding wavefunctions.
For the QHA, phonopy [59] is used to prepare displaced super cell lattices for the DTF calculations and estimate the force constants from the calculated results. Such calculation method is called the small displacement method [60]. The mode Grüneisen parameters and unit cell volume-temperature function are generated using two post-processing scripts in phononpy. The mode Grüneisen parameters are calculated using the gruneisen script, and the volume-temperature functions are calculated using the phonopy-qha script [61]. We first relax the unit cell in the PWSCF. To be consistent with the experimental cross sections, we apply zero pressure to the cell. Using the relaxed atomic fractional positions, we scale the relaxed volume by factors between 0.9 and 1.1 to generate a total of 11 unit cells. The DFT calculation on each cell is carried out using QE, and the force constants are produced by phonopy. The equilibrium volume V at temperature T, is found when of the Gibbs free energy,  , is the minimum. In phononpy, G is defined as

where the first term is the electronic free energy, the second term is the Helmholtz free energy, and the third term is the energy originating from the pressure. Supplying the electron total energy and the force constants of the cells to the phonopy-qha script, 11  points at each specified T are obtained as a function of volume. Internally, phonopy-qha fits the calculated points with the equation of state proposed by Vinet et al [62] to obtain the minimum of
  , thereby finding the equilibrium volume. In this work, we obtain the equilibrium volume at each natural integer kelvin up to the temperature that is about 95% of melting point. The final volume-temperature points are reduced so that results can be linearly interpolated with 0.1% tolerance.
The gruneisen script estimates the Grüneisen parameters as equation (22) using finite difference method.

where D is the dynamical matrix. The input for this script are the force constants of the relaxed cell, of a cell that slightly larger than that, and of a cell that slightly smaller than that.
Figure A1 shows the volume-temperature functions of Be, Mg and Al calculated by the procedures described above. The predicted function for Be agrees remarkably well with experimental data compiled in the American mineralogist crystal structure database [63]. The discrepancies between the calculated and measured volumes are less than 0.3% in all cases. For the cases in Mg and Al, the differences are larger, but the largest discrepancy that we observe is only around 2.3%. Generally, the structure parameters calculated by DFT can vary a few percent using different functionals. The Perdew–Burke–Ernzerhof (PBE) functionals [65] tend to give greater parameters than other functionals in both harmonic approximation [66] and QHA [67] calculations. As the SSSP library is essentially a collection of PBE, the observed overestimations are not surprising. The quasi-harmonic energy correction (i.e. equation (19)) depends primarily on  , i.e. the shape of the curve, rather than the absolute value. We expect that the error originated from the volume-temperature functions can be neglected.

Figure A 1. Calculated volume-temperature function. Results are compared with data in the AMCSD [63] and in [64]. (a) Be, 4 × 4 × 3 supercell size, 96 atoms, 8 × 8 × 6 k-point mesh. (b) Mg, 4 × 4 × 3 supercell size, 96 atoms, 6 × 6 × 4 k-point mesh. (c) Al, 3 × 3 × 3 supercell size, 108 atoms, 8 × 8 × 8 k-point mesh.
Download figure:
Standard image High-resolution imageIt is worth noting that a prior study [68] on the thermodynamic properties of Be showed a significant difference between the volume expansion coefficients measured by Gordon [69] and those predicted by the QHA method. The reason is that the authors misinterpreted the unit for temperature in the Gorden's original paper as kelvin, instead of the correct unit degree Celsius. When comparisons are made with the corrected temperature axis, good agreement is observed.
Figure A2 shows the mode Grüneisen parameters of the irreducible vibrational modes in the crystals subjected to this study. The Grüneisen parameters of Be are relatively small, and that of the most energetic phonons are around 1.4. As the volume expansion of Be is also relatively insensitive to temperature, the phonon energy shift in Be is expected to be relatively small. Al seems to be very sensitive to temperature. The lowest Grüneisen parameter observed is about 1.6. The mode Grüneisen parameters of Mg sensitivity to volume expansion is between that of Be and Al. Note that, in our calculation, the phonons that are very close to the Gamma point show unrealistic large or small Grüneisen parameters (up to ±20), and are located remotely from the main body as shown in figure A2. It is well known that the acoustic phonon energy is close zero when the corresponding k point is approaching the Gamma point. Likely, when using the finite difference method to evaluate equation (22), the tiny numerical error in phonon energy can produce such divergent results near the Gamma point. In our work, the observed artifacts are corrected to be zero. So the corresponding modes are not sensitive to volume expansion at all.

Figure A 2. Calculated Grüneisen parameters of the irreducible vibrational modes by the gruneisen script in Phonopy. Colour indicates different phonon branch. (a) Be, 80 × 80 × 60 mesh. (b) Mg, 80 × 80 × 60 mesh. (c) Al, 80 × 80 × 60 mesh.
Download figure:
Standard image High-resolution image
ShengBTE [70] is used to calculate the phonon lifetime contribution from the three-phonon scattering process. The third order force constants are calculated using the bundled thirdorder_espresso.py script, which is based on the small displacement method. In our calculation, up to four nearest neighbours are considered in a supercell that consists of 5 × 5 × 5 Al primitive unit cells. The corresponding cut-off distance is 6.049 Å. In total, 116 displaced lattices are calculated by PWSCF. In principle, the third-order force constants in each volume of interest need to be calculated explicitly. Tang [46] suggested that the phonon lifetimes at 600 K are typically altered less than 1% in Al, if the calculation is based on the relaxed volume instead of the expanded volume at the actual temperature. As such calculation is very computationally demanding, we only perform the calculation on the relaxed volume for the lattice at all the temperatures of interest in this study. ShengBTE treats the delta functions that define phonon energy conservation in the scattering process by Gaussian functions [70]. The corresponding scalebroad parameter in the input of calculation is set to 0.1 in this work, so that the calculations are well converged and have relatively small memory footprint. Discussion on the usefulness of this parameter can be found in [70].