

Abstract
When standard voltage levels commonly adopted in industry are used to activate thermal shape memory alloy (SMA) wire actuators, they often result in very high electrical currents which may eventually damage or destroy the actuators. To improve performance of SMA wire actuators operating in industrial environments, in this paper we investigate a novel, fast and energy-efficient actuation strategy based on short pulses in the millisecond range. The use of higher voltages leads to a highly dynamic activation process, in contrast to commonly used quasi-static activation based on low-voltage. A test setup is designed to examine the effects of the control parameters (i.e., supply voltage, activation pulse duration, SMA wire pre-tension and wire diameter) on the measured displacement and force output of the SMA wire. It is shown that actuation times in the range of 20 ms and strokes of more than 10% of the SMA wire length can be reached. Additionally, energy savings of up to 80% with respect to conventional quasi-static actuation are achieved. Possible applications for this activation method are release mechanisms, switches or safety applications.
Export citation and abstract BibTeX RIS
1. Introduction
Shape memory alloys (SMAs) are known for their high energy density which allows for the construction of compact and light-weight actuator systems [1–7]. NiTi-based wires represent a common SMA component used to develop actuator systems. When heated to their specific transformation temperature, these wires can contract due to a phase transformation from martensite to austenite. To generate a stroke, an SMA wire has to be stretched in its martensitic state prior to the activation, e.g., with a pre-tensioned spring. Typical transformation temperatures for commercially available SMA wires range from 70 °C to 90 °C [8, 9]. In most applications, an SMA wire is controlled by supplying an electrical current, which results into a Joule heating that increases the wire temperature. SMA wire manufacturers list specific activation currents for each wire diameter in their data sheets [8, 9]. These current values lead to voltages in the order of 1–10 V and may be continuously applied without overheating the wire. The use of those control values, however, commonly results into a slow activation of the SMA wire (order of seconds), which potentially limits the applicability of the technology [10–13]. It is remarked how the electrical resistance, and consequently the desired supplied voltage and power, depend on the geometry of the SMA actuator, i.e., wire diameter and length, as well as phase composition and temperature [14, 15]. All of those quantities change during actuation, therefore the supplied current is non-constant for a constant applied voltage. This implies a need for application-specific power electronics to ensure correct current values for SMA activation, which may severely complicate the overall system design. In addition, many researchers investigated different driving strategies such as pulse width modulated controllers, or PI and PID controllers for position control via resistance feedback [16–24].
This paper presents a study of a different activation approach for SMA wire actuators. The total electrical energy that is needed to heat up the wire to transformation temperature can be controlled not only by voltage level but also by the length of the activation pulse. So instead of using power electronics to transform the given supply voltage to a desired level, the duration of the activation pulse is adjusted. That way, the activation of the SMA wire takes place at a high electrical power for a short time interval. First studies on SMA pulse activation were conducted by Vollach, Shilo and coworkers [25–28]. In their investigation, kilovolt pulses of the duration of microseconds were used to activate SMA material, while acquiring at the same time frequency response, displacement and SMA force. However, the presented studies were conducted mainly with a material science perspective, since the focus of the work was the kinetic of the Nickel-Titatium phase transformation. In addition, the adopted voltage of the order of kV is difficult to be reproduced in real-life applications, e.g., industrial ones. It is pointed out how the use of such a control strategy is still relatively unexplored for application-oriented SMA devices which operate in industrial environments, and thus subject to constraints in terms of maximum voltage levels.
The goal of the study presented in this paper is the exploration of potential application scenarios for pulse-controlled SMA, compatibly with voltage levels commonly used in industrial environments. Typical supply voltages used in real-life applications range from 12 to 48 V in the automotive sector, 24 V for industrial bus systems, and up to 110–125 V in aerospace industry. These values are significantly higher than the ones commonly used to drive SMA wires (on the order of 1–10 V), and therefore they lead to higher currents than recommended by data sheets. At the same time, these values are significantly lower than the ones investigated in previous studies on pulse driving (on the order of kV). In this paper, it is shown that it is possible to use these given supply voltages to generate pulse activation in the millisecond range, achieving fast and energy-efficient SMA actuation with a compact and light-weight power electronics solutions.
In conventional quasi-static operation, one typically focuses on stroke as a direct consequence of the low-voltage activation. On the other hand, the high-voltage activation of SMA wires, and the related phase transformation in the material, result in an instantaneous generation of force which leads to a highly dynamic stroke as a consequence of accelerations and velocities. In addition to simplified power electronics and faster actuation time, a further advantage of pulse actuation is energy-efficiency. In current state-of-the-art actuators, the SMA wire activation takes place under non-adiabatic conditions, i.e., a large amount of the heating energy is lost due to heat exchange with the environment during the activation process. With high electrical power and a fast heating pulse, it is possible to reach the transformation temperature and start actuation before heat is lost to the environment, thus leading to an adiabatic activation. A first preliminary study on this topic has been presented in conference paper [29]. This paper extends the previous work by including:
- Detailed description of the experimental setup and the test procedure
- Comparison between conventional and high-speed activation
- Sequential high-speed optical camera recordings to illustrate 'ballistic' behavior
- Systematic experiments to investigate tendencies in SMA behavior with focus on typical industrial standard voltage supply:
- Variation of supply voltage
- Variation of counterforce
- Variation of SMA wire diameter
- Variation of activation pulse length
- Theoretical energy analysis
- Experimental investigation of energy-efficiency in relation to the supply voltage for different SMA wire diameters.
The remainder of the paper is structured as follows. Section 2 focuses on the description of the experimental setup, as well as the test procedure. Section 3 presents the experimental results, first introducing the effects of high-speed activation. Afterwards, the systematic measurement results are introduced and discussed, and an energetic analysis is performed. Section 4 provides concluding remarks and future directions of the ongoing research.
2. Experimental setup
The block diagram of the experimental setup is shown in figure 1 (upper part). A power supply is used to heat the SMA wire with an electric pulse. A laser displacement sensor, model Keyence LK-G87, measures the SMA wire stroke. The time derivatives of the displacement signal, i.e., velocity and acceleration, are calculated and plotted in post-processing. SMA force is recorded by a load cell of the type Futek LSB200. The voltage on the SMA wire is measured via 4-wires sensing, while electrical current measurement is realized via a current clamp. Additionally, the whole experiment is recorded with an optical high-speed camera system Olympus i-SPEED TR for a better interpretation of the measurement results. Signal processing and data acquisition during the experiment are realized via an NI CompactRIO system. The mechanical structure of the setup, including the positioning of the key components, is shown in figure 1 (lower part, [29]). The SMA wire is guided vertically and clamped at top and bottom. The specifically designed clamps combine mechanical and electrical connection, by connecting the SMA wire directly to a small PCB part. The upper clamp is attached to the load cell which is connected to the aluminum frame structure. The bottom clamp is directly connected to the air bearing shaft. The total weight of the clamp including shaft is 22.5 g. A compression spring can be placed between the bottom clamp and a micro-adjustment stage, allowing to vary the SMA wire pre-tension. In applications, the use of springs as a bias mechanism for the SMA wire is a common design solution [30]. Additionally, the spring is used to adjust bias forces to bigger SMA wire diameters. The air bearing guides the vertical motion with minimal friction. The laser displacement sensor detects the motion of the air bearing shaft. The SMA wire length in its austenitic state in this setup is 225 mm.
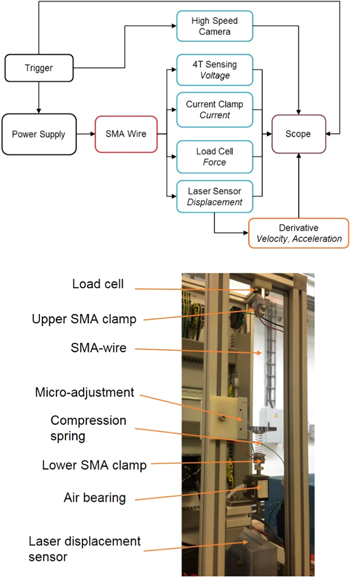
Figure 1. Block diagram (upper part) and mechanical structure (lower part) of the experimental setup.
Download figure:
Standard image High-resolution image2.1. Test procedure
The SMA wire used in these experiments is a SAES Getters SmartFlex actuator wire with a transition temperature As = 90 °C [8]. The SMA wire length is measured in its austenitic state, in order to guarantee reproducibility. At low temperature (martensitic) state, the SMA wire shows a two-way effect. This means that, after cooling down, the SMA wire shows a non-defined elongation, even without external loads [2, 7]. This elongation is not uniquely defined, and may vary from sample to sample. To ensure that the SMA wire length is always measured in the same crystallographic state, a separate measuring setup is performed. In this setup, the SMA wire is heated in a nearly load-free configuration to reach complete phase transformation to austenite. The desired length is measured and marked in this high temperature state. The wire is then cut at the markers and clamped in the experimental setup. The micro-adjustment stage, in combination with the compression spring and the load cell, allows the generation of a desired pre-stress and pre-strain in the SMA wire. The experiment is then started via LabView.
SMA wires show a training effect after early activation cycles. This effect is visible in a change of its remnant strain after cooling down and returning to its initial state. A new SMA wire in the test setup needs a few training cycles until the remnant strain stays constant. Therefore, the force signals and the displacement signals are compared to the initial values after each experiment. The measurements are started, once the force and displacement stays at constant values after few activations. During the measurements, mechanical stress in the SMA wire can reach critical levels which may lead to plastic deformations and eventually damage the wire. This aspect can be monitored by the force and displacement values after each experiment. In case critical stress is overcame, the SMA wire has to be exchanged.
3. Experimental results
Typical activation of a conventional SMA wire is displayed in figure 2. An SMA wire with a diameter of 76 μm is activated according to the manufacturer's data sheet suggestion, i.e., a supply voltage of 8 V. The resulting electrical current is of approximately 150 mA for 1 s. The initial force is set to 0.28 N, which results to a mechanical stress of 60 MPa in the SMA wire. The bias spring has an elastic constant of 0.056 N mm−1. The graph shows the trigger signal (brown), electrical current (black, [A]), force (purple, [N]), displacement (green, [mm]), velocity (yellow, [10−1 m s−1]) and acceleration (cyan, [m s–2]) signals. After 1 s, a maximum displacement of 8.33 mm is reached, which corresponds to a stroke of 3.7%. The maximum mechanical stress in the SMA wire reaches 165 MPa. This measurement will serve as a reference for the energy analysis in the following experiments at higher voltages, which will use identical parameters for initial force and spring rate.
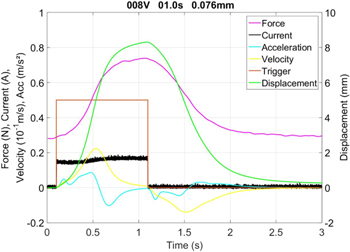
Figure 2. Conventional SMA activation as reference measurement showing a synchronized evolution of force and displacement in a quasi-static condition.
Download figure:
Standard image High-resolution imageIn all of the experiments performed with quasi-static actuation mode, the displacement is measured as a direct output. The force and displacement signals are always in phase, implying that inertial effects are negligible. From a mechanical point of view, the system is described by the equilibrium of forces, including the SMA force FSMA, the spring force Fspr and the weight force Fweight:

Note that the inertia force is neglected in (1), due to the quasi-static condition. After the supply voltage is turned off, the SMA force and the displacement return to their initial starting values. The displacement signal shows the effects of the thermal cooling of the SMA wire.
The energy balance for this conventional activation is described by:
The electrical energy input is calculated by integrating the electrical power (P = U · i, voltage U, current i) in the time interval [t0, t1], where t0 is the initial time and t1 is the time at which the transformation temperature Ttrans is reached and the phase transformation is completed. The total electric energy equals the sum of three contributions, reported on the right-hand side of (2). The first term corresponds to the energy required to heat the SMA wire from room temperature Tenv to transformation temperature, given by the product of (Ttrans − Tenv), specific heat capacity c and SMA wire mass mSMA. The second term h · mSMA describes the latent heat of the phase transformation. Finally, the third term accounts for the heat loss due to thermal exchange between the SMA wire and the environment, where α is the convective cooling coefficient, and ASMA is the surface area of the SMA wire.
Note that both i and TSMA are assumed to be non-constant during the time interval [t0, t1].
In contrast to the conventional activation, figure 3 shows experimental results of SMA activation at higher voltages. In these experiments, the same SMA wire with a diameter of 76 μm is activated at 24 V (figure 3, upper part), 48 V (figure 3, center part) and 125 V (figure 3, lower part).
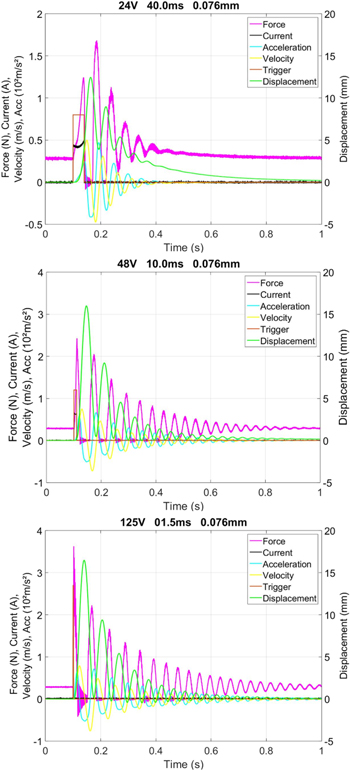
Figure 3. High-speed SMA activation at 24 V (upper part), 48 V (center part) and 125 V (lower part).
Download figure:
Standard image High-resolution imageThe first qualitative difference observed is the oscillation of the spring-mass-system before it returns to its initial starting values. The force and displacement signals are not synchronous anymore. In this dynamic system, the displacement is the result of the acceleration caused by the SMA force. Mechanically, the system dynamics have to be included by adding the inertia force Fi to (1):

For a discussion of the quantitative changes, expanded views of the three measurements in figure 3 are shown in figure 4. A comparison of the initial current values at the three different supply voltages shows that there is a variation of the measured resistance. This results from the manual clamping of the SMA wires at both ends. The clamping forces, and thus the contact and transition resistance, can vary after mounting a new SMA wire. Therefore, all the measurement series concerning energy consumption are performed with the same SMA wire. The current signal in the measurement at 24 V (figure 4, upper part) is similar to the conventional current signal (shown in figure 2). First, the current slightly decreases due to the rising temperature and thus rising electrical resistance in the SMA wire. Once the SMA wire starts contracting, the global geometric changes, in particular the shorter SMA wire length and the larger diameter, lead to a decrease of the electrical resistance and the electrical current starts to increase. The measurements at 48 V (figure 4, center part) and 125 V (figure 4, lower part) also show the decrease in the current upon activation. The higher supply voltages even result in a faster temperature increase and thus in a more significant decrease in the current signals. Because of the shorter pulse length in the measurements at 48 and 125 V, the decrease of the electrical resistance due to the contraction of the SMA wire cannot be observed in the corresponding current signals. The contraction of the SMA wire is only minimal when the electrical current is turned off. The displacement signals reach higher maximum values in comparison to the conventional activation, but the force signals are always at 0 N when maximum displacement is reached. At these points during activation, the SMA wire is slack so that the load cell is unable to detect any force. This means that maximum displacement is not reached through conventional phase transformation, but due to the extreme acceleration of the bottom mass. This effect will be referred to as 'ballistic' activation. For these three measurements, velocities and accelerations are up to two orders of magnitudes higher with respect to the conventional actuation. The force signals at 48 and 125 V show an instantaneous response to the current signal, and reach their maximum values with the first peak. The behavior of the force at 24 V is slightly different, as the maximum force is reached with the second peak. The displacement at the second force peak is almost 5 mm, which is much higher in comparison to the two measurements at higher voltages. This displacement is an indicator for the actual SMA wire contraction, i.e., the measurement at 24 V shows the transition from quasi-static to highly dynamic actuation. In this particular case, dynamic effects are barely visible, but do not dominate the response.
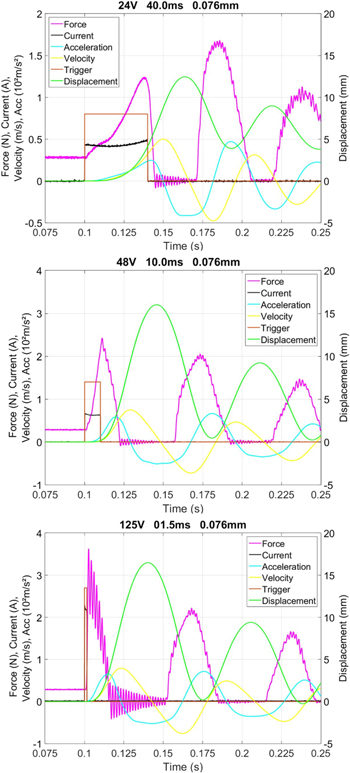
Figure 4. Zoomed-in measurements of SMA high-speed activations at 24 V (upper part), 48 V (center part) and 125 V (lower part).
Download figure:
Standard image High-resolution imageThe input energy for all three measurements in figure 3 is about 0.4 J, which is much lower than the input energy of 1.2 J for the conventional activation. In conventional activation, energy is lost to the environment during actuation, which is described by the last term on the right-hand side in (2). Very fast actuation times lead to very small time intervals [t0, t1] and the heat exchange term becomes negligible. The energy balance (2) for this adiabatic activation of SMA wires is reduced to:
A detailed discussion of the energy-efficiency follows in section 3.2, which will show that all the following experiments with supply voltages of 48 V or higher can be considered to be occurring under adiabatic conditions.
Figure 5 shows a measurement with synchronized high-speed camera recordings to visualize the ballistic effect. The rapid heating pulse and the resulting phase transformation in the SMA wire accelerate the attached mass to a velocity that causes the SMA wire to become slack. The moving mass can result in displacement values that cannot be reached by conventional phase transformation. In this experiment, a 76 μm SMA wire is activated by a 2 ms pulse at 125 V. The maximum displacement of 21 mm implies a stroke of 9.3%. The force in the SMA wire is present immediately and reaches its maximum of 4 N when the current is turned off at 2 ms. This force is equivalent to a mechanical stress of 880 MPa. After that, the force decreases as the SMA wire starts contracting and the mass is accelerated. The acceleration results in high velocities of the moving mass and the SMA wire becomes slack, as shown in the optical camera screenshots. At these points, the force signal is at 0 N. The excited spring-mass system continues then to oscillate until it reaches its initial state. The high frequency oscillation in the force signal is due to the natural frequency of the load cell. Maximum displacement is reached 38 ms after the electrical current is turned off. Interestingly, the acceleration signal also reaches its maximum with a delay of about 15 ms after activation, and after the maximum force peak. That means that the SMA wire is accelerated for a certain time interval even though there is no external energy input. This effect can be explained by an increase of the austenite transformation temperature under increasing mechanical stress, which leads to the SMA wire acting like an energy reservoir. In fact, transformation temperature typically increases with mechanical stress by a factor of 0.11–0.14 K MPa–1 [5]. In the presented measurement (figure 5) the mechanical stress reaches 880 MPa immediately after activation. The austenite start temperature of 90 °C is defined at a mechanical stress of 200 MPa [8]. Thus, at 4 N the austenite start temperature increases up to 185 °C.
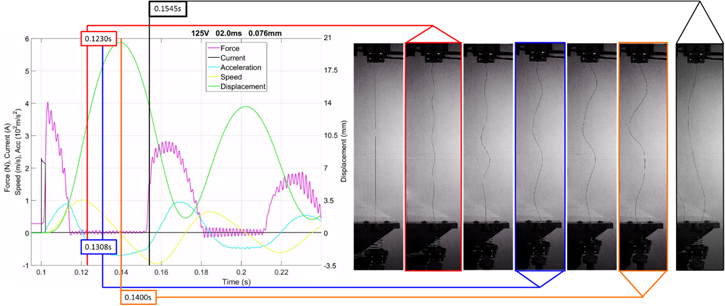
Figure 5. Synchronized high-speed recording of a 'ballistic' activation of an SMA wire.
Download figure:
Standard image High-resolution imageThe SMA wire heats up to high temperatures before the force starts to decrease as the SMA wire starts contracting. As the force decreases, the transformation temperature also drops again. The SMA wire's temperature is now higher than the transformation temperature, which leads to more energy in the hot wire being used for the phase transformation, even though there is no external energy input. After the force signal reaches 0 N, the acceleration starts decreasing, because the mechanical stress in the SMA wire and thus the transformation temperature cannot decrease any further.
During the experiment, the measured force is not in a linear relationship with the acceleration of the moving mass according to  The load cell measures the resulting forces at the top clamp of the SMA wire, while the bottom clamp represents the accelerated mass. In addition to the initial force resulting from the mass of the bottom clamp, the pre-loaded spring and the phase transformation, the load cell also records so-called force vibrations as soon as the system is in motion [26]. The last screenshot in the sequence of high-speed recordings (figure 5) is taken at 0.1545 s and indicates a slack wire. However, the load cell records a force of about 1.5 N at this time, which implies the presence of an additional force. Vollach and Shilo describe these force vibrations as a genuine mechanical response of the SMA wire due to waves that propagate along the SMA wire.
3.1. Systematic measurements
In the experimental analysis, SMA wire diameters of 50, 76 and 100 μm are evaluated at three different supply voltages and working against two different loads. The goal is to study the effects of these parameters on some performance indices which are relevant for actuator applications. The maximum force, the maximum displacement and the time delay to reach the maximum displacement are extracted from the measurements at 24, 48 and 125 V supply voltage and graphically presented to demonstrate experimental trends. At each supply voltage, five different activation pulse lengths (pulse widths) are applied, which results in a stepwise increasing energy input. The stiffness of the compression spring working against the SMA wire equals 0.056 N mm−1. Each measurement is performed with initial loads of 0.28 N (weight plus pre-loaded spring) and 0.67 N (same weight, increased spring preload). For a clear presentation of the measured data, the experimental results of the 76 μm wire at 48 V working against the lower load of 0.28 N is used as a reference. The variations of the initial load, the SMA wire diameter and the supply voltage are then displayed in separate graphs, always in comparison to this reference measurement.
In figure 6, the experimental results of the reference measurement with the 76 μm wire are displayed. At the supply voltage of 48 V, activation pulses of 2, 4, 6, 8 and 10 ms are used. With increasing activation pulse time, the generated SMA force increases (figure 6, upper part), because the total energy input is higher and more SMA material is transformed from martensite to austenite. Because of the higher forces, the weight is accelerated more. This leads to higher total displacements of the moving mass (figure 6, center part). Note that the maximum displacement obtained in most of these measurements does not correspond to the actual SMA wire contraction, but results from the high acceleration of the mass. The ballistic effect displayed in figure 5 occurs every time, when the force signal drops to 0 N. The time to reach the maximum stroke also increases, because the total displacement is much higher (figure 6, lower part) but the average speed of the moving mass is much higher for longer activation pulses.
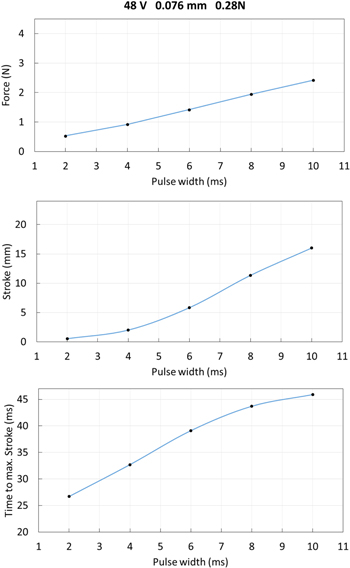
Figure 6. Measurement of the 76 μm SMA wire at 48 V, recording maximum force (upper part), maximum stroke (center part) and time delay to reach maximum stroke (lower part) for five different activation pulse lengths. The initial load is 0.28 N.
Download figure:
Standard image High-resolution imageThe effect of different initial loads is displayed in figure 7. At 48 V supply voltage, the 76 μm wire's preload is increased from 0.28 to 0.67 N by increasing the spring compression. The higher preload in the SMA wires leads to slightly higher maximum forces, but the difference becomes negligible (figure 7, upper part).
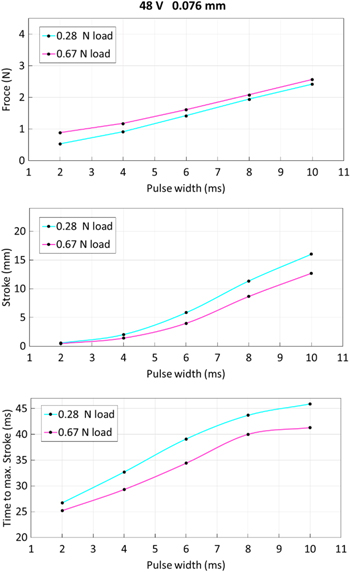
Figure 7. Comparison of maximum force (upper part), maximum stroke (center part) and time delay to reach maximum stroke (lower part) for two different loads (0.28, 0.67 N). The experiments are run at 48 V supply voltage using a 76 μm SMA wire.
Download figure:
Standard image High-resolution imageIn case of activation with a 10 ms pulse, the difference in maximum force is only 0.15 N. The high force peak right after activation results from the phase transformation. The SMA wire wants to contract immediately, but is unable to because of the load's inertia. A higher initial load results in a higher transformation temperature, that means more energy is used to heat up the wire and less energy is used for the phase transformation. Less phase transformation means that less force is added to the initial load in the first peak of the force signal. The higher initial load leads to lower maximum strokes (figure 7, center part). Because of the higher initial spring load but constant mass, the negative acceleration is higher, which leads to less total displacement and shorter times to reach the maximum stroke (figure 7, lower part).
The next experimental results show the effect of the SMA wire diameter (figure 8). A bigger SMA wire diameter results in a lower electrical resistance, which leads to a higher power during activation at a constant voltage. Also the total energy input at defined activation pulse lengths is higher for bigger diameters. This results in more energy being used for phase transformation and thus higher SMA forces generated (figure 8, upper part). For small energy inputs at short pulses (2 ms) the difference in force is not as large because the major portion of the energy is used to heat up the wire. The heating of the different wire diameters at constant voltage is very similar for these short pulses because the electrical current density is the same (and no energy is lost to the environment). The higher forces in the bigger wire diameters lead to higher strokes (figure 8, center part), because of the higher energy input and stronger acceleration of the weight. The stronger acceleration also leads to higher speeds of the mass and thus shorter times to reach the maximum stroke (figure 8, lower part).
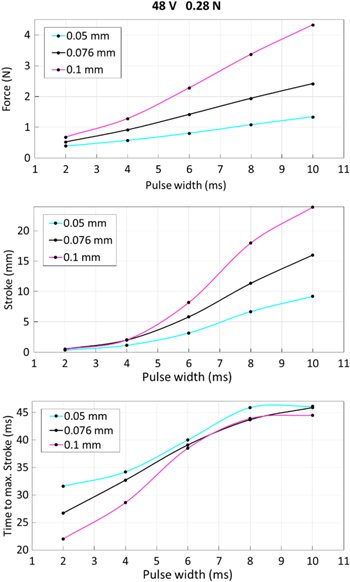
Figure 8. Comparison of maximum force (upper part), maximum stroke (center part) and time delay to reach maximum stroke (lower part) for three different SMA wire diameters (50, 76, 100 μm). The experiments are run at 48 V supply voltage and an initial load of 0.28 N.
Download figure:
Standard image High-resolution imageWhen activated with a 2 ms pulse, all three SMA wire reach the same maximum displacement, but the 100 μm wire is 10 ms faster than the 50 μm wire. When activated with a 10 ms pulse, all three wires reach their maximum displacement after about 45 ms, but the 100 μm wire shows a stroke of 23.9 mm whereas the 50 μm wire only reaches 9.2 mm.
Additionally, a comparison of the time delays to reach the reference displacement of 8.33 mm is presented in figure 9. This is of particular interest for possible application scenarios. For this comparison, the relevant experiments at 48 V for all three SMA wire diameters are selected. The reference stroke of 8.33 mm is reached by all three wires with 10 ms pulses and by the two bigger diameters at 8 ms pulses. The 100 μm SMA wire reaches the reference stroke in less than 23 ms.
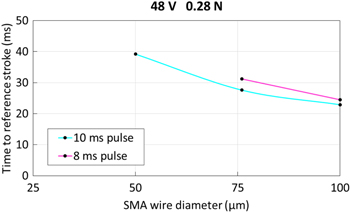
Figure 9. Time delays to reach the reference stroke of 8.33 mm for different SMA wire diameters activated with an 8 ms and a 10 ms pulse at 48 v supply voltage.
Download figure:
Standard image High-resolution imageThe last parameter study considers three different supply voltages (figure 10). At different voltage levels, the activation pulse lengths have to be adjusted so the energy input stays similar. Therefore, this study investigates maximum force (figure 10, upper part), maximum stroke (figure 10, center part) and time to reach the maximum stroke (figure 10, lower part) in relation to the input energy. Again, the 76 μm wire is used in these experiments with an initial load of 0.28 N. Higher voltages result in higher forces for the same input energy. Higher voltage equals higher electrical power. As previously explained, the force increases as long the load's inertia prevents the SMA wire from contracting. The faster the total energy is injected into the SMA wire, the more phase transformation takes place before the weight starts moving. The maximum stroke is almost identical at 48 and 125 V. As shown in figures 4 and 5, the maximum displacement is reached by the 'ballistic' acceleration of the mass. The highest point can be related to a potential energy. If no energy is lost during the experiment, the same input energy results in the same output. At 24 V, the SMA wire is not able to generate the same stroke, which means energy is lost during activation. The activation pulses at 24 V are much longer, which results in cooling of the wire during the activation. The generated stroke of about 12.5 mm for an energy input of 0.4–0.5 J is still the result of the ballistic activation, but the maximum stroke does not increase further. The activation pulse at 0.4 J is 40 ms long. This time interval is long enough for the system to reach a thermodynamic equilibrium, so that even longer activation pulses do not result in higher forces and higher output strokes. Again, the high acceleration of the bigger wire diameter leads to faster activation times. As before, also the time delays to reach the reference stroke are compared for the different supply voltage levels (figure 11). For an energy input of 0.4 J, the stroke of 8.33 mm is reached at all three voltages. At 125 V the reference displacement is reached in under 22 ms.
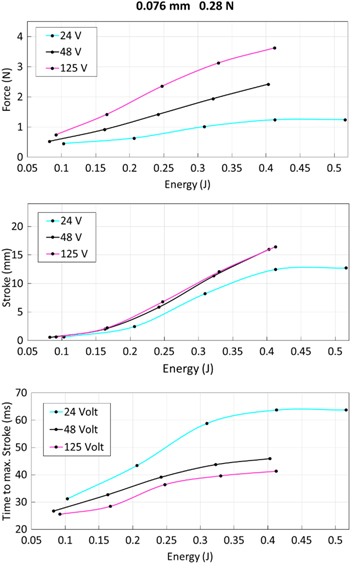
Figure 10. Comparison of maximum force (upper part), maximum stroke (center part) and time delay to reach maximum stroke (lower part) for three different voltage supply levels (24, 48, 125 V). The experiments are run with a 76 μm SMA wire and an initial load of 0.28 N.
Download figure:
Standard image High-resolution image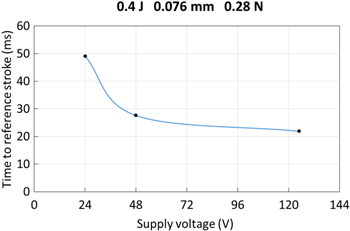
Figure 11. Time delays to reach the reference stroke of 8.33 mm for different supply voltages. The 76 μm SMA wire is always activated with a total energy of 0.4 J.
Download figure:
Standard image High-resolution imageEven at the moderate voltage of 24 V, figure 10 shows only a small decrease in energy-efficiency and performance for the activation compared to the higher voltages. The following section takes a closer look at the energy balance during high-speed SMA activation.
3.2. Energy-efficiency
The minimum energy for a phase transformation is reached under adiabatic conditions. This means that no energy is lost through heat flow to the environment during the process. This minimum energy can be calculated with (4). The energy to heat a SMA wire (76 μm) from room temperature to transformation temperature (ΔT = 65 K) is calculated with the specific heat capacity c = 500 J kg−1 K−1 and the mass mSMA = 6.58 m. The term  in (4) describes the latent heat of the phase transformation with h ≈ 20 J g−1 [9]. The theoretical minimum energy for a full phase transformation is calculated as Wmin = 0.345 J.
In the first exemplary experiment, which serves as the reference, a 76 μm SMA wire is activated in the conventional way using the suggested current of 150 mA in the datasheet [8]. The SMA wire is activated with an activation pulse width of 1 s. The displacement reaches the value of 8.33 mm, which corresponds to a 3.7% stroke. The same wire is then activated at increasing voltages. At each set voltage, the activation pulse time (pulse width) is slowly increased until a displacement of 8.33 mm is reached. In all experiments, the initial force in the SMA wire is 0.28 N and a spring rate of 0.056 N mm−1 is used. The results of these experiments are shown in table 1. The activation delay describes the time interval from the start of activation until the bottom clamp of the SMA wire reaches maximum displacement of 8.33 mm.
Table 1. Comparison of activation speed and energy consumption at different activation pulse widths for a 76 μm SMA wire.
| Voltage [V] | Displacement [mm] | Pulse width [ms] | Activation delay [ms] | Energy [J] | Ratio [%] |
|---|---|---|---|---|---|
| 8 | 8.33 | 1000 | 1008 | 1.2 | 100 |
| 12 | 8.33 | 226 | 237.1 | 0.637 | 53.1 |
| 16 | 8.33 | 77 | 95.2 | 0.370 | 30.8 |
| 24 | 8.33 | 29.2 | 57.2 | 0.305 | 25.4 |
| 30 | 8.33 | 17.7 | 49 | 0.288 | 24 |
| 35 | 8.33 | 12.8 | 45.8 | 0.282 | 23.5 |
| 40 | 8.33 | 9.74 | 43.9 | 0.280 | 23.3 |
| 48 | 8.33 | 6.71 | 42 | 0.277 | 23.1 |
| 70 | 8.33 | 3.08 | 39.7 | 0.272 | 22.7 |
| 110 | 8.33 | 1.21 | 38.5 | 0.267 | 22.3 |
| 125 | 8.33 | 0.94 | 38.3 | 0.266 | 22.2 |
The experimental results and observed tendencies are presented in figure 12. The necessary pulse width to reach the reference displacement decreases dramatically between 8 and 16 V, and stays almost constant after 24 V (a). The energy consumption shows a very similar behavior (c), as it is directly linked to the pulse width (d). Interestingly, also the activation delay mimics this behavior (b). The reason for this is the experimental procedure focusing on energy consumption analysis. If no energy is lost because the experiment runs under adiabatic conditions, the same total energy amount is necessary to generate a constant displacement output, which relates to a constant potential energy. At higher electrical powers, the initial force and thus the acceleration of the mass increases but at the same time the pulse width, which describes the acceleration interval, is decreased. This leads to a constant average velocity and activation delay. If shorter activation delays at the same displacement are desired, the pulse width can be increased at high electrical power. In this scenario, the displacement could be limited by a hard stop in the construction.
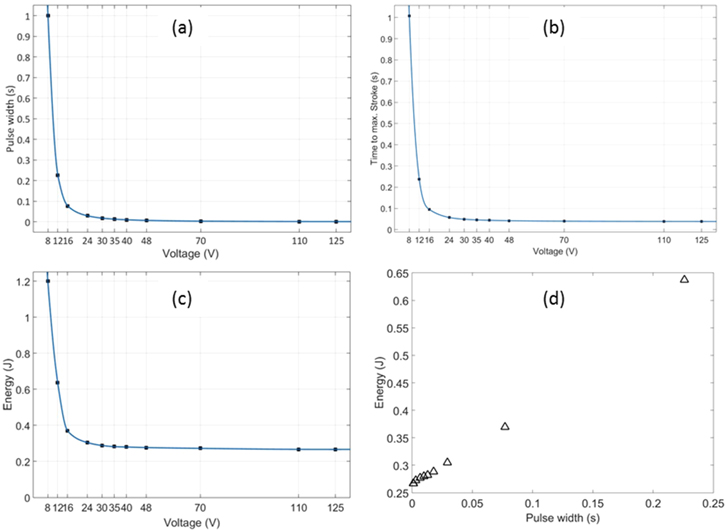
Figure 12. Graphical illustration of experimental results regarding activation pulse (a) activation speed (b) and energy consumption (c) in relation to the supply voltage and energy consumption in relation to the activation pulse (d) for a 76 μm diameter SMA wire.
Download figure:
Standard image High-resolution imageThe energy consumption for pulse widths between 1 and 30 ms is very similar. With a 77 ms activation pulse at 16 V, the energy consumption starts to increase more rapidly. The results of these experiments suggest that activation pulse widths up to almost 30 ms result in nearly adiabatic conditions. To verify these observations from a theoretical point of view, an estimate time interval for adiabatic conditions can be calculated. The temperature of a body according to Newton's law of cooling is determined by

The time constant  in this thermal process is described with the product of thermal resistance and heat capacity:

With a heat capacity of  and a thermal resistance of
  the time constant
  for the cooling process can be calculated. The heat transfer coefficient
  for the convective cooling process of the SMA wire at room temperature can vary between 10–100 W K−1 m−2. Usually values close to 10 W K−1 m−2 are chosen to represent conditions with minimal air flow. The parameter A describes the heat transfer surface area of the SMA wire. With the time constant
  and (5) the time interval for a near adiabatic phase transformation can now be determined. Considering a 1% cooling of the wire, this time interval is calculated as
  Using the parameters in this experiment, time intervals between 6.2–61.6 ms are theoretically possible. The observed value of 30 ms relates to a heat transfer coefficient
  of 20 W K−1 m−2, which is highly reasonable for the considered setup. For this SMA wire diameter, the experimental results for the energy consumption during a high-voltage SMA actuation are even slightly lower (22.2%) than the calculated theoretical minimum (28.8%). This minimum was calculated assuming a complete phase transformation, but the displacement in the experiments relates to a stroke of only 3.7%. For complete phase transformation strokes of 4%–5% can be expected. Additionally, the displacement in the experiments at voltage values equals or larger than 16 V was reached due to the ballistic effect, which means that even less phase transformation has taken place. On the other hand, the calculation of this energy minimum does not take into account the increasing austenite start temperature for the phase transformation under mechanical stress. As stated above, the transformation temperatures generally changes with a factor of 0.11–0.14 K MPa–1. Since the mechanical stress is not constant during the actuation, the transformation temperature will change constantly during the activation process. In summary, the actual energy balance in these experiments cannot be trivially calculated, but a magnitude of possible exemplary energy savings can be determined. In addition to the absolute energy value, also the experimentally identified time interval for adiabatic conditions matches the theoretical considerations.
The same measurement sequence is performed for the SMA wire diameters of 50 and 100 μm. The total energy consumption at the different supply voltages is illustrated in figure 13. At low voltages, the thin wires need more energy to reach the same stroke. Thin wires have a higher surface-to-volume ratio and thus lose more energy to the environment during non-adiabatic activation. Between 12 and 16 V the SMA wire start to reach the adiabatic region and the energy consumption settles at near constant values. At these voltages, the thin wires need the least amount of energy. The two components of energy have been introduced in (4). First, the SMA has to be heated to the transformation temperature ( ). After that, energy is consumed by the latent heat of the phase transformation
  In small diameter SMA wires is less material to be heated up before the actual phase transformation can begin.
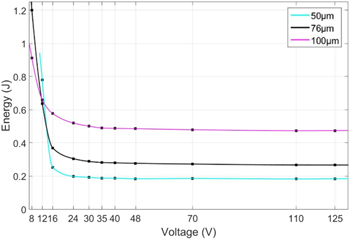
Figure 13. Total energy consumption for three different SMA wire diameters.
Download figure:
Standard image High-resolution imageThe different energy levels for the SMA wire diameters lead to almost identical pulse widths at set voltages (figure 14).
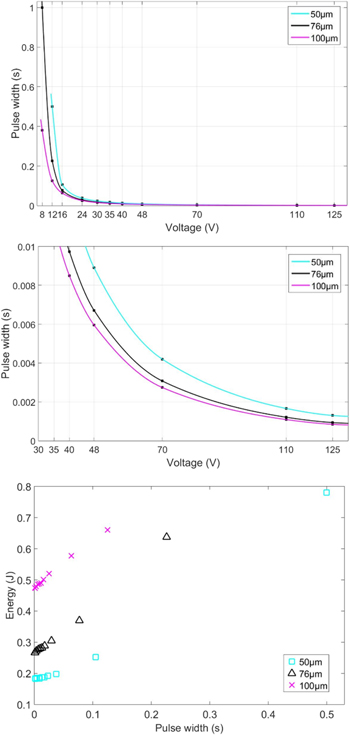
Figure 14. Comparison of the activation pulse widths in relation to the supply voltage (upper part) with zoomed-in graph (center part) and in relation to the energy consumption (lower part) for three different SMA wire diameters.
Download figure:
Standard image High-resolution imageThe expanded diagram (figure 14, center part) shows that the pulse widths are always slightly higher for thinner SMA wires. In relation to the total energy consumption, the pulse width of the thin wires rapidly increases once the activation starts leaving adiabatic regions (figure 14, lower part). In that case, the thicker SMA wires quickly become more energy-efficient because of their smaller surface-to-volume ratio.
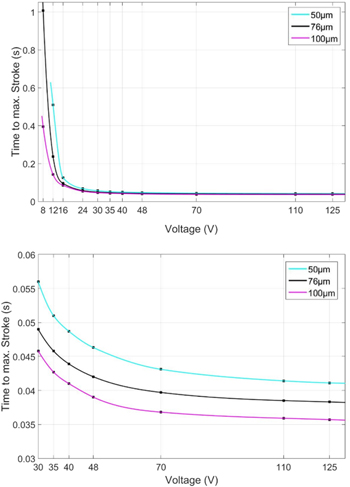
Similarly to the pulse width, the activation speed is almost identical for the different SMA wires, provided that they are activated under adiabatic conditions (figure 15). The zoomed-in graph (figure 15, lower part) indicates that the thicker SMA wires are slightly faster than the smaller wire diameters, which is related to higher acceleration forces in thicker SMA wires due to the higher electrical power for activation.
Figure 15. Comparison of the activation speed in relation to the supply voltage (upper part) with zoomed-in graph (lower part).
Download figure:
Standard image High-resolution image
4. Conclusions
This paper has presented an experimental investigation on an alternative SMA wire actuation strategy based on high-voltage pulses. Instead of relying on complex and cost-intensive power electronics for current control, the novel control strategy can be performed with simplified hardware capable of applying a short voltage impulse for a short period of time. Additional advantages of the proposed strategy are high actuation speeds and lower energy consumption. An experimental setup for investigating the SMA wire behavior has been described, and systematic measurement results have been discussed. The load and the pre-tension of the SMA wire affect the overall actuator dynamics. In addition, it is shown how high accelerations can lead to ballistic effects, which are responsible for a large actuation stroke. Once activated, the actuator system starts oscillating, according to a mass-spring-damper dynamics. The presented exemplary experiment showed activation times in the range of 40 ms for strokes of close to 10%. With shorter activation pulses, energy consumption during activation is minimized, because no heat is lost to the environment. This adiabatic heating is already reached at moderate voltages around 24 V for the 76 μm wire. An analytical method of estimating the minimum energy for the SMA actuation and the maximum time interval for adiabatic conditions has also been demonstrated and discussed. Energy savings up to 80% have been achieved.
Possible applications for this SMA activation could be in the field of release mechanisms, safety applications or switches, where only a single actuation or low frequency activations are needed. As an example, an SMA actuator could be used to release a spring loaded system, in which dynamic effects like oscillations don't have any negative influence on the actuator performance.
In a next step, the experimental setup will be improved with an additional force measurement at the moving end of the SMA wire for a better force-acceleration correlation during the actuation. Also, the mentioned effect of the varying contact resistance will be addressed by an improved clamp design. Further research will focus on the investigation of SMA actuation with high AC voltage, specifically looking at mains voltages like 130 V in the United States and 230 V in Europe.
Acknowledgments
The authors would like to acknowledge Thomas Würtz for the technical support in the building of the test setup, specifically the electronic components and SAES Getters for providing the SMA material.