
Abstract
Cathodic arcs have been utilized in various applications including the deposition of thin films and coatings, ion implantation, and high current switching. Despite substantial progress in recent decades, the physical mechanisms responsible for the observed plasma properties are still a matter of dispute, particularly for multi-element cathodes, which can play an essential role in applications. The analysis of plasma properties is complicated by the generally occurring neutral background of metal atoms, which perturbs initial ion properties. By using a time-resolved method in combination with pulsed arcs and a comprehensive Nb−Al cathode model system, we investigate the influence of cathode composition on the plasma, while making the influence of neutrals visible for the observed time frame. The results visualize ion detections of 600 μs plasma pulses, extracted 0.27 m from the cathode, resolved in mass-per-charge, energy-per-charge and time. Ion properties are found to be strongly dependent on the cathode material in a way that cannot be deduced by simple linear extrapolation. Subsequently, current hypotheses in cathodic arc physics applying to multi-element cathodes, like the so-called 'velocity rule' or the 'cohesive energy rule', are tested for early and late stages of the pulse. Apart from their fundamental character, the findings could be useful in optimizing or designing plasma properties for applications, by actively utilizing effects on ion distributions caused by composite cathode materials and charge exchange with neutrals.
Export citation and abstract BibTeX RIS
1. Introduction
Cathodic arcs have been investigated for more than 200 years [1, 2], and various physical concepts have been developed in recent decades—being particularly well established for the simplest case: cathodic arcs of single-element cathodes in high vacuum. To give a few examples: the explosive electron emission or ecton model [3]; the fractal character of several arc properties, like the burning voltage and its noise [4]; the relationship of the latter and other arc properties to the cathode material's cohesive energy [5]; or the so-called 'freezing' of ion charge state and energy distributions in the process of plasma expansion [6]. Apart from general scientific curiosity, the economic need to improve applications such as thin film and ion implantation systems and processes, as well as high current switches, is a major driving force for the advancement of the physical understanding of these phenomena.
Ions in cathodic arcs mainly originate from the cathode; therefore, the influence of the cathode material on plasma properties is of particular interest. Beside the use of process gases or several single-element cathodes, multi-element cathodes provide a natural way of introducing different ion species into the plasma and are commonly used in applications. In recent years, an increased number of experiments on multi-element cathodes has led to a more complete picture of the physics of cathodic arcs. For instance, in addition to the observation that the most likely ion velocity in cathodic arcs does not depend (or depends only slightly) on charge states [7, 8], the most likely ion velocity also seems to be independent of ion masses for multi-element cathodes [9]. This observation strengthened the validity of the gas-dynamic theory of plasma expansion in cathodic arcs. Another important aspect of cathodic arc physics, which is also related to the last point, concerns neutrals and their contribution to plasma properties [10–12]. It was pointed out [12] that in vacuum arcs, 'evaporated atoms from macroparticles and still hot cathode craters', ion reflections and self-sputtering from nearby surfaces increase the density of neutrals over time. This effect typically saturates several hundred microseconds after triggering of the arc [12]. The neutral background reduces the ions' average charge state [11], which means it generally affects ions farther away from the cathode [10]. Because it is experimentally hardly possible to extract ions directly from the cathode spot plasma, information on ion energy and charge state distribution is always influenced by the above perturbations and effects. The use of pulsed arcs and time-resolved techniques can overcome these shortcomings to some extent, by revealing the magnitude of these effects for the observed time frame. For single-element cathodes, such time evolutions of cathodic vacuum arc plasma parameters have been studied in various reports [11–14]. For multi-element cathodes, the available literature does not specifically take into account time dependencies and their consequences to ion properties, e.g. in [9, 15–20].
To further improve the understanding of multi-element cathodes and their influence on cathodic arc plasma parameters, the combination of time-resolved measurements and a comprehensive multi-element cathode model system is necessary. A novel technique to measure time-resolved ion charge state and energy distributions for cathodic arcs using a commercial mass-energy analyzer (MEA), was introduced by Tanaka et al [21] using Cu cathodes. It was later applied to a Cr75Al25 composite cathode, where the results were compared to a Cr single-element cathode [22]. Along with others, the findings suggest the presence of charge exchange collisions between Cr and Al species. However, a model system covering the entire compositional range, including both single-element cathodes, is necessary to provide a complete picture about the influence of multi-element cathodes on arc plasma properties. In the current work, Nb−Al was chosen as a model system, since it combines a high cohesive energy refractory metal (Nb) with a low cohesive energy metal (Al). Due to their known and quite different ion properties in the plasma of single-element cathodes [23], a distinguishable behavior for intermediate composite cathodes can be expected. Furthermore, the potentially high maximum charge states of Nb ions provide sufficient data to analyze charge dependencies. Based on the relatively simple phase diagram of the Nb−Al system—with only three intermetallic phases—three composite cathodes with corresponding compositions were chosen for the experiments. By studying this model system with the technique mentioned, a comprehensive dataset of time-resolved ion properties in pulsed cathodic arc plasmas from Nb−Al cathodes has been obtained. It is used here to test current hypotheses of cathodic arc physics related to multi-element cathodes, in order to reveal further details about the influence of the cathode material on cathodic arc discharges.
2. Method
2.1. Experimental setup
The experiment was conducted using a Hiden EQP 300 mass-per-charge and energy-per-charge analyzer (referred to as MEA), differentially pumped to a pressure of 10−6 Pa by a turbo molecular pump (Pfeiffer TMU-071P). The main components of this instrument are a 45° electric sector field energy filter (ESA), a quadrupole mass-per-charge filter, a secondary electron multiplier, and the mass spectrometer interface unit (MSIU), which provides the data output to e.g. a personal computer. Relevant instrument parameters used for the measurements are summarized in section 2.4. A schematic diagram of the complete experimental setup is shown in figure 1. The MEA was attached to a high vacuum chamber of 1 m inner diameter and 0.25 m inner height at a base pressure of 10−4 Pa. The chamber was initially evacuated by a scroll pump and then pumped by a cryogenic pump (Cryogenics Cryo-Plex 8LP). The pressure was monitored by a cold cathode ionization gauge (MKS Instr. 421), a Bayard−Alpert type ionization gauge (MKS Instr. 274) and a Pirani vacuum gauge (MKS Instr. 275).
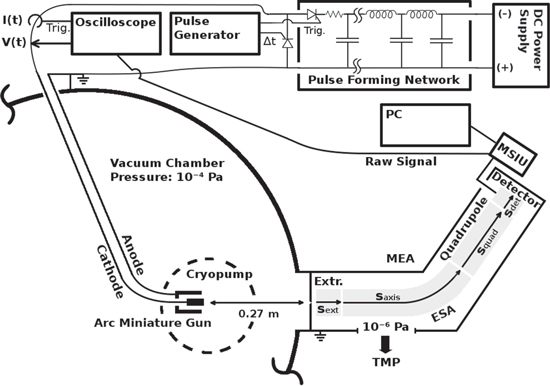
Figure 1. Schematic diagram of the experimental setup indicating the arc miniature gun in the vacuum chamber, the differentially pumped MEA, the electric circuit including the pulse forming network, and other peripheral devices. Details are explained in section 2.1 and 2.4.
Download figure:
Standard image High-resolution imageThe cathode (cylinder of 6.35 mm diameter and about 20 mm length) was mounted using an arc miniature gun, which is described in [24]. It was set to point directly at the MEA orifice (50 μm bore) at a distance of 0.27 m. All other distances, e.g. to walls or other objects in the chamber, were also kept constant during all measurements. The orifice and the anode/chamber were at ground potential. Five different cathode materials were used: Nb, Al, and Nb−Al composites with the atomic ratios 75/25, 67/33 and 25/75—related to the stoichiometric ratios of the three phases Al3Nb, AlNb2 and AlNb3. All cathodes were purchased from and fabricated by a company specializing in powder metallurgy, using powders with a grain size smaller than 135 μm and ensuring a purity of 99.9% in the final product. The virgin cathodes were analyzed using x-ray diffraction and scanning electron microscopy, which did not reveal any significant impurity or intermetallic phase. The arc was operated 'triggerlessly' (self-igniting), as shown in [25–27], using a pulse forming network (PFN) and a 1 kV power supply (Glassman High Voltage Inc, series KL). The PFN delivered an approximately rectangular current pulse of 1 ms, which was cut off (using a short circuit) at about 600 μs, indicated by Δt in figure 1. This enhances the rectangular shape of the pulse, and is discussed in detail in [21]. The charging voltage of the PFN was always set to 250 V at all times. Two pulse generators (Hewlett-Packard 8013B and Berkeley-Nucleonics-Corporation AP-3) were used to trigger start and stop of the arc pulse and to set the pulse frequency, which was 5 Hz in all measurements. The potential difference between cathode and anode (grounded) was measured by a 1:100 high voltage probe (Tektronix P5100A). The arc current was measured by a 0.01 V A−1 wide-band current monitor (Pearson Electronics Inc. 101X). Voltage, current and the raw output from the detector were recorded using an oscilloscope (Tektronix TDS104B). Because the natural abundance of  , as well as for
  is 100 at.% ([28], section 11.56), only these isotopes have been taken into account. For all measurements, the isotopic mass per charge number ratios stated in table 1 have been used. For each cathode composition, a virgin cathode (plain and polished surface, cleaned with ethanol) was mounted, preprocessed with about 150 arc pulses (30 s) and then used for measurements until the first signs of arc instability were observed.
Table 1. List of isotopic mass (m) per charge number ratios used. Isotope mass and abundance were taken from [28].
| Isotope | Abundance | m [u] |
 [u] [u] |
 [u] [u] |
 [u] [u] |
 [u] [u] |
|---|---|---|---|---|---|---|
| 93Nb | 100 at.% | 92.91 | 46.45 | 30.97 | 23.23 | 18.58 |
| 27Al | 100 at.% | 26.98 | 13.49 | 8.99 |
These were noticeable through unusual voltage fluctuations and delayed arc ignition, which is mainly caused by cathode erosion and its effects on triggering the arc. In such a case, the cathode was remounted (in a refurbished state) and the measurements were continued at the same base pressure after preprocessing. Remounting was necessary once for the Nb75Al25 and Nb67Al33 cathodes each. In the course of measurements, each cathode was used for approximately 104 plasma pulses. The eroded cathodes are shown in figure 2, where different amounts and spatial distributions of erosion for each cathode material can be observed.
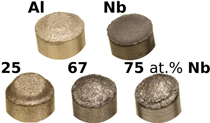
Figure 2. Eroded cathode surfaces of Al, Nb and the three compositions after approximately 104 arc pulses.
Download figure:
Standard image High-resolution image2.2. Measurement principle
The basic measurement principle used has been described in detail elsewhere by Tanaka et al [21]. The main idea is to realize time-resolved measurements using the MEA by recording the raw signal from its detector, as opposed to utilizing the instrument's standard software. This data acquisition has to be done for the full arc pulse duration using a suitable time resolution (here 200 ns). When doing this for a sufficient number of arc pulses (≈65 here) and averaging over them, we can calculate an intensity for each time step which is proportional to the detections logged at that time of the pulse. As a consequence, the information gained is always based on an average of 65 arc pulses and does not provide insights on any single pulse. This also means the results are limited by the natural fluctuations of the plasma parameters which are inherent to cathodic arcs [1, section 4.3.4].
2.3. Limitations of plasma analysis based on an MEA
When using an MEA, several side effects can lead to false or biased detections. For example, collisions in the instrument path, or the so-called 'acceptance cone'—i.e. only those ions can be detected that arrive within the acceptance cone of the instrument; the acceptance cone depends slightly on ion energy, being larger for low energy ions (<10 eV). However, a more critical limitation is that the experimental setup only provides information on ions entering the grounded orifice of the MEA, but not directly on all ions in the plasma or at the cathode. The history of the ions arriving at this orifice is in principle unknown. To shift this viewpoint further into the plasma, several corrections and extrapolations of the data are commonly applied—for example, the subtraction of the ions' kinetic energy change in the plasma sheath to the grounded orifice of the analyzer, or a correction of the predicted ion flight times in the plasma stream. The premise of this work is to present and discuss the recorded data in a preferably raw state and only include the most reliable corrections. Since the MEA parameters are known in detail, the ion flight time corrections for the instrument path mentioned earlier are considered reliable, and will be applied to the data. However, the time-of-flight correction for ions in the plasma stream, as carried out in [21] and [22], is considered unreliable for the current work. The plasma sheath ion energy correction is more difficult to evaluate. A direct way of realizing such a correction involves measurements of the plasma potential. In pulsed arcs, the plasma potential's strong time dependence immediately following triggering of the pulse [22] adds more complexity and also raises questions of its physical distinctiveness at that time. Additionally, plasma probe measurements have large inherent errors, and alter the plasma itself. As a result, we have chosen not to include such a correction. All experimental data will reflect the situation at the grounded analyzer's orifice.
2.4. Data processing
The raw signal of the MEA detector had an actual offset voltage of 4.90 V ± 0.05 V. Therefore, that value was subtracted from the waveforms recorded and averaged at the oscilloscope ( ) (see equation (1), t stands for time). The resulting voltage is proportional to the ion counts and referred to as 'intensity' (I) [21, 22]:

One way of verifying the validity of this technique is to integrate the intensities over the full pulse duration and compare the result to the time-averaged data generated by the MEA software (Masoft). Masoft is always used to set the MEA parameters (e.g. to control the mass and energy filter), and successively counts the total detections during a set time period (the 'dwell time'—1 s in the present work). Such a comparison is carried out in section 3.3.2.
Every dataset (there is one for every cathode material and charge state) has been corrected by its own background signal, which was usually an acquisition at the end (after the signal showed no significant detections but background only). This was done because of superimposed voltage fluctuations, which were noticeable particularly at the time of starting and stopping the arc (induced by the strongly increasing/decreasing currents in time). The other correction applied to the data is the already-mentioned shift by the ion time-of-flight (TOF) inside the MEA (τi). The basic procedure is explained in detail in [21], based on technical information provided by the instrument manufacturer. The calculation used in this work has been slightly changed (no ion TOF correction of the plasma stream), and is shown in equation (2), where τ generally stands for the TOF in a specific section of the instrument and s stands for the associated path lengths. The four indices 'ext', 'sec', 'quad' and 'det' refer to extractor, electric sector field, quadrupole mass filter and detector. Q is the charge number, e the elementary charge and m the ion mass.


The voltages (V) given in this equation are the following: the extractor voltage (Vext); the so-called 'axis voltage' (Vaxis), which is the main determinant of the fixed kinetic energies needed to pass the energy filter; the transmission energy voltage (Vte), which sets the transmission energy of the ion in the quadrupole mass filter; and the potential of the first dynode (Vdyn) preceding the electron multiplier. This approximation of τi depends only on ion charge and mass, and not on the initial kinetic energy of the incoming ion. The reason for this is that every later detected ion entering the MEA has a kinetic energy of QeVaxis in the energy filter. The energy filtering is controlled by changing the potential at the extractor exit or the instrument's reference potential. A more detailed description is available in [21] and the instrument's technical documents. The voltages and instrument path lengths used in equation (2) can be reviewed in table 2. Solving equation (2a) e.g. for a single charged Nb ion results in a TOF of approximately 8.3, 29.0, 71.2 and 1.7 μs for the various instrument sections (in listed order). When assuming arbitrary uncertainties of 5% for path lengths and voltages and 0.2 for atomic mass units, the error for this calculation is in the range of 0.5 to 1.9 μs, depending on mass and charge.
Table 2. MEA parameters: the most relevant instrument voltages (V) and path lengths (s) of the various device sections. The indices and their meanings are explained in the text (section 2.4).
| Voltages [V] | Path lengths [m] | |||||||
|---|---|---|---|---|---|---|---|---|
| Vext | Vaxis | Vte | Vdyn | Vmult | sext | ssec | squad | sdet |
| −12 | −40 | 3 | −1200 | 1800 | 0.0588 | 0.2646 | 0.1778 | 0.0415 |
3. Results
3.1. Arc current and voltage
The potential of the cathode connector at the vacuum chamber feed through and the current flowing through it was recorded simultaneously with the ion intensities. For each time and energy step, charge state and cathode composition, a current/voltage sample was taken. One has to be aware that these voltages are slightly larger than the actual arc voltage, because of the voltage drop inside the cathode and other relevant parts of the circuit. This offset can be several volts [29]. The general current and voltage pulse shapes are displayed in figure 3(a) for the Nb cathode.
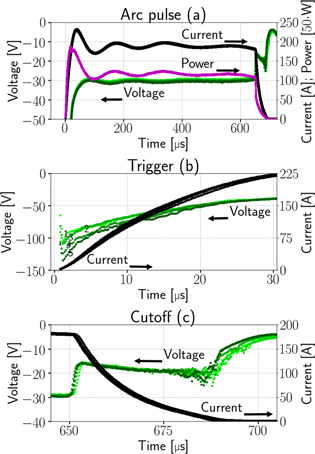
Figure 3. Time evolution of current (black), voltage (green) and power (pink) for the Nb cathode (a) and details for the arc trigger (b) and cutoff (c).
Download figure:
Standard image High-resolution imageFigures 3(b) and (c) show details for the arc trigger and cutoff respectively. The overlapping curves represent the average of the voltages or currents recorded for all energy steps of a specific charge state. Although the arc voltage depends mainly on the cathode material, other influences like the previously accumulated number of pulses on the cathode (erosion) and different voltage drops due to mounting also play a role. The differences of the voltage curves in brightness (additionally marked by numbers in figure 3(b)) also indicated the chronology of the measurements (darkest were measured last). A general decrease in voltage proportional to the number of pulses is observable. The consequences of remounting a refurbished cathode instead of an eroded cathode (like in the Nb67Al33 and Nb25Al75 case, not visible in figure 3) are even more severe, leading to voltage increase in the order of 1 V. Regardless of these circumstances, all voltage and current samples per cathode composition were used to compute a sample mean in a representative pulse time interval of 300 to 500 μs (table 3). Because of the bias from the described erosion and mounting effects, these samples are not mutually independent, which means less effective samples and a higher error. The standard error shown in table 3 assumes independent samples and can therefore only act as a lower limit. A comparison to literature data [29] is added to the table, which shows the voltage ( ) and current (
 ) of 250 μs arc pulses from Nb and Al cathodes, averaged over 16 pulses in the time interval from 150 to 250 μs and additionally corrected by the voltage drop in the circuit. It should be noted that different currents in that magnitude have only a slight influence on arc voltage [30].
Table 3.
Sample mean of voltages and currents ( and
and  ), a lower limit for their standard errors (SE), and sample counts (n) measured at the cathode feed through for the time interval: τ = [300, 500] μs. These values are listed for the measurements at each cathode composition and the single-element cathodes are compared to literature data (
 ,
,  ) from [29].
 [V] [V] |
 [V] [V] |
 [A] [A] |
 [A] [A] |
n [105] |
 [V] [V] |
 [A] [A] |
|
|---|---|---|---|---|---|---|---|
| Nb | 30.9 | 1.1 | 195 | 5 | 2.17 | 27.0 | 300 |
| Nb75Al25 | 26.9 | 0.9 | 197 | 6 | 2.84 | ||
| Nb67Al33 | 27.7 | 1.2 | 197 | 6 | 3.22 | ||
| Nb25Al75 | 23.8 | 1.1 | 201 | 5 | 2.89 | ||
| Al | 26.9 | 1.3 | 200 | 5 | 1.20 | 23.6 | 300 |
3.2. Plasma composition
Compared to the Nb-Al fractions in the composite cathodes, significantly more Nb ions than Al ions were detected. For the arc pulse interval of 300 to 500 μs, the differences have been quantified and visualized in figure 4: the results show 20% more detected Nb ions for Nb75Al25, 16% more for Nb67Al33 and 26% more for Nb25Al75 cathodes.

Figure 4. Fraction of Nb ions of the total detections for each composite cathode in the time interval of 300 to 500 μs, compared to the Nb fraction in the cathode.
Download figure:
Standard image High-resolution image3.3. Ion energy distributions
3.3.1. Time-resolved distributions
An outline of all the recorded intensities is shown in figure 5. Each column (a−e) stands for a different cathode composition (increasing Al content from left to right). The rows display the observed ion charge states. No significant detections were found for higher charge states. The recorded data have a time resolution of 200 ns, the energy resolution is 3 eV for single, 6 eV for double and triple, 8 eV for fourfold and 10 eV for fivefold charged ions. These energy increments result from the arbitrarily chosen reference voltage step size (3 V or 2 V), and are a compromise between energy resolution and the duration of the measurement. The intensities are represented in color. The gray/white areas (intensity near zero) indicate noise and remains of the background and also visualize the energy ranges actually measured. Every data row in each graph represents one saved acquisition at the oscilloscope, which is an average over approximately 65 plasma pulses at the full pulse duration for that specific energy. Due to small jitter in setting the arc pulse length, the time of the actual arc termination (determined by the arc voltage and current) is marked by a vertical black line in every graph.

Figure 5. Intensities of observed ion species depending on the time after triggering the plasma pulse, and the ions' kinetic energy at the MEA orifice. The columns show the different cathode materials, while the rows distinguish the different ion charge states and/or elements of the detected ions.
Download figure:
Standard image High-resolution imageThe basic properties of such pulses have already been presented and discussed in [21, 22]. As expected, the current results show in principle similar intensity−energy−time behavior. In the publications mentioned, the pulses were separated into two parts based on the plasma potential. In this paper, the pulses will be divided into three phases based on the recorded intensities. The first of these ranges from the initial detections until stable energy distributions and intensities have been reached, which shows a very transient behavior up to 300 μs. The second phase is the result of the first one, and covers the constant behavior until the arc is terminated. The last phase starts with the arc cutoff and therefore shows, again, a very transient behavior. It shows the effect of terminating the arc by redirecting the current into a short circuit. The last phase is mainly included to enable full time integration of the intensities and make the results comparable with non-time-resolved data. When the arc is terminated, it actually takes about 40 μs for the current to reach zero (see figure 3(c)), which is one reason for the observed prolonged detections. For the Nb, Al and Nb67Al33 cathodes, details of figure 5 for phase 1 are shown in figure 6. There, the dotted lines indicate a hypothetical collision-less TOF of ions from the cathode to the MEA orifice (0.27 m) at constant kinetic energy (corresponding to the energy axis). Time zero (triggering) is marked by a vertical black line.
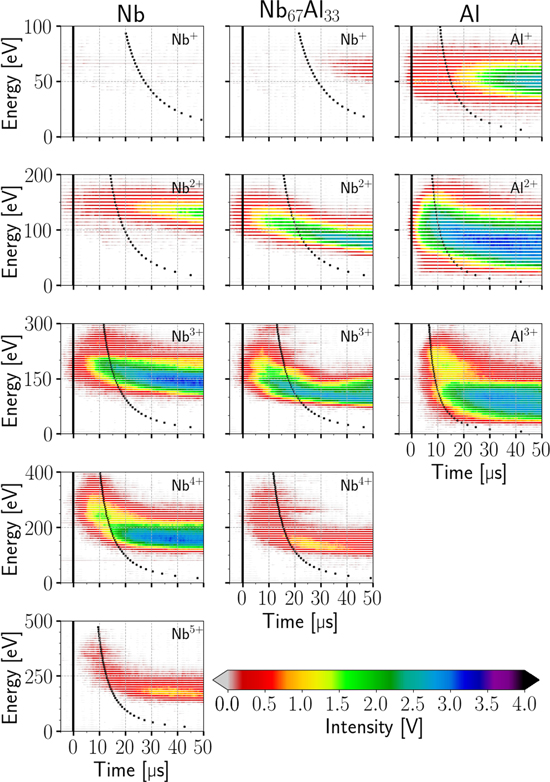
Figure 6. Details of figure 5 for initial detections of ions from Nb, Al and Nb67Al33 cathodes. The black markers indicate a hypothetical collision-less TOF of ions from the cathode to the MEA orifice, at constant kinetic energy corresponding to the energy axis.
Download figure:
Standard image High-resolution image3.3.2. Time-averaged energy distributions
The changing energies for the various cathode compositions can be viewed more clearly in figure 7 which displays the time-integrated energy distributions for Nb (first column) and Al ions (second column). The cathode compositions are differentiated by color: black for pure Nb or Al, blue for 75, red for 67 and green for 25 at.% Nb content. Apart from that, two different versions are displayed for each curve. The dots indicate the time-resolved raw data. In particular, they show the energy distributions integrated over the full pulse duration (0 to 900 μs). The lines display the data recorded by the proprietary MEA software. That is, all detections during one second (5 pulses), which are automatically recorded at the beginning of every energy step. The right axis (count rate) applies to the Masoft data, the left axis (intensity) to the raw detector data. The two sets of measurements are in good agreement, indicating that the time-resolved raw data is true and shows properties of the vacuum arc plasma. The availability of time resolved data makes it possible to observe the time evolution of these energy distributions, especially in the transient first phase of the arc. Moreover, the distributions of the stable phase (2) can be analyzed—without influence of the arc initiation or breakdown, which has similarities to DC arcs. This cannot easily be done with the commercial Masoft software.
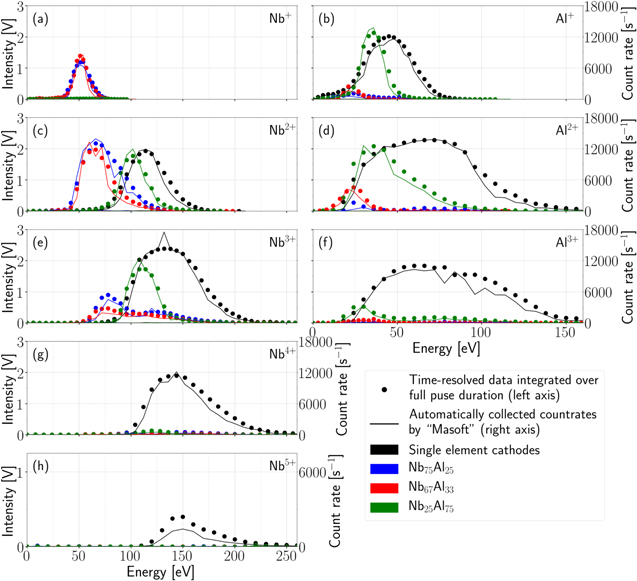
Figure 7. Energy distributions for Nb and Al ions of the 5 different cathode materials, time-integrated over the full pulse duration and compared to the non-time-resolved data automatically collected by the MEA software.
Download figure:
Standard image High-resolution image3.4. Ion velocity distributions
To take ion masses into account, it is useful to switch from kinetic energies to velocities. The velocity distributions have been calculated using equation (3), where Ek stands for the kinetic energy of the ion and m for the ion mass:

Such velocity distributions of the stable phase only (integrated from 300 to 500 μs) are shown in figure 8, using the same color-code for the various cathode materials as in figure 7. The maxima of the velocity distributions at a time of 300 μs at the MEA orifice are listed in table 4 for all cathode compositions and charge states.
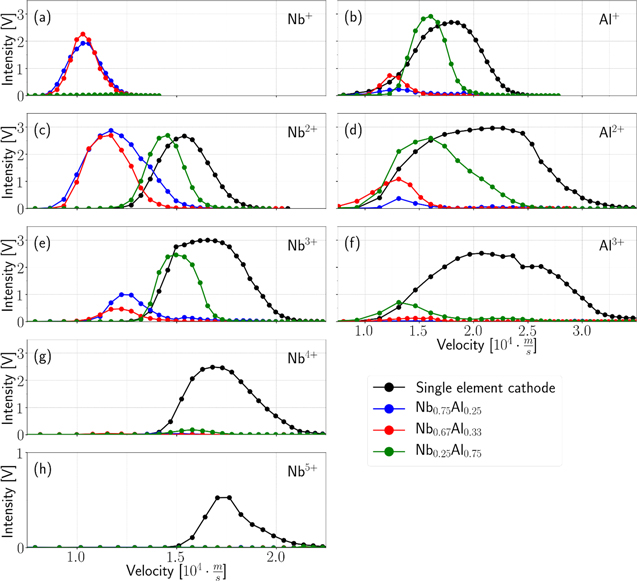
Figure 8. Velocity distributions for Nb and Al ions (columns) time-integrated from 300 to 500 μs for various ion charge states (rows) and cathode materials (colors).
Download figure:
Standard image High-resolution imageTable 4. Maxima of ion velocity distributions at the MEA orifice at two different times (t1 = 30 μs, t2 = 300 μs), for various charge states of the Nb and Al ions, and for various cathode compositions.
Maxima of ion velocity distributions ![$[{10}^{4}\cdot {\rm{m}}{{\rm{s}}}^{-1}]$](https://content.cld.iop.org/journals/0963-0252/27/5/055007/revision2/psstaabdc7ieqn20.gif)
|
|||||||||
|---|---|---|---|---|---|---|---|---|---|
| Nb+ | Nb2+ | Nb3+ | Nb4+ | Nb5+ | Al+ | Al2+ | Al3+ | ||
| t1 | Nb | 1.69 | 1.77 | 1.82 | 1.93 | ||||
| Nb75Al25 | 1.14 | 1.41 | 1.50 | 1.73 | 1.60 | 2.36 | 2.27 | ||
| Nb67Al33 | 1.20 | 1.37 | 1.46 | 1.63 | 1.60 | 2.36 | |||
| Nb25Al75 | 1.58 | 1.62 | 1.68 | 1.73 | 1.97 | 2.54 | |||
| Al | 1.85 | 2.36 | 2.62 | ||||||
| t2 | Nb | 1.54 | 1.66 | 1.73 | 1.77 | ||||
| Nb75Al25 | 1.03 | 1.17 | 1.27 | 1.41 | 1.23 | 1.31 | 1.60 | ||
| Nb67Al33 | 1.03 | 1.17 | 1.22 | 1.15 | 1.23 | 1.31 | 1.31 | ||
| Nb25Al75 | 1.46 | 1.50 | 1.58 | 1.60 | 1.60 | 1.31 | |||
| Al | 1.79 | 2.27 | 2.17 | ||||||
The time dependencies of phase 1 are outlined in figure 9, where exemplary velocity distributions of selected Nb and Al ion species are shown for Nb, Al, Nb75Al25 and Nb25Al75 cathodes at different times. The maxima at 30 μs have been included in table 4. These results represent the situation at the MEA orifice; the times shown are times after triggering, regardless of ion charge or element.
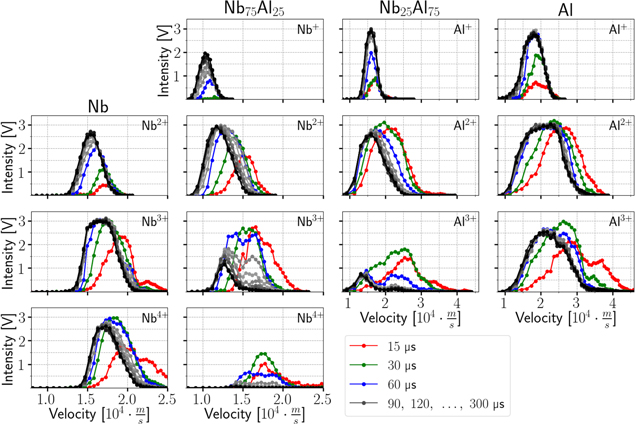
Figure 9. Time dependencies of ion velocity distributions for several exemplary ion charge states and cathode materials. The colors indicate different times after triggering.
Download figure:
Standard image High-resolution image3.5. Ion charge state distributions
To provide a more detailed view of the charge distributions for different times and cathode compositions, the time evolution of the charge state fractions is shown in figure 10. It shows the energy-integrated intensities of Nb (a-d) and Al ions (e-h) of a specific charge state (color) divided by the sum of the energy-integrated intensities of all charge states of the corresponding ions. Additionally, the average charge state is plotted in black. These plots have been created for all five cathode materials; the results at 30 and 300 μs are also stated in table 5. A comparison with literature data for single-element cathodes is provided in table 6. The general approach is expressed quantitatively in equation (4), for either Al or Nb ions, where fi(t) stands for the fraction of charge state i,  for the average charge state and Ii(t) for the intensity of the ions of charge state i:

Figure 10. Time evolution of charge state fractions of Al and Nb ions depending on cathode material.
Download figure:
Standard image High-resolution imageTable 5.
Average charge states ( ) and charge state fractions (f) at two different times after triggering (t1 = 30 μs, t2 = 300 μs) for Nb and Al ions, depending on cathode composition.
| Nb ions | Al ions | ||||||||||
|---|---|---|---|---|---|---|---|---|---|---|---|

|
f+ | f2+ | f3+ | f4+ | f5+ |

|
f+ | f2+ | f3+ | ||
| t1 | Nb | 3.6 | 0.00 | 0.07 | 0.38 | 0.44 | 0.10 | ||||
| Nb75Al25 | 2.9 | 0.00 | 0.32 | 0.44 | 0.23 | 0.00 | 2.5 | 0.05 | 0.42 | 0.53 | |
| Nb67Al33 | 2.8 | 0.00 | 0.33 | 0.49 | 0.18 | 0.00 | 2.9 | 0.00 | 0.09 | 0.91 | |
| Nb25Al75 | 2.6 | 0.00 | 0.40 | 0.57 | 0.03 | 0.00 | 2.4 | 0.04 | 0.55 | 0.41 | |
| Al | 2.4 | 0.09 | 0.44 | 0.47 | |||||||
| t2 | Nb | 3.2 | 0.00 | 0.22 | 0.40 | 0.33 | 0.05 | ||||
| Nb75Al25 | 2.0 | 0.20 | 0.64 | 0.16 | 0.00 | 0.00 | 1.6 | 0.40 | 0.60 | 0.00 | |
| Nb67Al33 | 1.9 | 0.26 | 0.63 | 0.11 | 0.00 | 0.00 | 1.9 | 0.25 | 0.64 | 0.11 | |
| Nb25Al75 | 2.6 | 0.00 | 0.48 | 0.48 | 0.04 | 0.00 | 1.8 | 0.30 | 0.59 | 0.11 | |
| Al | 2.2 | 0.18 | 0.43 | 0.39 | |||||||
Table 6.
Average charge states ( ) and charge state fractions (f) at time t after triggering, for Nb and Al ions of single-element Nb and Al cathodes compared to literature data. Reference [31] shows experimental results, while [32] shows theoretical distributions based on the 'freezing model'. The fraction for Al3+ at 150 μs in [31] is 0.11 (and not 0.00 as printed in the original publication).
| t [μs] |

|

|
f+ | f2+ | f3+ | f4+ | f5+ | ||
|---|---|---|---|---|---|---|---|---|---|
| Nb | 150 | 3.3 | 0.00 | 0.20 | 0.40 | 0.35 | 0.05 | This work. | |
| Al | 150 | 2.2 | 0.18 | 0.44 | 0.38 | This work. | |||
| Nb | 3 | 4.3 | 0.00 | 0.00 | 0.14 | 0.40 | 0.46 | [31] | |
| Nb | 150 | 3.0 | 0.01 | 0.24 | 0.51 | 0.22 | 0.02 | [31] | |
| Nb | 3.0 | 0.01 | 0.19 | 0.59 | 0.19 | 0.02 | [32] | ||
| Al | 3 | 2.7 | 0.03 | 0.27 | 0.70 | [31] | |||
| Al | 150 | 1.7 | 0.38 | 0.51 | 0.11 | [31] | |||
| Al | 1.7 | 0.36 | 0.54 | 0.10 | [32] |
Figure 11 shows another representation of the average charge states, which also includes their energy dependence. Because the energy scale decreases with increasing charge state, an interpolation was necessary to be able to sum up the intensity matrices for this plot. The data were interpolated linearly using an energy step size of 1 eV. In addition, intensities below 0.1 V were disregarded in this figure.
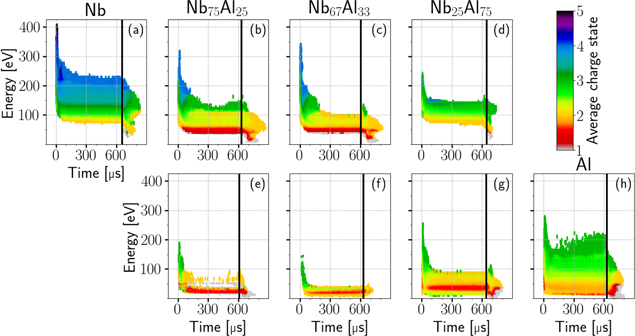
Figure 11. Average charge states (color) of Nb (a-d) and Al ions (e-h), depending on their kinetic energy, the time after triggering the plasma pulse, and the cathode material (columns).
Download figure:
Standard image High-resolution image4. Discussion
4.1. Time dependence of arc plasma properties
4.1.1. Decay of average charge states
Galvin et al [13] analyzed the charge states of pulsed arcs of several single-element cathodes in the first 250 μs by measuring ion flight times to a detector. For a Ta cathode, their results show a very similar characteristic compared to the pure Nb cathode in figure 10(a), which can be understood by the proximity of these two elements in the Periodic Table, e.g. in their electron configuration. At that time, they argued that the high initial voltage in the first ≈25 μs (compare to figure 3(b)) and current fluctuations cannot solely explain the observed changes in charge states. Current fluctuations can have a minor effect on charge states [33, 34], due to changes in the electrical power input related to electron temperatures in the plasma [35] and thereby to the observed charge states. Such effects might also affect the present results, because of the not precisely 'rectangular' current pulse shape and fluctuations in power (see figure 3(a)). However, today it is widely accepted that charge exchange collisions with neutrals play the most important role in explaining these characteristics [36].
The cross sections of ion−atom collisions generally depend on the relative velocity between the colliding particles, ion charge, the number of electrons in the system and the potential energy difference (ΔE) of the initial and final states of the collision system [37]. Equation (5) shows the basic form of such a reaction, where Q is the initial charge state of element A, c is the number of collected electrons and B is the initially neutral collision target:

The commonly measured ion velocities in cathodic arcs are much lower than mean velocities of outer electrons in Bohr's model ( ), which classifies them as slow collisions [38, section 64]. For these low energies, the cross section mainly depends on ΔE and 'the structure of the transient quasi molecule formed during the collision' [38, p. 943]. Resonant and near-resonant charge exchange (ΔE ≈ 0) are most common [12], although they are elastic collisions and do not change the average charge state. For multiply charged ions at these velocities, the cross sections for inelastic collisions with neutrals can be appreciable, provided ΔE > 0 [12, 38]. For multi-electron atom targets, like in the present case, multi-electron capture (c > 1) and transfer ionization can show considerable cross sections at these energy ranges [37, 39]. The superposition of these mechanisms leads to the observed significant reduction of average charge states over several hundred microseconds seen in figure 10.
This reduction of average charge states can be described by an exponential decay with a time constant depending on cathode material and power density [31]. For lighter elements, the neutral density in the plasma saturates faster. This 'characteristic filling time' can be approximated by the velocities of the neutrals and the length of the plasma stream [12]. Assuming the presence of Al neutrals with low energies as low as 1 eV in the present experiment (plasma stream of about 0.27 m) yields a filling time of about 100 μs. For Nb neutrals at 1 eV that time would be about 190 μs. The observed decay of average charge states of the Al cathode (figure 10(h)) fully reaches steady state at about 90 μs, while the decay for the Nb cathode (figure 10(a)) extends to about 200 μs, which suggests the presence of these slow neutrals.
In the same publication [31], the average charge states and charge state fractions of different single-element cathodes for pulsed cathodic arcs at 3 and 150 μs after triggering were tabulated. This was realized by TOF measurements of ions coming from 300 A, 2 Hz arc pulses. At 3 μs into the pulse, the discharge is in a so-called spark phase, which shows higher power input (compare to figure 3(a)), leads to a higher electron temperature and therefore produces higher charge states. Those experimental results showed that high charge states dominate (Al3+, Nb4+, Nb5+) and lower charge states like Al+, Nb+ and Nb2+ are not detected at such early times. In contrast, the distributions at 150 μs show much lower charge states. When comparing the 150 μs distributions with the present results at 150 μs, Nb shows slightly higher, and Al notably higher average charge states (table 6), which indicates a generally higher power input and electron temperature related to the present experimental setup. This is also apparent in the relatively high absolute voltages listed in table 3 when compared to literature data. Differences in chamber geometry can also lead to disparities of average charge state, as the former influences the presence of neutrals [10]. The chamber used in the referenced experiment was much smaller compared to the current one. The resulting faster decay of average charge states could also explain the lower values at 150 μs.
Another reason for these elevated average charge states is the pulse repetition rate. A higher repetition rate will increase the metal particle fraction in the plasma, because there is less time for the cathode surface to be contaminated by non-metal species like water and other adsorbates [40]. This has direct consequences on the average charge states, which are substantially increasing with repetition rate. For Al and Ta cathodes at a base pressure of 4 × 10⁻⁵ Pa, Yushkov and Anders [40] showed an increase in the magnitude of average charge state between 0.1 Hz and 10 Hz, which starts to saturate at about 1 Hz for Al. Consequently, DC arcs show lower charge states compared to pulsed arcs [14, 41, 42].
Due to the experimental setup, the results in figure 10 cannot provide direct information on charge states at times earlier than the ion flight time from cathode to orifice. It is likely that the occurring maxima of average charge states only indicate this experimental barrier and the average charge states can be extrapolated to even higher values before that time. This would also mean that the initial fractions shown in figure 10 are already shifted to lower charge states by charge exchange processes. The later detected lower charge states, in particular one and twofold, seem to be mainly the product of charge exchange collisions initiated by higher charged ions. This behavior can also be observed in figure 11, where the initial phase shows a transition to lower average charge states and lower energies. Additionally, figure 6 shows different behaviors when comparing the time of first significant detections with the hypothetical collision-less time of flight of ions from the cathode to the MEA orifice corresponding to their detection energy. While the maximum charge states (Al3+, Nb5+) match this time to some extent, the intermediate ones (Al2+, Nb2+ to Nb4+) show much earlier detections, especially for composite cathodes. This suggests that for these early detections, the initial ions from the cathode were much faster and possibly experienced charge exchange collisions before detection. Other elements with lower masses and a similar mass-to-charge ratio could also make a contribution. Although there is no direct overlap of mass-to-charge ratio among the most common species present in high vacuum, it is known that for the experimental setup used here, ratios in a range up to ±0.5 can still lead to detections (but with decreasing intensity). Oxygen, hydrogen, nitrogen, carbon and their compounds, which are primarily desorbed from the cathode surface in the initial phase of the pulse, are potential candidates for such perturbations.
4.1.2. Effects on velocity distributions
Various experiments have shown that the peaks in the ion velocity distributions of vacuum arcs in high vacuum seem to be independent of charge state—and for composite cathodes, also independent of the ion mass of the composing elements [9, 23]. Recently, Krasov and Paperny [43] established a theoretical model for the expansion of multicomponent plasma jets into vacuum, which was tested on experimental literature data available for vacuum cathodic arcs [8, 21, 23, 44]. Based on ion−ion friction in the vicinity of the emission region, the model predicts an equalization of the velocities of ions with different mass and/or charge. However, it also proposes that this is only the case for certain emission conditions. For example, the relative directed flow velocities of the various components have to be below a threshold in the order of the thermal velocities of these flows. Larger relative velocities will remain experimentally observable with a magnitude of 10 to 15% of the average jet velocity, also farther away from the cathode. It has to be noted that in a basic model [6], ion properties in cathodic arcs are mainly formed in the dense high-pressure plasma at the cathode spots and 'frozen' into the low-density, expanded, non-equilibrium plasma.
For the present results, one has to be careful when taking this so-called 'velocity rule' into account. For one, the velocities are perturbed by the energy change in the sheath at the orifice. Furthermore, if the strong initial decay of average charge states is caused by inelastic collisions, they should also have an effect on the velocity distributions. In addition, the usually observed shape of the ion velocity distributions in cathodic arcs (a shifted Maxwellian distribution [8]) and its variations can make it difficult to assign distinct most likely velocities. Nevertheless, even without a plasma sheath correction, the assigned most likely velocities at 300 μs in figure 8 and table 4 for the various cathode materials show relatively small deviations (order of 15%), supporting the velocity rule and the ion−ion coupling model.
With some exceptions at higher charge states, a general increase of most likely velocity with charge is observable, which suggests an energy gain in the plasma sheath to the MEA orifice and therefore a positive plasma potential. The most notable exception to this tendency is the Nb25Al75 cathode, which shows a contradictory behavior in figure 8: decreasing most likely velocities with charge for Al ions at 300 μs. But the same cathode also reveals increasing most likely velocities with charge at earlier times (15 and 30 μs) in figure 9. Plasma potential measurements with practically the same experimental setup [22] showed a strongly increased plasma potential in this initial spark phase, which typically reaches a constant value after less than 50 μs. For a positive plasma potential, this would lead to an increased energy gain in the sheath, and thereby to higher ion velocities and higher ion velocity increases with charge at these early times. This is also superimposed on the results shown in figure 9 and table 4, and a reason for the higher deviations with charge of the most likely velocities at t1 (30 μs) in table 4.
However, regardless of these amplified sheath effects in the spark phase, the observation that the charge dependency of the most likely velocity changes fundamentally in the first 200 μs (from an increase to a decrease with charge) indicates the influence of inelastic collisions rather than ongoing plasma potential changes. The plasma potential depends mainly on the cathode material and experimental setup, and ongoing changes would also affect the measurements of Nb ions from the same cathode, which still shows slightly increasing most likely velocities in the steady-state distributions (300 μs). Similar effects can be observed from the other cathode materials. For example, the Nb3+ ions from the Nb75Al25 cathode, as well as the Nb4+ ions from the Nb67Al33 cathode, show unexpectedly low most likely velocities. The first case shows notable changes in velocity distributions up to 300 μs in figure 9, which are visible for lower charge states. That is also an indication for ion energy losses in inelastic collisions with neutrals. Furthermore, these intermediate distributions usually show two peaks, especially for the 3+ charge state, which could be caused by differences in ion source: fast unperturbed ions originating from the cathode, and slower ions from specific collisions initiated by higher charged ions.
4.2. Influence of cathode composition
The energy that must be added to the cathode 'to separate its components into neutral free atoms at rest, at infinite separation, with the same electronic configuration' [45, p. 49] is known as the cohesive energy and shows a linear relationship to the voltage needed for the arc to burn. This is generally referred to as the 'cohesive energy rule' [5]. It is related to the energy input per time and per eroded cathode material, which affects electron temperature and charge states in the plasma. Although the rule was introduced for single-element cathodes, the relation of cohesive energy to charge states has also been investigated for composite cathodes in [15–17]. Based on that, one would expect that compared to their single-element counterparts, the average charge states of Al ions coming from a composite Nb−Al cathode should increase, while the Nb ions' charge states should decrease. This expectation is not satisfied when looking at the steady-state average charge states at 300 μs of the Al ions in figure 10 and table 5. However, the initial maxima of the average charge states follow this behavior to some extent, although no linear decrease/increase related to the Nb/Al fraction is observable. Compared to the single-element cathodes, the composites show large differences in both initial and steady-state charge state fractions, which cannot be neglected when testing hypotheses related to the 'frozen' ion charge/energy distributions advancing from the cathode.
Based on the results shown, it is difficult to parse the main mechanisms causing the differences to single-element cathodes. The assumption, as suggested in [21], that hetero-element charge exchange reactions between Al and Nb ions/atoms are mainly responsible for the changes introduced by composite cathodes, is not substantive. A reduced electron temperature of the plasma from composite cathodes compared to Nb and the resulting lower initial ion charge states (see figure 12) alone could lead to a completely different evolution of charge states based on homo-element charge exchange. It is known that single-element cathodes can show quite different charge state time evolutions, depending on their electron configuration, cohesive energy and consequently the observed maximum charge states (for example Ta and Ti in [13]). A lower electron temperature is expected when introducing Al into an Nb cathode, and can explain the observed maximum charge states. Figure 12 displays a general overview of the ionization energies for Al and Nb atoms and ions up to a charge state of 4+. The ionization energies are arbitrarily related to calculated electron temperatures of pulsed arc plasmas from Nb (4.0 eV) and Al (3.1 eV) cathodes, reported in [32], and to weighted averages of these electron temperatures for the different Nb-Al compositions (3.8, 3.7 and 3.3 eV).

Figure 12. Ionization energies for Al and Nb atoms and ions up to a charge state of 4+, arbitrarily related to calculated electron temperatures of pulsed arc plasmas from Nb (4.0 eV) and Al (3.1 eV) cathodes, and to weighted averages of these electron temperatures for the various Nb−Al compositions. The ionization energies were taken from section 10 in [28]; the graph was adapted from [17].
Download figure:
Standard image High-resolution image
All corresponding charge states below a dashed line were observed with significant intensity.
Realistically, both effects play roles, and the time evolution of charge state fractions in figure 10 visualizes a superposition of several reactions with appreciable cross sections, including homo/hetero-element, elastic/inelastic, single/multiple electron capture charge exchange. Therefore, it is difficult to explicitly assign sets of charge exchange reactions which fully explain the observations. In principle, the time dependent ion count N(t) for a specific element and charge state which actually reaches the detector is caused by ions coming from the cathode spot region n0(t), together with those created by charge exchange collisions further away from the cathode spot n(t):

Because of the superposition of all reactions, the time evolution can only provide partial and indirect information about these charge exchange reactions. There is also a bias due to other effects, for example, the angular distribution of ion species. Nikolaev et al [46] found that for composite cathodes composed of a light and a heavy element, the lighter element can have a substantially lower occurrence on the ion source axis compared to off-axis angles. For a Zn0.4Pb0.6 cathode using a spherical grid as anode, about 20% fewer Zn ions were detected on-axis. The authors also reported fewer single charged ions on-axis than off-axis for several single-element and composite cathodes. In the present work, the composites investigated include a light (Al) and heavy element (Nb) with a mass ratio of about 1/3.4 (for comparison, the mass ratio of Zn/Pb is 1/3.2), and the ions were extracted on-axis only. Although anode geometry and mass difference are not identical, a similar angular dependence would explain the higher Nb fraction of detected ions compared to the cathode composition, which is of the same magnitude (see section 3.2). Also, an additional underrepresentation of single charged ions could be visible in the ion fractions shown. These points could also explain why simply applying the most likely reactions based on theoretical cross sections does not provide a full explanation for the time evolutions shown in figure 10. Specific aspects which do not really fit into this picture include the observations that Nb+ ions are only detected in the Nb-rich composites and not for the Nb cathode, the reproducible low but constant fraction of Nb4+ ions in the Al-rich case, and the generally symmetric rise/fall of Nb2+ and Nb4+ ions.
When discussing the basic material dependencies, there are two different behaviors: one for the two Nb-rich composites, the other for the Al-rich composite. This is noteable in the charge state distributions (figures 10 and 11) and in the energy and velocity distributions (figures 7 and 8), as well as in the measured voltages in table 3. Comparing the composites only, the relatively constant behavior for the Nb ions in the Al-rich composition (figure 10(d)) indicates that there is much less charge exchange for Nb ions compared to the other two compositions. Since there are less Nb ions (and presumably also less Nb neutrals) available in the plasma (see section 3.2) and the Al ions show a similar characteristic compared to the other compositions, it generally emphasizes homo-element charge exchange. According to the Cohesive Energy Rule, the lower voltages of this Al-rich composition could be connected to lower electron temperatures and lower initial charge states. The generally lower velocity distributions for composites and the differences between them visible in figure 8 are already present in the beginning of the pulse and are not mainly caused by inelastic collisions at later times. The observation that the Al-rich composition shows generally higher velocities compared to the Nb-rich composition while also showing lower voltages suggests that the power input and electron temperature are not solely responsible. Near-cathode processes not accessible in the experimental setup used could be causing these differences—for example, collisions or ion−ion coupling [43].
It is likely that, additionally to the plain Nb−Al ratio, differences in erosion and macroparticle density/size also affect the results. Every cathode material used showed a different erosion behavior (see figure 2). Macroparticles and their remains were visually observable during/after the measurements for all of the cathode materials. Fluctuations in erosion rates could be a reason for higher relative velocities between the various ion compounds at the cathode spots [43], which can lead to a decreased equalization of the measurable velocities, as discussed in section 4.1.2. An influence on average charge states is also likely, because an increased size and number of neutral particles incorporated in the plasma will provide more surface for evaporation of atoms, which possibly increases neutral density and decreases the characteristic filling time.
5. Conclusions
The results demonstrate that ion properties in pulsed cathodic arc plasmas from Nb−Al composite cathodes are quite different from those from their single-element counterparts. They deviate from a simple linear interpolation and experience significant changes in time.
A strong shift from high to low ion charge states in the initial phase of the plasma pulses is generally observed, and can be explained by a multitude of charge exchange reactions with slow Al and Nb neutrals. Due to its heavy dependence on the cathode material, the correspondence of average charge states to the Cohesive Energy Rule can only be seen at early stages of the pulses. Ion energy and velocity distributions are also affected by this behavior, which alters the most likely ion velocities at later stages of the pulse. However, the peaks of the ion velocity distributions still have relatively small deviations with respect to charge state and element (in the order of 15%), supporting the velocity rule, the ion−ion coupling model and the theory of a gas-dynamic plasma expansion.
In comparison to single-element cathodes, the composite cathodes show decreased ion velocity distributions, especially for the Nb-rich compositions. Compared to these Nb-rich composites, the Al-rich composite shows a lower power input, but higher ion velocities. In combination with the observation that these differences in ion velocity distribution are already present initially, it is concluded that not only different electron temperatures in the cathode spot plasma but also processes taking place at earlier times, not accessible in the experimental setup used here, are responsible. The measured time-resolved ion properties in pulsed cathodic arc plasmas from Nb−Al composite cathodes can guide further experiments in the quest to fully understand the factors that influence the cathodic arc plasma from composite or multi-element cathodes.
Acknowledgments
This work was supported by the Austrian Science Fund (FWF, Project No. P 27867-N36). Work at LBNL was supported by the U.S. Department of Energy under Contract No. DE-AC02-05CH11231. The detailed insights in the cathode fabrication process provided by Plansee Composite Materials in Lechbruck, Germany, the technical support by Joseph Wallig at LBNL and the correspondence with Koichi Tanaka are gratefully acknowledged.