

Abstract
Mechanical properties of polymer nanocomposites depend primarily on nanointerphases as transitional zones between nanoparticles and surrounding matrices. Due to the difficulty in the quantitative characterisation of nanointerphases, previous literature generally deemed such interphases as one-dimensional uniform zones around nanoparticles by assumption for analytical or theoretical modelling. We hereby have demonstrated for the first time direct three-dimensional topography and physical measurement of nanophase mechanical properties between nanodiameter bamboo charcoals (NBCs) and poly (vinyl alcohol) (PVA) in polymer nanocomposites. Topographical features, nanomechanical properties and dimensions of nanointerphases were systematically determined via peak force quantitative nanomechanical tapping mode. Significantly different mechanical properties of nanointerphases were revealed as opposed to those of individual NBCs and PVA matrices. Non-uniform irregular three-dimensional structures and shapes of nanointerphases are manifested around individual NBCs, which can be greatly influenced by nanoparticle size and roughness, and nanoparticle dispersion and distribution. Elastic moduli of nanointerphases were experimentally determined in range from 25.32 ± 3.4 to 66.3 ± 3.2 GPa. Additionally, it is clearly shown that the interphase modulus strongly depends on interphase surface area and interphase volume. Different NBC distribution patterns from fully to partially embedded nanoparticles are proven to yield a remarkable reduction in elastic moduli of nanointerphases.
Export citation and abstract BibTeX RIS
1. Introduction
In a nanocomposite system, mechanical reinforcement is based on a fundamental concept that the chain mobility of soft matrices is constrained by much stiffer nanoparticles [1]. As a consequence, an effective load transfer occurs from matrices to fillers such as nanoparticles to carry a disproportionally high fraction of applied loads, thus leading to an increase in load resistance [1]. This phenomenon is well known to be associated with the level of interfacial bonding between nanoparticles and polymer matrices in terms of interphase existence, dimensions, structures and compositions [2]. Hence, crack initiation or propagation may take place in a nanocomposite system, resulting from the lack of effective load transfer owing to the weak interfacial bonding.
Interfaces are described as a material boundary between two or more phases with distinct chemical/physical properties and morphological structures. Furthermore, a material volume influenced by the interfacial interaction can be named 'interphase' [3, 4]. Interphase regions start from the interfacial boundary of nanofillers with different properties from those of bulk nanofillers and end where they are in connection with polymer matrices whose properties also vary from bulk matrices [4–6]. The material performance of nanocomposites is primarily impacted by the interphase regions where structural and chemical changes such as crosslinking density and crystalline phases result in a major alteration to composite bulk properties [3]. It is also worth mentioning that the alteration in the mobility of polymeric chains plays an important role in mechanical and dielectric properties of nanocomposites [7]. Due to large interfacial-area-to-volume ratios in nanocomposites, interfacial regions consist of a significant portion of bulk nanocomposites. For instance, with the addition of 5 vol% monodispersed spherical nanoparticles (particle diameter of 10 nm and interphase thickness of 0.5 nm), the volume fraction of interphases could be as high as 25 vol% [7]. More impressively, when particle diameter was reduced to less than 5 nm, the interphase volume fraction was increased by over 50 vol% as compared to that of particles [7]. The characterisation of existing interphases and their associated properties is often difficult to undertake as interphases for nanocomposites are generally on a nanoscaled level, and thus researchers have had to make most experimental efforts in an uncrosslinked state as the indirect evidence [8–10]. For example, chain mobility near interphase regions can be less than those of polymer matrices in a nanocomposite system [9, 10]. As a result, Litvinov and Steeman [11] employed proton, low resolution T2 nuclear magnetic resonance relaxation technique to detect existing interphases between ethylene propylene dine monomers (EPDMs) and carbon blacks. It is indicative of a significant difference in the chain mobility of EPDMs near carbon black surfaces at which the generated layer sizes of immobilised EPDMs were estimated in range of 1–2 diameters of the monomer unit [11]. Pompe and Mäder [12] identified interphases according to differential scanning calorimetry (DSC) in polypropylene/glass fibre composites, which, however, was limited to semicrystalline polymers as matrices in composite materials with only high glass fibre contents. Brown et al [13] studied a relationship between nanoparticle diameter and interphase thickness based on molecular dynamic (MD) simulations, which implied that the interphase thickness appeared to be relatively insensitive to nanoparticle diameters and contents. Li et al [14] reported that the volume fraction of interphases could be size-independent by using a modified hierarchical multi-interphase model. However, the interphase thickness might be influenced by the reinforcing efficiency of nanoparticles when their lengths were over 40 nm. On the contrary, Gu et al [15] and other co-workers [16, 17] inferred that the interphase thickness could be non-constant in nanocomposites systems. So far, nanointerphase properties and features have not been explicitly quantified in a systematic manner by means of direct topography of nanomechanical characterisation. As a matter of fact, nanomechanical techniques using tip-sample interactions such as atomic force microscopy (AFM) [18, 19], nanoindentation and nanoscratch tests [20–22] are vital as effective and relatively straightforward approaches to determine nanomechanical properties of interphases. In addition, interphase dimensions and sizes can be clearly specified due to their distinct mechanical properties from those of bulk materials. The interphase width of glass fibres coated with coupling agents was previously revealed to be around several microns [8, 20, 23]. Nonetheless, a quantitative analysis of interphase dimensions associated with nanomechanical properties still undergoes limited lateral resolutions and positioning capability of indenter probe used in nanoindentation, and nanoscratch techniques. In particular, interphase regions of thermosetting polymer/glass fibre composites are much thinner than those of individual fibre and matrix components [22, 24, 25]. Plastic deformation usually takes place under a high fraction of applied load, thus resulting in an increase in the minimum allowable distance between two indentation spots, as well as the reduction of lateral resolutions of such tests [8, 24, 25]. The peak force quantitative nanomechanical mapping becomes a relatively new and powerful technique to quantitatively measure nanomechanical properties of materials such as stiffness and adhesion of nanocomposites along with corresponding acquired dimensions [26–30]. This technique greatly supports the measurement of material elastic properties based on tip-sample force curves and acquisition of topographic images simultaneously. Moreover, other critical properties, consisting of tip-surface adhesion and surface deformation, can also be obtained by avoiding the difficulty associated with lateral forces. Such a technique is believed not only to sophisticatedly distinguish between nanofillers, nanointerphases and polymer matrices, but also to accurately quantify dimensions and nanomechanical properties of interphases.
The increasing interest in bionanocomposites becomes more pronounced after great concerns of environmental issues are raised associated with the applications and manufacture of conventionally synthetic nanocomposites [1, 31]. In particular, PVA is a typical water-soluble biopolymer with excellent flexibility [32], biocompatibility and biodegradability [32, 33] as well as recyclability and biotribological properties [34]. On the other hand, NBCs are effective carbon-based nanofillers due to their extraordinary material features such as high surface areas and high absorption ability (i.e. about 8-fold that of normal charcoals), ecofriendliness when compared with carbon nanotubes (CNTs) [1], and better particle dispersibility as opposed to that of graphene nanosheets [35].
Nanomechcanical properties of PVA and PVA nanocomposites are completely different from those of their bulk material counterparts. It is worth noting that average elastic modulus of bulk PVA films is approximately 2.08 GPa at a macroscopic level [36], which is far smaller in magnitude when compared with that of local nanophases for PVA blended with 10 wt% poly(acrylic acid) (PAA) at 9.9 GPa [37]. Moreover, in case of PVA-PAA based nanocomposites reinforced with 10 wt% cellulose nanocrystals (CNCs) [37], their average elastic modulus in the interphase was found to vary from 12.8 GPa at the CNC interface to 9.9 GPa in PVA-PPA matrices. On the contrary, PVA nanocomposites reinforced with 10 wt% CNCs demonstrated the highest elastic modulus of only 1.9 GPa in their bulk properties [38]. This modulus variation phenomenon between nanomechanical properties and bulk properties is not limited to PVA alone, but can be applied to different polymers or composites. For instance, the storage modulus of epoxy was measured to be 17 GPa via nanomechanical measurement as opposed to 3–4 GPa for their bulk composites obtained by tensile tests [15]. Moreover, elastic modulus of bulk poly (ether sulfone) (PESU) membrane substrates was detected to be only 151.7 ± 7.9 MPa [39] when compared to 3.2 ± 0.3 GPa for PESU films at a nanoscaled level [40].
As mentioned earlier, the major drawback in previous literatures depended on the assumption of the interphase as homogeneous layers formed around nanoparticles with uniform thickness. The utilisation of such a simplified concept in theoretical modelling according to Mori–Tanaka model [41] and Maxwell model [42] has led to little success in order to accurately predict mechanical properties of nanocomposites. In this study, 3D nanointerphase topography and characterisation have been demonstrated for the first time when embedded with anisotropic NBCs in PVA/NBC nanocomposites. The actual measurement of nanointerphase dimensions and properties is pivotal to evaluate the interaction level between NBCs and PVA matrices in such nanocomposites. Relevant results are particularly important for better estimation of nanocomposite properties based on real nanointerphase features in terms of volume fraction and surface area [43].
2. Materials and methods
2.1. Materials and film fabrication
PVA biopolymer (material type: MFCD00081922) with average molecular weight Mw = 89 000–98 000 g mol−1 and a degree of hydrolysis over 99% was purchased from Sigma Aldrich Pty. Ltd, Australia. Highly bioactive NBC particles (particle diameter: <100 nm) in disk-like shape was supplied by US Research Nanomaterials, Inc. Co., USA with the surface area of 624.81 m 2 g −1 and pore area of 415 m2 g−1 [36].
PVA/NBC nanocomposite films were fabricated by simple solution casting. Initially, 5 wt%/v PVA aqueous solution was prepared by mixing 10 g PVA with 190 ml deionised water using a vigorous magnetic stirrer at 400 rpm and 90 °C for 3 h until PVA was completely dissolved to prepare the stock solution. Aqueous suspensions of NBCs were obtained using mechanical mixing in deionised water with a rotor speed of 405 rpm at 40 °C for 2 h. Afterwards such a mixture underwent the ultrasonication (Model ELMA Ti–H–5) at 25 kHz and 40 °C with a power intensity of 70% for 1 h in order to break up aggregated particles and evenly disperse NBCs in deionised water. NBC loadings of 0, 3, 5 and 10 wt% were then achieved by adding appropriate amounts of PVA. NBC aqueous suspensions were gradually added in a dropwise manner into PVA solutions, simultaneously subjected to mechanical mixing at 405 rpm and 40 °C for 2 h. Then their mixtures were stirred at 400 rpm and 90 °C for 1 h prior to further sonication for 30 min to achieve uniform NBC dispersion. Prepared 20 ml solution was then cast on a glass petri dish, and was solidified and dried in an air-circulating oven at 40 °C for 48 h. Finally, prepared films were peeled off and transferred to a silica gel-contained desiccator for material storage before any following testing and analysis.
2.2. Characterisation method
Nanomechanical properties of PVA/NBC nanocomposites were quantatively assessed via AFM in a peak force quantitative nanomechanical tapping mode (PFQNM) for this study [44, 45]. This new technique enables to measure nanomechanical properties such as elastic modulus and adhesion force of nanocomposite films (supporting information with more detail is available online at stacks.iop.org/NANO/29/385701/mmedia) [45–48].
In this study, a Bruker Dimension Fastscan AFM system was employed to measure peak force quantitative nanomechanical properties and acquire single force–distance curve under the ambient condition. Moreover, RTESPA 525 A probes, with a nominal spring constant of 200 N m−1, a nominal tip radius of 8 nm and a nominal resonant frequency of 525 kHz, were utilised for the direct measurement of correponding nanomechanical properties. Before each measurment, it was confirmed that the deflection sensitivity was calibrated by obtaining a force curve based on the stiff sapphire-12 surface. Later on, a thermal tuning method [44] was employed to determine the spring constant (see supporting information for more details) [44, 49, 50]. AFM imaging analysis was undertaken with the TESPA probe at the nominal spring constant of 40 N m−1 and tip radius of 8 nm. The image scan rate was kept at 2 Hz with 256 × 256 digital pixel resolution. AFM topographic images were first-order flattened via Flatten command in Burker Nanoscope 1.5 software, which was used to remove unwanted features resulting from the vertical (Z) scanner such as noise, bow and tilt.
2.3. Modelling approach
2.3.1. Interphase modulus
The elastic properties of interphases such as the interphase modulus between PVA matrices and dispersed anisotropic NBCs in various shapes and sizes were determined according to a data set of elastic moduli collected based on PVA/NBC interphases surrounding 75 different NBCs at 25 line scan regions (LSRs).
2.3.2. Interphase dimensions
Interphase dimensions in terms of interphase width WInterphase, interphase length LInterphase and interphase height HInterphase by scanning individual PVA/NBC phases using PFQNM with typical features to distinguish interphases between nanoparticles and polymer matrices based on the great variation of their nanomechanical properties. For instance, WiInterphase was detected by scanning along the ith transverse plane (i = 1, 2, 3...) for PVA/NBC phases. The same procedure was reapplied to determine LjInterphase and HkInterphase along the jth longitudinal plane (j = 1, 2, 3...) and kth height plane (k = 1, 2, 3...), respectively for the phase scanning (refer to supporting information for more details).
In this model, it has been assumed that uniform NBC dispersion takes place with two typical categories of complete embedded and partially embedded NBCs within PVA matrices, as illustrated in figures 1(a) and (b), respectively. It is clearly demonstrated that the interphase is surrounding between inner interface area and outer interface area bound by NBCs and PVA matrices, respectively. By rearranging analytical equations according to Behmer and Hawkins [51] used for calculating the surface area of anisotropic shape, we have derived the following equations (1)–(4) for determining both surface areas of outer interface (SAouter Interface) and inner interface (SAinner Interface) of a wide range of fully and partially embedded NBCs. It is noted that subscripts of 'f' and 'p' mean fully and partially embedded NBCs, respectively.

where L'Interphase-effective, W'Interphase-effective and H'Interphase-effective represent the maximum length, width and thickness for effective interphases. L'NBC-effective, W'NBC-effective and H'NBC-effective represent the maximum length, width and thickness for effective NBCs. a1, b1, c1, d1, a2, b2, c2, d2, a3, b3, c3, d3 and a4, b4, c4, d4 are constants determined using curving fitting. For instance, the constants of a1, b1, c1 and d1 were determined to be 0.7439, 0.3627, 0.7006, and 0.9979, respectively, by fitting formula in equation (1) with the measurement of surface area (SAouter Interface)f [52, 53] obtained from the AFM (see more details in supporting information).
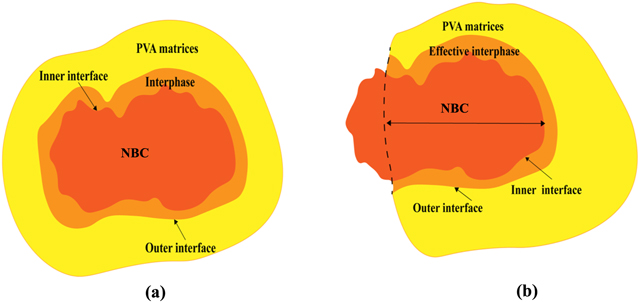
Figure 1. Schematic diagrams of (a) single fully embedded NBC and (b) single partially embedded NBC with particle-matrix interactions.
Download figure:
Standard image High-resolution imageAfter acquiring surface area data, the result were employed in detecting interphase/NBC volume VNBC/Interphase and NBC volume VNBC with respect to fully and partially embedded NBCs with modified equations being derived from Behmer and Hawkins [51] as below:


e1, f1, e2, f2, e3, f3, e4 and f4 are constants determined using curving fitting. For example, the constants of e1, f1 were estimated to be 0.3824 and 0.3825, respectively by fitting equation (5) with the value of VNBC/Interphase obtained from the AFM measurement (see supporting information for more details).
Final step is to determine interphase volume VInterphase for fully or partially embedded NBCs in PVA/NBC nanocomposites illustrated in figures 1(a) and (b) as follows:


3. Results
3.1. Modulus-gradient effect
As illustrated in figure 2(a), strong interactions between NBCs and PVA matrices appear to be not only on NBC surfaces like other nanoparticles such as CNTs, nanosillcas, etc, but also into entire NBC particles through the penetration of PVA molecules. Figures 2(b) and (c) demonstrate a typical topographical image of PVA/NBC nanocomposite sample and the variation of elastic moduli from PVA matrices, interphases to NBCs, respectively. According to a cut line A1B1 shown in figure 2(b), elastic modulus has significantly increased from the lowest modulus level of 14.8 GPa with respect to PVA matrices to the highest of 72.86 GPa for NBCs. In particular, the interphase exhibits a nearly linearly increasing relationship of its elastic modulus with scan distance except interphase boundary regions around PVA matrices and NBCs alone, which is in range from 17.1 GPa near PVA region to 64.9 GPa around NBCs with the measured interlayer thickness of 31.8 nm. Final interphase modulus was obtained from the solid black curve by best fitting discrete modulus data sets based on 25 representative LSRs in figure 2(d), which also applied to elastic moduli of NBCs and PVA matrices identified to be 78.4 ± 4.9 and 24.25± 4.2 GPa, respectively.
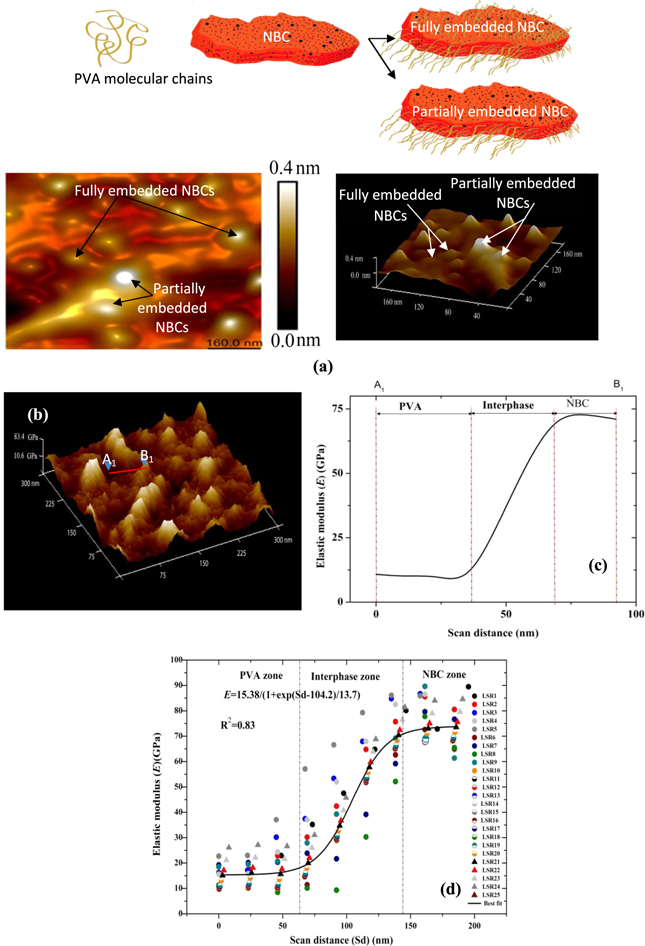
Figure 2. (a) Proposed scheme for typical PVA/NBC interaction, with fully and partially embedded NBCs (b) 3D AFM modulus mapping image of PVA/3 wt% NBC nanocomposites, (c) modulus profile for PVA/3 wt% NBC nanocomposites taken along the line A1B1, and (d) typical data sets of modulus profiles along 25 line scan regions (LSRs) of corresponding nanocomposites with the best-fit curve in which Sd represents scan distance.
Download figure:
Standard image High-resolution image3.2. 3D interphase dimensions and modulus
Elastic properties of interphases generally vary when surrounded by individual particles in different sizes and shapes, thus leading to the change of interphase dimensions. Interphase dimensions can be determined according to AFM height and adhesion images of PVA/NBC composite samples, depicted in figures 3(a) and (b), as well as 4(c) and (d), respectively. As evidently seen in figures 3(a) and (b), the height of NBCs is much greater than that of PVA with a linearly increasing tendency from interphase regions near PVA matrices to those close to NBCs. NBCs can be easily distinguished from PVA matrices owing to their different adhesion properties. It is clearly shown that the tip adhesion to PVA matrices of nanocomposite sample is 10.76 ± 3.42 nN, which is much greater than 2.1 ± 0.87 nN for NBCs. Accordingly, interphase thickness is represented by the scan distances of 16 and 13 nm with a sharp decreasing adhesion gradient from PVA matrices to NBCs on both sides of selected material regions, as illustrated in figure 3(d).

Figure 3. (a) 3D AFM height mapping image of PVA/3 wt% NBC nanocomposites, (b) height profile of corresponding nanocomposites taken along the line A2B2, (c) 3D AFM adhesion mapping image of PVA/3 wt% NBC nanocomposites, and (d) adhesion profile of corresponding nanocomposites taken along the line A2B2.
Download figure:
Standard image High-resolution imageInterphase width WInterphase, interphase length LInterphase and interphase height HInterphase were measured among individual NBCs with associated results being presented in figure 4(a). It is evidently shown that the LInterphase, WInterphase and HInterphase were measure to be 97, 40 and 8 nm, respectively. As seen from figures 4(b)–(e), despite the chaotic trend for interphase thickness (tInterphase), HInterphase tends to decrease in a linear manner with an increase in HNBC while LInterphase and WInterphase linearly increase with an increase in LNBC and WNBC, respectively.

Figure 4. (a) Maximum interphase dimensions along typical PVA/NBC interphases and relationships between NBC and interphase dimensions in PVA/NBC nanocomposites: (b) interphase thickness (tInterphase ) and NBC thickness (tNBC), (c) maximum interphase height (HInterphase-max) and NBC height (HNBC), (d) maximum interphase length (LInterphase-max) and NBC length (LNBC) as well as (e) maximum interphase width (WInterphase-max) and NBC width ( WNBC).
Download figure:
Standard image High-resolution imageA proposed mechanism model in terms of the effects of NBC dispersion and particle-matrix interaction is demonstrated in figures 5(a)–(e). It is identified in this study that there are two major NBC dispersion statuses within PVA matrices, namely uniform NBC dispersion and highly aggregated NBC dispersion in PVA/NBC nanocomposites. In the case of uniform NBC dispersion, two typical categories for the particle-matrix interaction can be addressed including completely embedded and partially embedded NBCs within PVA matrices, as shown in figures 1(a) and (b), respectively. The former yields more effective interphases surrounding each side of NBCs (i.e. full coverage of NBCs by the interphases), which is considered as a good representation for effective load transfer from matrices to nanoparticles. The latter offers less pronounced interphase effectiveness than the former since some remarkable portions of NBCs are free of contact with PVA matrices, leading to the reduction of more effective interfacial regions. Interphase volume VInterphase is regarded as an essential characteristic parameter to evaluate the effects of fully or partially embedded NBCs in PVA/NBC nanocomposites, which can be specified as (VInterphase)f and (VInterphase)p, respectively.
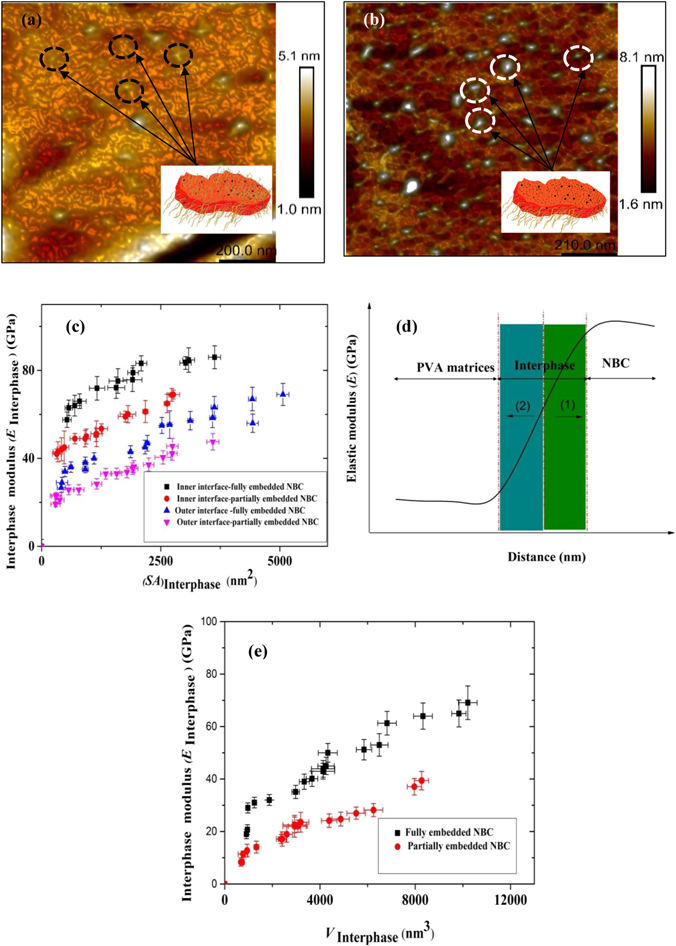
Figure 5. 2D AFM height mapping images of PVA/NBC nanocomposites: (a) fully embedded NBCs and (b) partially embedded NBCs, (c) relationship between interphase area (SAInterphase) and interphase modulus (EInterphase), (d) schematic diagram for two proposed interphase zones and (e) relationship between interphase volume (VInterphase) and interphase modulus (EInterphase).
Download figure:
Standard image High-resolution imageFigure 5(c) displays the interphase modulus EInterphase as a function of SAouter Interface and SAinner Interface in the case of fully and partially embedded NBCs within PVA matrices in PVA/NBC nanocomposites, respectively. It is clearly revealed that with increasing SAouter Interface and SAinner Interface, EInterphase is improved remarkably in a nonlinear manner accordingly. In particular, fully embedded NBCs yield consistently higher interphase modulus as opposed to partially embedded NBCs when either inner or outer interface is considered.
3.3. Particle debonding
When NBC loading increased up to 5 wt%, the interparticle spacing became smaller and NBCs tended to be jointly connected with neighbouring particles side by side, as presented in figure 6(a), in which some sides of each particle became contact-free with PVA matrices. Furthermore, a joint particle-to-particle formation may induce the phase separation leading to the scattering of load transfer from PVA matrices to NBCs, as evidenced by the particle overlap of NBCs in figure 6(b).

Figure 6. (a) Typical 3D AFM height mapping image of PVA/5 wt% NBC nanocomposites with different surface effects: (a) NBC joint edges and (b) NBC overlapping, (c) 2D height mapping image of PVA/10 wt% NBC nanocomposites for phase separation and (d) modulus profile of PVA/10 wt% NBC nanocomposites taken along the line A3B3.
Download figure:
Standard image High-resolution image
At a high nanoparticle loading of 10 wt%, NBC aggregation appeared to be manifested with a sign of large stacked-up NBC aggregates, depicted in figure 6(c). As such, the particle-to-particle separation occurred more evidently with resulting weak interfacial bonding. Figure 6(d) reveals the modulus variation mapping on the surface cross-section of a line scan (i.e. the line between two ovals from A3 to B3) shown in figure 6(c), which highlights two narrow zones with a sharp decline in elastic modulus.
4. Discussion
The interphase could be considered as transitional zones with a typical modulus gradient from polymer matrices to reinforcements in order to achieve effective load transfer for the improvement of composite mechanical properties. Our result reveals the existence of interphase with excellent elastic properties in range from 25.32 ± 3.4 to 66.3 ± 3.2 GPa. Owing to highly porous structures of NBCs, it makes them quite different from other carbon based nanofillers, thus facilitating the generation of highly positive capillary pressure to drive PVA molecular chains into NBC pores, and further forming typical chemical bonding in nanocomposites [54, 55]. These NBC pores also possess 'mechanical anchoring' mechanism [6] when interacting with PVA molecular chains, which means that a mechanical interlocking phenomenon takes place due to the existence of PVA molecular chains inside BC surfaces [6]. Moreover, gradient mechanical properties at the interphase zone from NBCs to PVA matrices could be associated with the number of hydrogen bonding from NBC surfaces to polymer matrices, which plays an important role in controlling mechanical properties of polymer nanocomposites [56, 57]. Nanoelastic behaviour of PVA demonstrates an elastic modulus of 24.25 ± 4.2 GPa in this study, which is close to the value of 23.69 GPa previously reported via the nanoidentation for PVA/chitosan (CS) copolymer coating [58]. However, average elastic modulus of bulk PVA films was approximately 2.08 GPa [36] at a macroscopic level, which appeared to be much smaller in contrast with those of individual amorphous and crystalline regions, obtained via PFQNM for PVA/NBC nanocomposites in this study. Such a great difference in measurements can be ascribed to the following reasons: (i) though instrumental parameters have been calibrated prior to AFM measurements, the shape function of the topmost probe tip may not be accurate enough for the low penetration depth [24, 25]. In this study, the low pentration force has been used, resulting in a low penetration depth in order to minimise the effects of residual stresses as well as plastic deformation from the neighbouring indent, with the provision of the high lateral resolution capability particularly for nanointerphases. (ii) Nanosurface properties often vary from those bulk properties because of the discrepancy in morphological structures between outer skins on material surfaces and bulk films as well as the differences in nanomechanical behaviour and bulk properties [24]. (iii) Despite the data reliability and repeatability of DMT modulus, its determination using the PFQNM is apparently distinct from tensile modulus for bulk properties via conventional tensile testing owing to the use of different measurement mechanisms [59].
The interphase identification bewteen PVA and NBCs are not limited to the variation of nanoelastic behaviour, but could be distinguished based on the variation of height profiles and adhesion properties, as shown in figures 3(a)–(d). The adhesion of PVA matrices was found to be 10.76 ± 3.42 nN, which appeared to be much greater than that of NBCs at 2.1 ± 0.87 nN. Such a finding was attributed to the hydrophilic nature of PVA with higher adhesion force when compared with hydrophobic NBCs. Furthermore, interphase thickness was measured to be approximately 13–16 nm, as depicted in figure 3(d), which was in good accordance with the values of 13 and 12.5 nm, previously determined for epoxy/graphene nanoplatelet (GNP) composites and epoxy/graphene oxide (GO) nanocomposites, respectively [60]. Consequently, it is proven from our results that interphase thickness tInterphase is a non-uniform and non-constant quantity as far as interphase dimensions are concerned. The uniformity of tInterphase is most likely to be associated with the number of chemical hydrogen bonds and physical roughness of NBC surfaces [4, 39, 61].
The major drawback in previous work lies in a simple assumption of one-dimensional interphase layers with constant interphase thickness. However, our study demonstrated that actual nanointerphases should be formed from a three-dimensional point of view to identify the non-uniformity and dimensional variations of interphases in terms of tInterphase. Here we successfully measured interphase dimensions, as shown in figure 4(a). Moreover, It is clearly seen that there is no direct relationship between tInterphase and tNBC, exhibited in figure 4(b), suggesting that interphase thickness may be independent of particle thickness.
Moreover, figures 4(c)–(e) indicate that interphase height tends to decrease in a linear manner with an increase in NBC height while interphase length and interphase width linearly increase with increasing NBC length and width, respectively. This phenomenon is ascribed to more contact surface areas taking place between polymer matrices and nanoparticles in a nanocomposite system [1]. Elastic properties of interphases are strongly affected by interphase dimensions since interphase modulus tends to become higher with increasing surface areas of outer and inner interfaces, as illustrated in figure 5(c). In particular, as for fully embedded NBCs, a higher modulus increasing trend was evident as opposed to that based on partially embedded NBCs. This finding suggests that interphases can play a more important role in enhancing mechanical properties of PVA/NBC nanocomposites with better bonded matrix-filler interactions. Moreover, it has also been detected that the inner interface area gives rise to relatively high overall interphase modulus in contrast with outer interface area. As mentioned earlier by Liu et al [60], the interphase zone with modulus gradient effect can be divided into two different regions, namely Region 1 and Region 2 for a typical case in figure 5(d), in which Region 1 is in contact with NBC zones with relatively high interphase density when compared with Region 2. Additionally, Fan et al [62] reported that increasing the interphase density inevitably led to the modulus increase for the same type of materials in good accordance with high interphase modulus results obtained in case of inner interface area. Apparently, the right boundary of Region 1 where inner interface is located is adjacent to NBC zones with higher density and elastic modulus, as evidenced in figure 5(d). The relationship between interphase modulus and interphase volume is demonstrated in figure 5(e) on the basis of fully and partially embedded NBCs in PVA/NBC nanocomposites. It is clearly seen that the significant enhancement of interphase modulus with increasing interphase volume, which is similar to the case by increasing SAInterphase. The same applies to fully embedded NBCs, resulting in much greater interphase modulus than partially embedded counterparts in terms of interphase volume in PVA/NBC nanocomposites.
In addition to particle dimensions, particle dispersion and distribution patterns in polymer matrices are the other key factors in controlling interfacial bonding between NBCs and PVA matrices in PVA/NBC nanocomposites. When excessive amounts of NBCs are dispersed within PVA matrices, NBCs tend to agglomerate owing to their weak Van der Waals interactions. Additionally, increasing the particle loading inevitably decreases the interparticle spacing, and thus hinders good particle dispersion [3]. Blighe et al [63] reported that the interparticle spacing was 6 nm in PVA nanocomposites reinforced with 10 vol% single-walled CNTs with a clear sign of particle aggregation. As such, the slippage phenomenon of stacked NBCs under mechanical loading gives rise to less effective enhancement level for mechanical properties of nanocomposites. Moreover, Particle agglomeration becomes manifested at high NBC contents depicted in figures 6(a)–(d). Such phenomena can be explained by Li et al [4] that in a nanocomposite system nanoparticles are brushed with modified layers of polymer matrices especially at a high particle volume fraction. Additionally, 'modified polymer shells' surrounding different particles overlap to form continuous phases, which means that such modified polymer shells become the interphases with separated regions from 'parents' matrices', resulting in less desirable properties. Furthermore, some NBCs are unable to actively interact with PVA molecular chains leading to weaker interfacial bonding and higher possibility of phase separation between NBCs and PVA matrices. This finding is indicative of the existence of particle debonding effect between nanofillers and polymer matrices [15]. It is also worth mentioning that lower interphase modulus can be associated with higher densities of nanoparticles and polymer matrices as compared to that of interphase zones [51]. The aforementioned NBC dispersion pattern in PVA/NBC nanocomposites suggests that there is a percolation threshold for the NBC loading of 5 wt%, beyond which nanomechanical properties of interphases may diminish in good accordance with PVA/graphene oxide (GO) nanocomposites [62, 64].
5. Conclusions
In this study, PFQNM was implemented to quantitatively characterise interphases of eco-friendly PVA/NBC nanocomposites. This work demonstrates in detail a pioneering approach for measuring 3D interphase dimensions as well as determining nanomechanical properties in terms of interphase surface area and interphase volume. Experimental characterisation results indicate that interphase thickness appears to be non-uniform among individual particles and becomes independent of particle thickness. Moreover, it has been detected that interphase modulus in PVA/NBC nanocomposite systems is enhanced with increasing interphase volume. Nanomechanical properties and sizes of interphases depend strongly on NBC dispersion status. Nevertheless, increasing NBC loading was found to result in the decrease in intera-particle spacing leading to particle agglomeration with the interfacial debonding effect between PVA matrices and NBCs. This study demonstrates that two key geometric parameters of interphase surface area and interphase volume are non-constant variables that can be influenced by NBC dimensions and sizes, as well as NBC dispersion status. Our approach enlightens the inclusion of actual interphase properties in theoretical and numerical modelling framework rather than using a simple assumption of single interphase layer dimension and uniform interphase properties in order to achieve more accurate prediction.
Acknowledgments
The first author M Mohanad acknowledges the Higher Committee for Education Development (HCED) in Iraq to award the research scholarship for his PhD studies at Curtin University. The authors would also like to thank Dr Thomas Becker from Nanochemistry Research Institute, Curtin University for the technical assistance in PFQNM measurements.