
Abstract
Use of in situ combined x-ray diffraction and x-ray absorption spectroscopy for the study of the thermal decomposition of zinc peroxide to zinc oxide is reported here. Comparison of data extracted from both x-ray diffraction (XRD) and x-ray absorption spectroscopy (XAS) with thermo gravimetric analysis (TGA) enabled us to follow the nature of the conversion of ZnO2 to ZnO. A temperature range between 230 °C and 350 °C appears to show that a very poorly crystalline ZnO is formed prior to the formation of an ordered ZnO material. Both the decrease in white line intensity in the Zn K-edge XANES and resulting lower coordination numbers estimated from analysis of the Zn K-edge data of ZnO heated at 500 °C, in comparison to bulk ZnO, suggest that the ZnO produced by this method has significant defects in the system.
Export citation and abstract BibTeX RIS

Original content from this work may be used under the terms of the Creative Commons Attribution 4.0 licence. Any further distribution of this work must maintain attribution to the author(s) and the title of the work, journal citation and DOI.
1. Introduction
Zinc oxide is a multi-functional material that has found a plethora of applications, due to its electronic and structural properties. As an n-type semiconductor, similar to other metal oxides the structure, morphology and size of the particles have a large impact on their properties and uses [1, 2]. ZnO is becoming the material of choice for a range of applications which includes transparent conducting oxides [3–5], solar cells [6–8], photocatalytic applications, as a sensing material [9] and for antimicrobial applications [1, 10]. The defects present in zinc oxide have been proposed to be a key factor for its performance [3, 11, 12].
Nano sized ZnO materials have been synthesised in a variety of ways including hydrothermal [13], mechanochemical [14], spray pyrolysis [15], chemical bath techniques etc [11, 16–19]. In addition to the above, ZnO can be conveniently prepared using a two-stage approach by first making zinc peroxide (ZnO2) and subsequently decomposing this in a controlled way to produce zinc oxide, the method of our choice reported in this work. It has been reported that ZnO prepared via decomposition of ZnO2 has defects compared to other methods and it is reported that it is possible to control the types of defects in ZnO which may enhance functionality [12, 20–22]. ZnO2 on its own found prominent use in the rubber industry for promoting cross-linking in carboxylated nitrile rubber and other elastomers and also as an antiseptic additive [23, 24]. The most common method of synthesis of ZnO2 is by adding a soluble zinc salt to hydrogen peroxide, while it has also been prepared by hydrothermal or organometallic routes [9, 10]. Therefore, it is of considerable interest to follow the decomposition pathway of ZnO2 producing ZnO at various temperatures. To follow the decomposition process, it is necessary to use techniques that enable the determination of both long and short-range order. This is required as whilst both the starting ZnO2 and final ZnO product are crystalline solids, the decomposition process may not have long-range order and needs to be studied via the use of methods that are suited for the determination of short-range order present in the system. To this end, we have used combined x-ray diffraction (XRD) and x-ray absorption spectroscopy (XAS) at the Zn K-edge to monitor the process of converting crystalline ZnO2 to ZnO during a thermal decomposition process. XRD provides information regarding long-range order (crystallinity) whilst XAS (an element specific technique that does not depend on long-range order in a system) yields the required short-range order information around a given metal ion of interest. In addition, it is well-known that XRD can be used to determine crystallite size and monitor the formation of amorphous/poorly crystalline phases. Similarly, XANES has been noted to be sensitive to local coordination environment [18] as well as defects present in systems [25]. An added advantage of using the combined XRD/XAS technique is that it is carried out on the same sample under identical environment and utilises time-resolved methods in monitoring the changes that take place rapidly during thermal treatment process [26–34]. This combined approach, first established in early 1990s [26, 27, 29, 30], has become a 'work horse' in many Synchrotron Radiation facilities; a good time-resolution in the measurement of both XRD and XAS facilitates the process of monitoring the structural changes through temperature or any reaction coordinate change. Here we report the structural changes and growth process of ZnO during the thermal decomposition of ZnO2, in air employing the in situ, time-resolved, combined XRD/XAS technique.
2. Experimental
Zinc peroxide was prepared via a wet chemical method. In a typical experiment, 2.0 g of zinc acetate dihydrate was dissolved in 25 mL water to which 25 mL of 30% H2O2 aqueous solution was added and stirred. The pH of this solution was adjusted to 10 using dilute NH4OH and stirred for 12 h at room temperature. The resultant precipitate was isolated by centrifuging, washed several times with water and dried. X-ray diffraction studies conducted using a laboratory based, Bruker AXS D8 Advance, x-ray diffractometer operated in parallel beam mode showed phase pure ZnO2 material was produced using this method (see supplementary information (https://stacks.iop.org/JPCM/33/264002/mmedia) (SI) figure S1).
ICP analysis was carried out on as-synthesised ZnO2, commercial ZnO2 and ZnO2 samples heated to 300 °C. Assay results confirmed the amount of zinc to be 64.4%, 72.0% and 83.2%, respectively. Calculated Zn values are 67.1% for pure ZnO2 and 80.4% for pure ZnO. As commercial ZnO2 contains ∼50% ZnO, the zinc concentration is expected to be between that of pure ZnO2 and ZnO. The obtained value for as-synthesised ZnO2 is lower than expected suggesting the presence of impurities. TG/DTA curves for ZnO2 obtained in air ambient at a heating rate of 2 °C min−1 are given in figure 2. The initial weight drop of 2.8% in the temperature range of 35 °C–150 °C is possibly due to the loss of adsorbed moisture. A further 15% weight drop in the region of 150 °C–250 °C corresponds to the decomposition of ZnO2 to ZnO (calculated 16.4%).
Combined XRD/XAS data were collected on the Zinc K-edge at the B18 beamline, diamond light source (UK), using a Si (111) monochromator. XAS data was collected at the Zinc K-edge (energy range 9500 to 10 550 eV) using transmission mode, over a period of 35 s using QuEXAFS mode. XRD data was collected using a MYTHEN detector (position sensitive detector with an angular range of 60° in 2θ) and a data collection time of ca 1 s was used in this work. Overall, with the deadtime associated with the monochromator movement, 43 s elapsed for the combined XRD/XAS measurement. XRD data was recorded using a wavelength of 1.3051 Å, just below the Zn K-edge to avoid any fluorescence effects. In a typical experiment, 20 mg of zinc peroxide sample was mixed with 130 mg of inert silica powder (for dilution purposes), ground up and pressed to form a 13 mm pellet. This pellet was loaded into a high temperature custom built in situ cell (see photograph given in supplementary information, figure S2) for measuring combined XRD and XAS data. Measurements were conducted during the heat treatment of the sample in a flow of air at 10 ml min−1, to 500 °C at a rate of 10 °C min and after sub-sequent cooling to ca 50 °C.
XAS data were processed using suite of ATHENA and ARTEMIS software [35]. For linear combination fitting (LCF) analysis, an option available in the ATHENA software was utilised [35]. Both starting material ZnO2 and final phase, ZnO (characterised by XRD) were used as standards for LCF analysis, and the fitting was performed over an energy range of −20 to 80 eV with respect to the Zn K-edge absorption edge of 9661 eV. For determining the local structural parameters from EXAFS data, a k-range of 2.4 to 10.44 Å−1 was used. Fitting was performed in R-space (R-range of 0.8 to 4 Å) using ARTEMIS software [35]. The crystal structures of ZnO2 and ZnO were used as the starting models and all the relevant paths below 4 Å were considered for the fitting methods. The amplitude reduction factor, So 2 was determined to be 0.87 by fixing the coordination number (CN) to that of crystal structure data. Inter-atomic distance (R) and Debye–Waller (DW) factor (σ2) were determined by refining these parameters along with the Eo value. Subsequently the So 2 value was fixed to determine change in CN. The values of first Zn–O and second Zn–Zn shells were extracted to determine the local structural change during the thermal decomposition process.
3. Results and discussion
The decomposition of ZnO2 was investigated through monitoring the long-range and local structural changes during the heat treatment of ZnO2, employing in situ combined XRD/XAS techniques in combination with thermo gravimetric analysis (TGA) methods. In figure 1 we show a stacked XRD plot recorded through the decomposition of ZnO2. It is seen that the reflections related to ZnO2 decrease beyond 200 °C and above ca 300 °C reflections belonging to ZnO begin to appear. A TGA plot is shown in figure 2, wherein it is clear that the weight loss starts to occur gradually just below 200 °C. A sharp decrease of 15% loss is seen above 200 °C and subsequently a slow weight loss takes place before it stabilises.
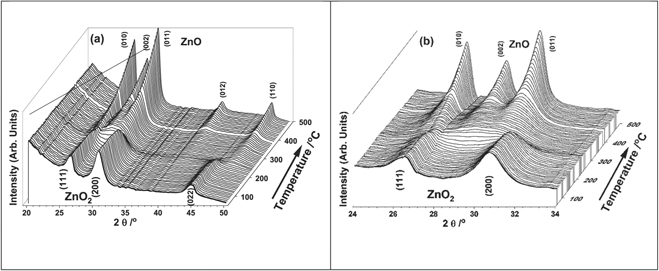
Figure 1. (a) Stacked XRD plot showing the process of decomposition of ZnO2 (front) to ZnO (back) during thermal treatment on ramping from ambient to 500 °C. (b) The 24 to 34 2θ region of the stacked XRD plot is shown to highlight the nature of ZnO formation, in particular highlighting the non-overlapping reflection (independent of any reflection associated with ZnO2) (002) ZnO reflection that occurs at a 2θ of 28.99°.
Download figure:
Standard image High-resolution image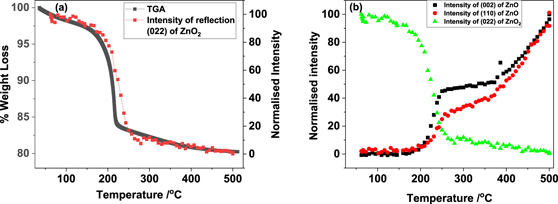
Figure 2. (a) TGA curve of ZnO2 heated in air and its comparison with the variation in intensity of the ZnO2 (022) reflection, determined from figure 1(a) with temperature. In (b) we show variation intensity of respective reflections from ZnO2 (022) and ZnO ((002) and (110)—corresponding 2θ positions of 28.99 and 47.03°)—with temperature. Note that all intensities of these reflections are normalised to 100 of its peak value for ease of comparison and highlight the nature of stagnant growth between ca 250 and 350 °C.
Download figure:
Standard image High-resolution imageTo cross correlate these weight losses with changes in the XRD data, we analysed the intense reflections of ZnO2 that did not have overlap with ZnO reflections to obtain the variation in the intensity of the XRD reflections and plotted these along with the TGA in figure 2(a) (ZnO2 (022) reflection of the XRD data). Although a slight delay in the decrease of the ZnO2 reflection intensity is noted here, the exact temperature ramp used for the TGA was different to that used for the combined XAS/XRD experiment. Also, it should also be noted that the XRD measurements were conducted in sequence with respect to the XAS. Furthermore, we anticipate a small temperature difference of ca 2 °C between the point at which the sample is irradiated with the x-ray beam and the position of the thermocouple placed in the cell (thermocouple is placed ca 7 mm away from the beam in order to avoid any interference of the thermocouple with the x-ray beam). However, the trend appears to be closely similar to the weight loss seen in TGA, which we can be attributed to the decomposition of ZnO2 and formation of ZnO taking place over the temperature range of 175 to 250 °C. In figure 2(b) we compare the intensity variation of the ZnO2 (022) reflection and the ZnO (002) and (110) reflections, (occurring at the 2θ values of 28.99 and 47.03 degrees, respectively), that did not overlap with ZnO2 reflections. It is apparent that the intensities in this 2θ range start to appear in the XRD slightly above 200 °C whilst the ZnO2 reflection intensity begins to decrease around 175 °C. Although the ZnO reflection intensity at 2θ of 28.99 and 47.03, seems to increase rapidly at the beginning, closer examination of these specific reflections in the 2θ range (see figure 1(b)), suggests that the peaks are very poorly defined and a general increase in the background in this region is seen above 200 °C. This implies that very poorly crystalline or amorphous material is being formed in the initial stages of the decomposition of ZnO2. In addition, we noticed that the increase in the intensity values at 2θ of 28.99 and 47.03 for ZnO phase above 250 °C remained almost unaltered up to ca 350 °C. The intensities of the reflections related ZnO then begin to appear and grow above 350 °C. We interpret this initial increase in intensity values at 2θ of 28.99 and 47.03 around 250 °C and subsequent plateau region up to ca 350 °C as the result of formation of a poorly crystalline (amorphous like) ZnO material. Above 350 °C the ZnO material formed becomes more ordered.
We also determined the crystallite size of the ZnO system by taking the two reflections at 2θ of 28.99 and 47.03, that showed no overlap with ZnO2 reflections. Full width at half maximum (FWHM) was determined by fitting the peak with a Pseudo Voigt peak function in Origin TM software and these FWHM values were used to determine the crystallite size using the Scherrer equation  . Here, L is crystallite size, B is the FWHM of a given peak in the XRD pattern at a specific 2θ, λ is the wavelength of incident x-ray and k is a constant. The trend in variation in crystallite size suggests that for temperatures above 350 °C, when the ZnO phase shows distinct reflections, the average crystallite size increases to a value close to 15 to 25 nm. The value of crystallite size for the (002) reflection seems higher than the (110) reflection, suggesting a rod type morphology growth taking place in the system which is consistent with hexagonal ZnO (figure 3).
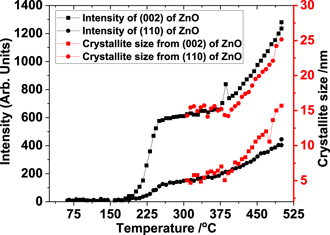
Figure 3. Comparison of the normalised intensity of selected ZnO reflections with crystallite size estimated based on the FWHM of selected reflections from the x-ray diffraction data in figure 1(a). Note, only the ZnO reflections that are present above ca 300 °C were analysed to estimate the crystallite size.
Download figure:
Standard image High-resolution image4. Zn K-edge XAS
In order to obtain the changes in the short-range order of the system, we analysed the Zn K-edge EXAFS data. To perform XAS data analysis, it is necessary to use related materials as standard and also a starting model for extracting local structural information. Here we used crystalline ZnO2 and ZnO as our references. ZnO2 is a crystalline material that crystallises in cubic form (space group Pa-3) with cell parameter of a = 4.871 Å [36]. ZnO crystallises in hexagonal form (P63 mc) with lattice parameters a = 3.2427 c = 5.1948 Å [37]. The local structure of these systems based on the respective crystal structures are given in table 1. It is clear from table 1 that ZnO2 and ZnO have octahedral and tetrahedral environments respectively in the first neighbour coordination. Figure 4 shows a stacked plot of the Zn K-edge XANES data. Figure 4(b) shows that the normalised white line intensity (main absorption peak in XANES) is higher for ZnO2 compared to ZnO, which is related to the local coordination environment.
Table 1. Local structure of ZnO2 and ZnO obtained based on the crystal structures given in references [36, 37]. Oxygen in red and Zinc in grey.
| System | Crystallographic parameters | Local structure (first Neighbour) | ||
|---|---|---|---|---|
| Atom-pair | N | R Å | ||
| ZnO2 [36] | Zn–O | 6 | 2.098 |

|
| Zn–O | 6 | 2.92 | ||
| Zn–Zn | 12 | 3.44 | ||
| ZnO [37] | Zn–O | 4 | 1.97 |

|
| Zn–Zn | 12 | 3.24 | ||
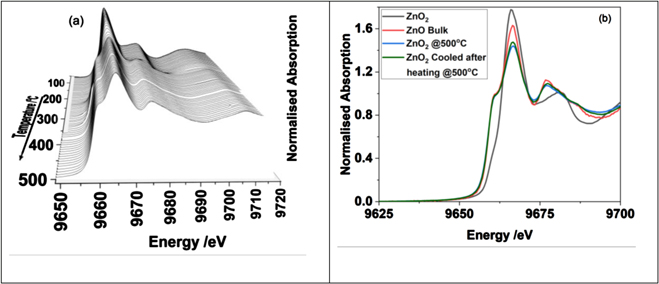
Figure 4. (a) Stacked plot of the Zn K-edge XANES recorded during the thermal treatment to 500 °C of ZnO2. In (b) we compare the Zn K-edge XANES of ZnO2, ZnO (bulk), ZnO (from ZnO2) at 500 °C and the one subsequently cooled to room temperature.
Download figure:
Standard image High-resolution imageComparison of the Zn K-edge XANES of ZnO obtained from heating ZnO2, clearly shows a reduction in the white line intensity compared to bulk ZnO (see figure 4(b)). It has been reported that the loss in white line intensity can be attributed to vacancies present in the system [25]. The overall features in the XANES of ZnO2 are different compared to ZnO and it is therefore possible to use these two spectra as references to estimate the fractions of ZnO2 and ZnO phases in the material from the in situ data obtained during the thermal treatment process. In figure 5(a) we show the combination of fractions of spectral features of ZnO2 and ZnO that matches with the experimental data, recorded during the thermal treatment process. The values obtained, using linear combination fitting analysis of the two reference spectra, plotted against temperature and along with TGA is shown in figure 5(a). The fraction of ZnO2, estimated from the LCF analysis, at any given stage of the reaction clearly follows the weight loss curve seen in the TGA. The fraction of ZnO and ZnO2 clearly crosses the mid-point of 50% each in the figure, which is primarily due to (a) only two reference systems being used and (b) the XAS does not depend on the long-range order. Therefore, irrespective of whether the system is crystalline or amorphous or growing nano crystals, the XANES linear combination of these two phases appears to represent these states very well at every stage of the thermal process.
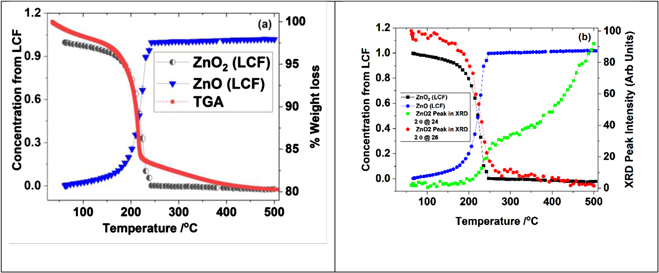
Figure 5. (a) Comparison of fraction of ZnO2 and ZnO estimated using LCF analysis of Zn K-edge XANES data and the TGA curve (b) Comparison of phase fractions ZnO2 and ZnO obtained from LCF analysis with intensity variation of ZnO2 (022) and ZnO (002) reflection from the XRD data (blue).
Download figure:
Standard image High-resolution imageFurther comparison of the fractions of ZnO2 and ZnO estimated from LCF analysis of Zn K-edge XANES data were made with the intensities of the XRD reflections representing ZnO2 and ZnO phases (see figure 5(b)). Whilst the trend in change in intensity of ZnO2 phase in XRD match the fraction estimated from LCF analysis of Zn K-edge XANES data, the intensities of the ZnO (002) reflection clearly show differences with the estimated fraction of ZnO from XANES.
This demonstrates that as XANES is sensitive to short-range order we start to see changes in the decomposition process at an earlier stage, whereas XRD is unable to follow these changes as it requires the presence of a crystalline phase with a certain degree of long-range order.
We also analysed the EXAFS part of the Zn K-edge XAS data in detail from all the recorded spectrum during the thermal treatment process. A stacked plot of the Fourier transform (FT) of the Zn K-edge EXAFS data are shown figure 6(a). There are some clear differences between the data from the beginning of the experiment and above 200 °C. In figure 6(b) we highlight the changes in the FT after 230 °C where it is clear that the second neighbour peak around 3 Å starts to grow.
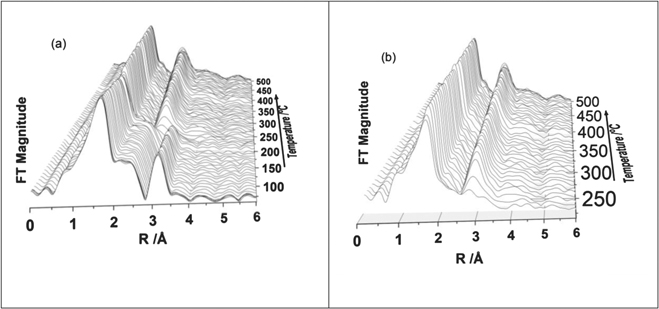
Figure 6. (a) Fourier transform of the Zn K-edge EXAFS of all data sets recorded during the thermal treatment of ZnO2 to 500 °C (b) only the FT's of the EXAFS data recorded above 250 °C are shown for clarity, where only the ZnO phase is present in the system.
Download figure:
Standard image High-resolution imageWe analysed these data sets in detail and representative best fits between experimental and calculated EXAFS after refining parameters in particular, CN, inter-atomic distances and DW factors (E0 was also refined), are given figure 7. It is clear from the fits that all the short-range order distances are similar to the phases of ZnO2 and ZnO (given in table 1) and consistent with the XANES observation for octahedral and tetrahedral coordination environment within the first neighbour distance. In figure 8(a) we plot the variation in Zn–O and Zn–Zn distances as calculated by EXAFS fitting with the TGA curve. Derived distances clearly follow the decomposition of ZnO2 resulting in ZnO formation, as the first and second neighbour interatomic distances are distinctly different in these two systems, going from 2.09 Å to ca 1.97 Å for first neighbour Zn–O and 3.44 to 3.22 Å for second neighbour Zn–Zn distance, in agreement with the crystallographic data of ZnO2 and ZnO, respectively.
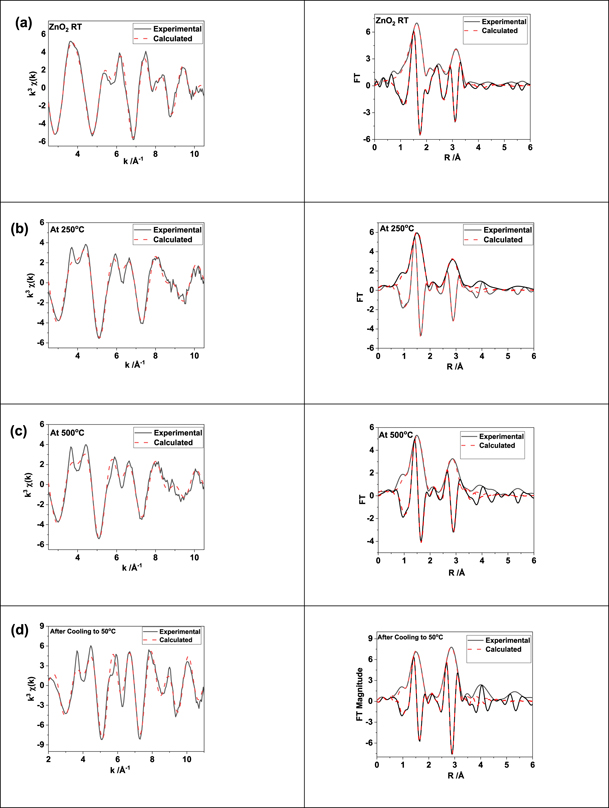
Figure 7. Selected best fit between experimental and computed EXAFS using parameters listed in table 1 and associated Fourier transforms are shown here. (a) RT, (b) 250 °C, (c) 500 °C and (d) after cooling to 50 °C.
Download figure:
Standard image High-resolution image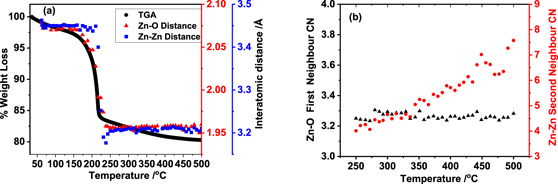
Figure 8. (a) Comparison of TGA curve (grey) with change in Zn–O (red) and Zn–Zn (blue) interatomic distances, as calculated from EXAFS fitting with temperature. In (b) we show the variation in CN with temperature for the first Zn–O and second Zn–Zn neighbours. Note that the error in estimating CN is ca 10% or lower for the first Zn–O coordination whereas the error for 2nd neighbour appears to be larger, in the range of 20% to 30%.
Download figure:
Standard image High-resolution image
Estimating CN (essential to understand any defects are present in the system) is difficult as it is highly correlated with the DW factor (which has both static and dynamic disorder components). Refining the CN and DW factor together or sequentially of the reference ZnO system as well as the ZnO converted from ZnO2, recorded at 500 °C, for example, produced respective values of both well below what one that is expected for data measured at elevated temperatures. To overcome this issue to estimate whether the CN is similar to the bulk or not, we first used a pure crystalline ZnO as our reference to estimate the DW factor at any given temperature, by keeping the CN constant at a CN of 4 for the first Zn–O neighbour and 12 for the Zn–Zn second neighbour. We justify as the XRD pattern of the reference ZnO did not change significantly during the heating process (see the stacked XRD, Zn K-edge XANES and FT's of the EXAFS data recorded at different temperatures using identical methods described for ZnO2 conversion as shown in supplementary figures S3–S5 respectively). This approach indeed assumes that the static disorder contribution in the actual converted samples is similar to bulk ZnO, although the static disorder component may be slightly higher. The estimated DW at various temperatures from the analysis of pure ZnO are shown in the plot for both Zn–O and Zn–Zn neighbours in the supplementary information (see supplementary figure S6); the refined Zn–O and Zn–Zn distances remained closely similar through the analysis at various temperatures. The values of DW at a given temperature were used for the analysis of the Zn K-edge EXAFS data of ZnO (converted from ZnO2) from ca 250 °C and above and extracted the CN values for ZnO at a given temperature. The plot of the variation in CN with temperature is shown in figure 8(b). It is found that both the CN of Zn–O and Zn–Zn first and second neighbours were found to be below the expected values compared to a bulk highly crystalline solid. Whilst the CN value of Zn–O is around 3.5, the values for the second neighbour in the high temperature data above 250 °C appears to be much smaller compared to the bulk ZnO and slowly increased to ca 8 for the second neighbour Zn–Zn coordination. This could be due to defects present in the system which becomes less when heated at temperatures above 400 °C. In order to confirm whether this reduction is due temperature, the thermally treated sample measured after cooling to ca 50 °C was also analysed and the results are shown in table 2 and the best fit for this data are shown in figure 7(d). Indeed, the CN for both Zn–O and Zn–Zn remain at a lower value compared to the bulk while the DW factor decreased, as one would expect for the sample cooled close to 30 °C. However, nano crystalline oxides also show lack of higher neighbour contributions due to size effects [11, 38] It is difficult to determine or suggest whether such a decrease in CN values of higher neighbours is related to the presence of defects or nano crystalline form or both, as it was shown that additional methods are required to differentiate this aspect [38]. Combining the observations that the decrease in the white-line intensity seen in the XANES (figure 4(b)) and the decreased average CN values of both first and second neighbour coordination environments suggests that the ZnO formed by thermal decomposition produces a defective material and possibly in addition to being a nano system consistent with earlier studies [13, 25, 39].
Table 2. Selected structural parameters obtained from best fit between experimental and calculated EXAFS data. N is the average CN for the given atom-pair at a distance of R. σ2 is the DW factor associated with the atom-pair. The estimated So 2 based on ZnO reference compound is ca 0.87
| System | Atom-pair | N | R Å |
σ2/Å2
| R-Factor |
|---|---|---|---|---|---|
| ZnO2 30 °C | Zn–O | 5.9 ± 0.37 | 2.07 ± 0.02 | 0.01 ± 0.0013 | 0.0049 |
| Zn–O | 5.9 ± 0.37 | 2.94 ± 0.03 | 0.027 ± 0.004 | ||
| Zn–Zn | 12.3 ± 2.8 | 3.46 ± 0.02 | 0.016 ± 0.0025 | ||
| 250 °C | Zn–O | 3.3 ± 0.19 | 1.97 ± 0.02 | 0.006 | 0.053 |
| Zn–Zn | 4.0 ± 1.1 | 3.22 ± 0.03 | 0.017 | ||
| 500 °C | Zn–O | 3.3 ± 0.2 | 1.97 ± 0.02 | 0.0076 | 0.046 |
| Zn–Zn | 7.6 ± 1.9 | 3.22 ± 0.03 | 0.024 | ||
| After cooling to 50 °C | Zn–O | 3.3 ± 0.3 | 1.96 ± 0.02 | 0.0047 ± 0.0016 | 0.061 |
| Zn–Zn | 8.6 ± 1.48 | 3.24 ± 0.03 | 0.013 ± 0.0015 |
a.note that analysis of the data recorded at 250 and 500 °C were performed by keeping the DW factor the same as the ones determined using a reference ZnO material, at these respective temperatures.
In summary, we used a rapid EXAFS and diffraction measurement technique which provided high quality EXAFS data to determine the thermal decomposition of ZnO2 material to ZnO. The combined technique, performed in situ, allowed us to determine the pathway to the conversion of ZnO material. By comparing the results with the TGA and the techniques representing long and short-range order of the system, we have been able to identify a region where amorphous or very poorly crystalline ZnO solid is formed. Comparison of the XANES and the EXAFS results with the bulk ZnO suggest that defects are present in the system formed from decomposition of the ZnO2, however further work is necessary to provide further evidence for the nature of the defects present in the system. The results reported in this work could be used to synthesise a ZnO system, which can be studied for applications as semiconductors (including as transparent conduction oxide), with various degrees of crystallinity; poorly crystalline [40] and defective ZnO.
Acknowledgments
We thank EPSRC, Johnson Matthey for funding the PhD studentship to TD. We also thank Diamond Light source for providing facilities and beam time (SP6966-1). We thank Dr Diego Gianolio for useful discussions. We would like to dedicate this manuscript to late Professor Neville Greaves who was the driving force in implementing the combined XRD/XAS technique in 1990's, in the UK.
Data availability statement
All data that support the findings of this study are included within the article (and any supplementary files).