

Abstract
Carrier and lattice dynamics of laser excited CdTe was studied by time-resolved reflectivity for excitation fluences spanning about three orders of magnitude, from 0.064 to 6.14 mJ cm−2. At fluences below 1 mJ cm−2 the transient reflectivity is dominated by the dynamics of hybrid phonon–plasmon modes. At fluences above 1 mJ cm−2 the time-dependent reflectivity curves show a complex interplay between band-gap renormalization, band filling, carrier dynamics and recombination. A framework that accounts for such complex dynamics is presented and used to model the time-dependent reflectivity data. This model suggests that the excess energy of the laser-excited hot carriers is reduced much more efficiently by emitting hybrid phonon–plasmon modes rather than bare longitudinal optical phonons.
Export citation and abstract BibTeX RIS
1. Introduction
The development of small-scale and high speed semiconductor-based devices requires a deep understanding of the various dynamical properties of carriers (electrons and holes) and, most intriguing, of the interplay and coupling with various phonon modes on ultrashort time scale. The processes that govern such dynamics are best investigated by first generating these quasi-particles in a non-equilibrium state with a short light pulse, and then observing their subsequent relaxation. Such dynamics have been extensively investigated both, experimentally and theoretically and an impressive level of insight has been obtained [1, 2]. When a semiconductor crystal is excited with photons of an energy larger than the band gap, electrons and holes with finite excess energy are created within the optical absorption depth which typically ranges between 0.1 to few μm. When the electron–hole pair density is so high that their average distance is comparable to or smaller than the Bohr radius of the exciton and their thermal energy is larger than the exciton binding energy, electron–hole plasma (EHP) composed of free electron–hole pairs is formed [1]. The presence of the EHP will influence the optical properties of the semiconductors by screening the Coulomb potential between the charge carriers, by the band filling effect (i.e. reduction of the phase space available for the optical excitations) and by the renormalization of the single-particle energies which results in the band-gap shrinkage [1, 3].
It is generally recognized that in semiconductors of polar character such as GaAs, CdTe, etc carriers lose their excess energy primarily by emitting longitudinal optical (LO) phonons via the Fröhlich interaction [4, 5] (with LO phonon emission times on the order of few tenths to few hundreds of femtoseconds), which subsequently decay to acoustic phonons (with a decay time constant of few ps) due to the anharmonicity of the crystal potential. The high emission rate of phonons by the hot carriers can drive the LO phonon population out of equilibrium. These phonons then can be re-absorbed by carriers and thereby change the relaxation dynamics (the 'phonon bottleneck') [6, 7]. In addition, the relaxation of hot carriers as well as transport and optical phenomena are influenced by the long-range Coulomb interaction between the LO phonons (i.e. the longitudinal displacement of anion–cation pairs) and the collective excitations in the electron–hole plasma (plasmons) [8, 9]. This coupling modifies the dispersion relation of both, LO phonons and plasmons, giving rise to hybrid LO phonon–plasmon coupled (LOPC) modes [10, 11]. These modes have been documented well and are recognized as important in understanding and characterizing the transport and optical phenomena in polar semiconductor materials [8–12].
In this work we have employed time-resolved reflectivity to investigate the relaxation of hot carriers in the presence of LOPC modes in laser-excited CdTe. CdTe is a polar semiconductor with an intermediate electron–phonon coupling strength that is quantified by the polaron coupling constant  , defined in terms of the static and high-frequency dielectric constants [13]. Although CdTe is an important material with a wide range of applications such as solar cells, infrared, x-ray and γ-ray detectors [14–16], experimental work on its ultrafast dynamics is scarce [13, 17–19], especially if one compares it with the very well studied, weakly-coupled (
 ) polar semiconductor GaAs. In [17], Ishioka et al reported the time-resolved reflectivity on bulk CdTe in a photoexcitation fluence regime of 4.4 to 88 μ J cm−2. The authors measured coherent longitudinal optical phonons (LO phonons) and the ultrafast screening of the surface space-charge region by the photo-excited carriers was considered to be the main generation mechanism. They found that the LO phonon amplitude is insensitive to pump power above some threshold fluence due to the saturation in field screening within the depletion layer. The LOPC modes were not prominent at their photoexcitation fluence but are, however, expected to be evident at higher fluences. Recently, Mizoguchi et al [20] investigated coherent optical phonons in (0 0 1) CdTe cooled to 16 K by using a spectrally resolved pump-probe method. Their work focused on the generation mechanisms of coherent phonons when the sample was excited by ultrashort laser pulses with photon energies below and above the band gap corresponding to transparent and opaque regions, respectively. From the energy shifts of phonon peaks relative to the excitation photon energy, the authors found that phonons in the transparent region have been generated by the nonresonant impulsive simulated raman scattering (ISRS) while in the opaque region by both the resonant ISRS and the impulsive screening of the surface electric field.
In this work, the ultrafast carrier and lattice dynamics of CdTe at room temperature were probed for excitation fluences spanning about three orders of magnitude, from 0.064 to 6.14 mJ cm−2. We focus on the complex interplay between band-gap renormalization, band filling, carrier dynamics and recombination which determines evolution of the time dependent reflectivity following the photoexcitation with the above band-gap near infrared laser pulses. For a sample at room temperature we expect an electron–hole plasma composed of fully ionized electron–hole pairs compared to low temperatures (below  K, where Ex = 12.4 meV is the exciton binding energy for CdTe) where the electron–hole system, in addition to free carriers and excitons, can contain bi-excitons and as well as liquid-phase droplets [21]. We present a framework that accounts for carrier dynamics in the presence of LOPC modes as well as EHP effects such as band filling, band gap renormalization and Coulomb screening, and apply this to model the fluence-dependent reflectivity data. At lower laser fluences (<1 mJ cm−2) where the single-photon absorption (SPA) dominates the photoexcitation, we find that the charge density wave of an injected plasma near the bottom of
  -valley couples with the coherent LO phonons and forms hybrid LOPC modes that conform to the scenario modelled by Kuznetsov and Stanton [10]. At high excitation fluences (>1 mJ cm−2), the two-photon absorption (TPA) exciting electrons high in the
  -valley competes with the SPA which injects carriers near the bottom of the
  -valley. The hot carriers generated by the TPA scatter predominantely from the LOPC modes formed by the plasma of cold and thermalizing electrons near the bottom of the
  -valley and LO phonons, and this leads to sub-picosecond cooling of their population. While only the SPA coefficient saturates at the low-fluence regime, at the high-fluence regime both, SPA and TPA saturate and the screening of the Coulomb interaction by the EHP leads to a modified Auger recombination rate ∼
 , with
  being the electron–hole density and
  .
.
The paper is organized as follows. In section 2 we briefly describe the experimental setup. In section 3 we discuss the hybrid LOPC modes based on the theory outlined by Kuznetsov and Stanton [10]. In section 4 we present a framework for carrier dynamics based on Stanton and Baily's four-state model [22] that accounts for the photo-excitation and recombination of carriers. In section 5 we briefly survey the conclusions of the reflectivity model proposed by Haug [3] which are relevant to our work. In section 6 we present and discuss our experimental results in the framework of models presented in three previous sections. The conclusion of our work is presented in section 7.
2. Experimental setup
The time-dependent reflectivity curves presented in this work were obtained at room temperature using a standard reflection-type pump-probe technique. Laser pulses of about 60 fs duration, photon wavelength of 800 nm and a repetition rate of 1 kHz, generated by a commercially available Ti:sapphire laser system (KMLabs Dragon) were split to provide pump and probe beams. The pump pulse was sent through a 500 Hz optical chopper to a delay unit (Newport M-IMS) and then focused on a p-type Li-doped ( cm−3) 500 μm thick CdTe (1 1 1) crystal (Mateck GmbH) to a diameter of ≃ 1 mm. While the pump beam fluence could be adjusted from 60 μ J cm−2 to 10 mJ cm−2, the probe fluence was kept very low (below 20 μ J cm−2) and small (diameter of about three times smaller than the pump) in order to probe an homogenously excited area. After reflection from the sample, the probe beam was detected by an amplified photodetector (Thorlabs DET 10 A). In order to suppress fluctuations of the laser intensity, another amplified photodetector (Thorlabs DET 10 A) was installed to monitor a small fraction of the probe beam reflected by a beam sampler. The two detectors were coupled into a lock-in amplifier (SR 830) in order to enhance the signal to noise ratio and enable us to detect changes in the sample reflectivity on the order of
  .
.
In order to enhance the sensitivity of the time-resolved reflectivity measurements, a technique proposed by Fauchet ([23]) was applied. By appropriately choosing the angle of incidence to be near Brewster's angle ( deg) and probing with p − polarized light (
 deg), the photo-induced reflectivity changes (
 ) are easily increased by one order of magnitude. This enhancement is due to the enhanced
  near
near  . Consequently, for the same modification of index of refraction n by the photoexcitation, larger
  can be observed when probing near
  than at other angles.
3. Phonon-plasmon coupling
In polar semiconductors such as CdTe, the LOPC modes can be coherently excited by illuminating the sample with ultrashort laser pulses whose time duration is shorter than the LO phonon period. A widely accepted generation mechanism is the so-called ultrafast screening of the surface space-charge region [10, 12]. Recently, Mizoguchi et al showed that resonant ISRS process is also implicated in the generation of coherent phonons [20]. Charge transfer between the bulk and surface states [24] results in a charged region with a finite electric field FSCR, usually referred to as the surface space-charge region (SCR), that can be controlled by doping and may extend quite deeply into the bulk (in CdTe, ∼270 nm for a doping density 1016 cm−3). This built-in surface electric field introduces a finite displacement of the ionic-atoms. When the pump-induced screening of this surface field by the photo-excited electrons occurs very fast, atoms will overshoot their equilibrium position at  and thus launch coherent longitudinal phonons [12]. Both the coherent phonons and the surface space-charge are intimately related to the details of the band structure. As the built-in electric field changes and as lattice vibrations move atoms, photoexcited carriers encounter perturbations and are knocked from a state with energy E(k1) to E(k2).
The theoretical description of the phonon–plasmon modes is based on the coupled equations for the plasmon–phonon dynamics outlined in [10], which have been successfully used to describe experimental results related to the coupling of coherent optical phonons and plasmons in bulk semiconductors:
where Pe is the electronic polarization,  is the electron momentum relaxation time,
  is the normalized lattice displacement (u being the relative displacement of the basis atoms in the primitive unit cell, M the cation–anion effective mass and V0 the volume of the primitive unit cell),
  is the coupling parameter (
 and
and  are the low- and high-frequency dielectric constants, respectively, where
  is the permittivity of free space),
  is the transverse optical (TO) phonon frequency,
  is the LO phonon frequency and
  is the damping constant of the phonon oscillations, which is related to the anharmonic decay of LO phonons [10]. The first equation describes the electron–hole plasma modes that, in the absence of coupling (i.e.
  ), oscillate with a plasma frequency
  . Similarly, the second equation describes coherent optical phonons that, when
  , oscillate with LO phonon frequency
  [5]. When
  , long-range Coulomb coupling of the ultrafast field transients of both the electronic polarization and the polar lattice triggers collective oscillations whose frequencies can be determined by the equation [5]:
Solutions of equation (3) are shown in figure 1. When the electron density is high (>1018 cm−3), screening of the electric field experienced by the ionic-atoms weakens the restoring forces involved in the LO phonon mode and thus forces the  mode which has the character of an LO phonon to oscillate at
  . In contrast
  corresponds in this regime to a LOPC mode having a plasmon character (i.e.
  ). For low electron densities (n < 1016 cm−3)
  has a phonon character (
 ), whereas
  has a plasmon character (
 ). At intermediate electron densities the LOPC modes exhibit a mixed phonon–plasmon character [5]. The time evolutions of the total electric field in the space-charge region E(t) is computed from the numerical solution of equations (1) and (2) as [10]:
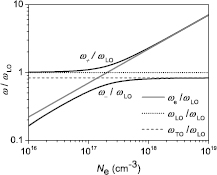
Figure 1. Collective oscillation frequency as a function of electron density for the phonon–plasmon coupled-modes in CdTe. Frequencies in the long-wavelength limit for electrons and LO phonons are computed from the solutions of equation (3) with  THz and
  THz (see text) [25].
Download figure:
Standard image High-resolution imageThis field introduces changes in the refractive index via the linear electro-optic effect (see section 5). The time-dependent electric fields E(t) and their Fourier transforms for different electron densities are shown in figure 2. At high electron densities, the high-frequency plasmons are stronger than the phonon-like mode; at intermediate densities the two modes can achieve equal magnitudes. At low electron densities the plasmon peak becomes broader while the phonon peak approaches the LO phonon frequency.
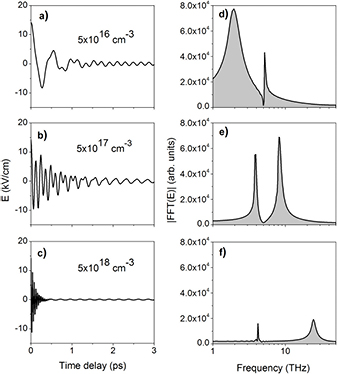
Figure 2. Time evolutions of the electric field in the space-charge region of CdTe (a), (b), and (c) and their Fourier transforms (d), (e), and (f) computed using equation (4). The electronic polarization  and the normalized lattice displacement w(t) are computed from the numerical solution of equations (1) and (2) using
  THz,
THz,  THz,
THz,  fs,
fs,  ps,
ps,  ,
,  and
and  kV cm−1.
Download figure:
Standard image High-resolution image4. Carrier dynamics
A valuable model which provides insight into the qualitative and quantitative carrier dynamics, isolating characteristics that are often lost in a more detailed calculation, is the four-state model proposed by Stanton and Bailey [22]. This model has been successfully applied to explain femtosecond mobility and time-resolved luminescence experiments. We extended this model to include the photoexcitation and recombination. In this model, the conduction band of a semiconductor is divided into four energy states, see figure 3. All  -valley electrons with enough energy to transfer into the L valleys are in the
  state;
  valley electrons with energy less than the minimum of the L valley are in the
  state. Electrons in the L valley can scatter back to
  through the intervalley scattering. The fourth state
  accounts for the electrons at the bottom of the conduction band which contribute to the reflectivity signal and has a width equal to the laser energy- bandwidth. The
  state represents all the electrons with energies from
  up to one optical phonon energy below the threshold for scattering into the L valley. Population of the
  state is altered by means of intravalley scattering processes, polar optical phonon (POP) and LOPC scattering: it is populated by the electrons in the
  states and depopulated when the electrons relax towards the
  state. In our treatment we have considered only electrons owing to the big difference in the curvatures of the conduction and valence bands (i.e. most of the excess energies reside in the electrons rather than in the holes) [25].
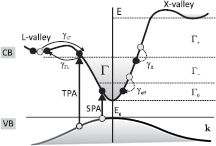
Figure 3. The Stanton–Bailey four-state model. Single-photon absorption (SPA) injects electrons into the  band and two-photon absorption (TPA) into the
  band. All
  valley electrons with enough energy to transfer into the L valleys are in the
  state; they scatter into the L valley via intervalley scattering with a rate
  . Electrons in the L valley scatter back to the
  level with an intervalley scattering rate
  . Electrons in the
  level relax towards the
  level by emitting LO phonons via polar-optical phonon scattering with a rate
  . Electrons in the
  level relax towards the band edge through the intravalley scattering processes (POP and LOPC scattering).
Download figure:
Standard image High-resolution imageMathematically, the extended Stanton–Bailey model can be expresses by four coupled differential equations:

where α is the linear (single-photon) absorption coefficient, β is the nonlinear (two-photon) absorption coefficient, F is the laser fluence and  , with
  being the laser pulse duration. The subscripts
  ,
,  ,
,  and
and  represent positions in the band structure. The scattering rates
  and
and  represent the intervalley scattering
  and
and  , respectively.
  stands for the scattering
  whereas
  represents an effective scattering rate
  which is dominated by the LOPC scattering. In our model we have included carrier generation terms due to SPA (GSPA) and TPA (GTPA), and a recombination term, Auger recombination,
 ![${{R}_{\text{Aug}}}={{C}_{\text{Aug}}}(N){{\left[{{N}_{{{ \Gamma }_{0}}}}(t)\right]}^{3}}$](https://content.cld.iop.org/journals/0953-8984/29/9/095701/revision2/cmaa5478ieqn089.gif) . SPA injects electrons into the
. SPA injects electrons into the  band (excess energy
  eV) and TPA into the
  (
( eV). The evolution of electron densities
  ,
,  ,
,  , and NL computed using equations (5a)–(5b) for laser excited CdTe is shown in figure 4. At
  nm the probe reflectivity depends on
  whose evolution is determined largely by the scattering rate
  .
.
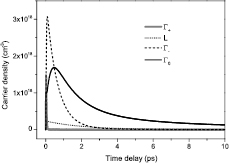
Figure 4. The evolution of electron densities  ,
,  ,
,  , and NL computed using equations (5a)–(5b) for laser excited CdTe (
 nm, F = 6 mJ cm−2,
  fs,
fs,  ps,
ps,  fs,
fs,  fs,
fs,  μm,
μm,  cm GW−1,
  cm6 s−1 and
  fs) with the initial condition of zero electron density in the conduction band at t = 0.
Download figure:
Standard image High-resolution image5. Optical properties of a hot electron–hole plasma
The pump-probe reflectivity (PPR) technique measures the reflectivity changes  of the sample following the photoexcitation by a short laser pulse. The reflectivity is a function of the optical susceptibility
  , which represents the material response to the external perturbation and is determined by the carriers and the lattice together. The susceptibility of a direct band-gap semiconductor in the presence of an electron–hole plasma is given by [3, 26]:
where  being some background susceptibility (related to the lattice response),
  is the dipole moment of the valence conduction-band transition, L3 is the volume of the cubic crystal,
  is the free carrier susceptibility given by
and
is the angle-averaged screened Coulomb potential in momentum space with,  being the screening length and k (
 ) the magnitude of the carrier wave vector11. In equation (7), the term (
 ) is called the band-filling factor and it describes the response of the bulk on the absorption of light by the carriers,
  is the kinetic energy of electrons (holes),
  is the Fermi distribution of electrons (holes), Eg is the band gap in the presence of a EHP and
represents a damping coefficient due to the combined effect of carrier–phonon, carier-impurity, and carrier–carrier scattering with Es being the ground state excitonic binding energy and  a numerical constant [3, 26]. The band gap Eg in the presence of a EHP can be calculated according to a model proposed by Bányai and Koch12,
where  is the unperturbed band gap (1.49 eV) [25],
  is the Mott density [1] (for CdTe,
  cm−3),
  is the Bohr radius of the exciton (for CdTe, ax = 5.5 nm),
is the exciton binding energy and
is the screened exciton binding energy [1, 26], see figure 5.
Various model parameters involved in the computation of the susceptibility (equations (6), (7) and (9) were estimated by comparing the dielectric function  and
and  with the values from [27] (see figure 6), and are listed in table 1.
Table 1. Model parameters involved in the computation of the susceptibility function  .
.
| Parameter | Value |
|---|---|
 |
5.4 |
| dcv |  Cm Cm |
| kmax |  m−1 m−1 |
 |
0.3 eV |
 |
0.04 eV |
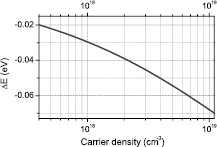
Figure 5. Bandgap renormalization ( ) in CdTe as a function of electron density computed using equation (10).
Download figure:
Standard image High-resolution image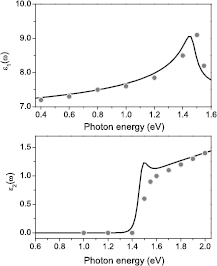
Figure 6. The dielectric function of CdTe.  and
and  are the real and imaginary part of the dielectric function, respectively. The gray spots are the values from [27].
Download figure:
Standard image High-resolution imageAn additional reflectivity change due to the modification of the space-charge field is not included in the above treatment. This contribution can be added via the electro-optical effect. For a zinc-blende type crystal with surface orientation (1 1 1), the principal indices of refraction are given by [28]:

and the refractive index n entering the Fresnel formulas is

where  is the complex refractive index in absence of the field E(t), r is the electrooptic coefficient (for CdTe at 10.6 μm,
  m V−1) [28] and θ is the angle of incidence.
By utilizing the function  and taking experimental inputs such as the angle of incidence θ, one can compute the reflectivity of the p-polarized probe by using Fresnel's formula [29]:
6. Experimental results and discussion
In this section we describe experimental results for the ultrafast carrier and lattice dynamics of CdTe triggered and probed by the laser pulses of 800 nm photon wavelength, with excitation fluences spanning about three orders of magnitude, from 0.064 to 6.14 mJ cm−2. Hereafter, excitation fluences below 1 mJ cm−2 are considered as low-excitation regime and at higher fluences, the high-excitation regime starts.
6.1. Low fluence regime: longitudinal phonon–plasmon coupled modes
A widely accepted mechanism for generation of coherent longitudinal phonons in polar semiconductors is the ultrafast lattice-polarization change caused by the rapid screening of the surface-space-charge region electric field by the photo-excited carriers [12, 17, 18]. The electric field of the surface charge region is usually weak and thus the amplitude of the lattice oscillations is small. To enhance the surface electric field [12] a CdTe single crystal was doped with  cm3 lithium atoms to increase the amplitude of lattice oscillations (for a nominal doping density of
  cm3, a surface space charge field of ∼90 kV cm−1 is expected). At this fluence (and higher) the number of photoexcited carriers is more than one order of magnitude larger than the number of doped carriers and therefore we expect that during the first few picoseconds after the photoexcitation (∼5 ps), LO phonons will couple mainly to photoexcited carriers rather than impurities.
In the first part of the experiment, the evolution of the sample reflectivity as a function of the pump-probe delay was measured at laser fluences of 0.064 mJ cm−2 and 0.57 mJ cm−2. To extract the oscillation signal, a Savitzky–Golay filtering method was applied. This method is common for these types of measurements and was successfully applied to investigate LOPC modes in GaAs [30]. Here, according to the recipe given in [30], we first filter the measured signal and then extract the oscillations by subtracting the PPR signal from the filtered one. In order to prevent numerical artifacts, the filtering interval was chosen to begin well to the right of the sharp minimum of the recorded PPR signal.
The coherent oscillations extracted in this manner are shown in figures 7(a) and (b), where the mode beating and damping due to the phonon–plasmon dynamics are clearly visible. In order to gain more insight into the spectral content, Fourier and wavelet transforms were applied to transform the transient reflectivity into a frequency domain (figures 7(c) and (d)) and frequency-time domain (figures 7(e) and (f)) [31]. From the Fourier and wavelet transforms of oscillations measured at 0.064 mJ cm−2 (see figures 7(c) and (e)), one clearly sees a major feature located at ∼5 THz that safely can be identified as the LO phonon frequency of CdTe (see figure 1). In addition to this one observes the LOPC mode formation (L+ and L− mode) a few hundred femtoseconds following the laser excitation and, as the carrier density decays, this merges into the 5 THz band13. At early times (<500 fs) the time resolution of the experiment (primarily determined by the laser pulse duration of ∼60 fs) allowed us to observe only the low-frequency tail of the damped L+ mode. This is because, at these time delays, the L+ mode is of a plasmon character and has large frequency (∼10 THz). The L− mode, on the other hand approaches  THz. In addition to LOPC modes, coherent phonons at 3.82 and 4.29 THz corresponding to Te nanoclusters on the CdTe surface are also expected [17]. In our measurements, however, since these phonons are located within the LOPC mode distribution and the anticipated space charge region (∼
 nm) is much larger than the thickness of surface Te overlayer (typically ∼
 nm), their contribution could not be discriminated.
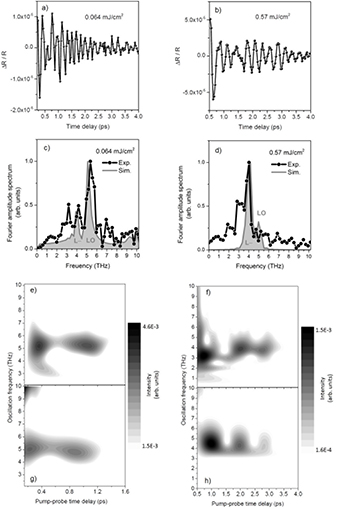
Figure 7. The comparison of the coherent oscillations at fluences (a) 0.064 mJ cm−2 and (b) 0.570 mJ cm−2. In order to avoid the coherent artifact near to time zero, oscillations are extracted after ∼400 fs. Panels (c), (d) show experimental and simulated Fourier amplitude spectra, (e), (f) experimental wavelet transforms and (g), (h) simulated wavelet transforms of the time domain data (a), (b), respectively. The simulated time domain data were computed using equation (15) (see sections 3–5). The wavelet analysis was done by using the wavelet transform software AGU-Vallen Wavelet (www.vallen.de/wavelet) [31].
Download figure:
Standard image High-resolution imageAt earlier times following the laser excitation ( 500 fs), when the carrier density is high (on the order of 1017 cm−1) according to the LOPC framework presented in section 3, the LO phonon mode should not appear. We nevertheless observe it due to the fact that the LOPCs are present only in a narrow region close to the surface (200 nm) where the density of carriers is large, whereas the LO phonon mode is present in the bulk region (to a depth about the size of a laser penetration depth ∼1.4 μm) where the carrier density is much lower. Since the penetration depth of the probe beam covers both regions, both modes are observed [10]. Taking this into consideration, simulations with the parameters listed in table 2 are compared with the measurement represented as the wavelet transform spectrum, see figure 7(e). The simulations clearly predict mode beating and damping. This indicates that, at the low fluences, the SPA promotes electrons near the bottom of the
  -valley which thermalize quickly (<100 fs) to form a plasma of cold electrons. The free carrier system is coupled to the coherent LO phonons triggered by the ultrafast screening of the surface electric field through long-range polarization fields, and this gives rise to hybrid plasmon-LO-phonon modes as described in [10]. Decay of the LO phonon population, which determines the damping of the LOPC modes, occurs within about 1.2 ps.
Table 2. Simulation parameters.
| Parameter | Value |
|---|---|
| Maximum electron density |  cm−3 cm−3 |
| Surface electric field | 20 kV cm−1 |
| Electron–hole recombination time | 1.5 ps |
| LO phonon decay time | 1.2 ps |
At higher fluence (0.57 mJ cm−2), we inject about 1019 cm−3 electrons in the conduction band and start to fill the L-valley. The single-photon absorption saturates, which means the carrier density in the whole probe penetration region is large and almost equal to the density of available states in the  -valley (∼
 cm−3 eV−1) [32]. The Fourier amplitude spectrum in figure 7(d) shows prominent features at around 3.3 THz and 4 THz. The major peak at around 4 THz agrees well with the lower branch LOPC mode (
 THz) predicted by equation (3). The shoulder peak at 3.3 THz is close to the A1 mode frequency of Te (3.6 THz) which, under laser irradiation, can experience a significant redshift [33]. We believe, therefore, that the peak at 4 THz is due to the lower branch LOPC mode (i.e. L− mode) whereas the peak at 3.3 THz can be attributed to the A1 mode of Tellurium14. Following the laser excitation, when the carrier density is high (i.e. about 1019 cm−3),
  THz while
  THz, see figure 1. Thus,
  can be observed but
  cannot since we do not have the time resolution to capture such high frequency oscillations. Under this condition, the lower branch of the LOPC modes is expected to be the dominant feature in contrast to the LO mode at ∼5 THz which is prominent only at low carrier densities, see figure 1. This is the case in the measurement as seen in figures 7(d) and (f). Apart from the time resolution, there is another effect affecting the measurement of the LOPC modes. Since carriers are excited to different parts of the conduction band (the
  -valley and the L-valley), they have different effective masses (m*) and densities (ne). As a result, they do not oscillate at the same frequency
  , but rather at a mixture of these frequencies, which broadens then the frequency profiles of the LOPC mode. This interplay between carrier density evolution and different carrier effective masses, produces such a complex LOPC wavelet transform pattern as shown in figure 7(f). We note that since our signal oscillations due to LOPC modes have been obtained by the Savitzky–Golay filtering method (see section 6.1) which consists of first filtering the measured signal and then subtracting the filtered signal from the measured one, the noise in the measured reflectivity will affect slightly the wavelet spectrum. In this context, we believe that the low frequency features in the measured spectrum (<2THz) are related to the noise in the measured reflectivity curve rather than LOPC modes.
6.2. High-fluence regime: strong coulomb-screening and ultrafast hot-carrier relaxation
In figure 8 we compare the time-resolved reflectivity curves measured at 0.57 mJ cm−2 with those measured at high fluences (from 1.51 to 6.14 mJ cm−2). The fluence-dependent effects are immediately apparent. First, following the photo-excitation for the low-fluence measurement (0.57 mJ cm−2), the time- dependent reflectivity increases whereas for the high-fluence measurements (from 1.51 to 6.14 mJ cm−2) it decreases. Additionally, the reflectivity minimum of the high fluence measurements increases with increasing fluence. At the lowest fluence the main photon absorption mechanism is SPA, which excites electrons near the  -valley. These carriers redistribute very fast (on the order of 100 fs) and fill the states at the bottom of the conduction band thus blocking the absorption of the probe pulse [38, 39]. As a result, the probe pulse is reflected. In addition, cooling of hot electrons generated by two-photon absorption (TPA) prolongs the increase in reflectivity for few hundred fs. In the higher fluence regime, on the other hand, electrons will be generated by both, SPA and TPA. The TPA will excite electrons with higher excess energies, 1.84 eV, 2.5 eV and 2.9 eV relative to the valence band minimum, respectively. Since band filling (BF) is affected only by the thermalized carriers near the band gap whereas band-gap renormalization (BGR) depends on the total carrier density in the bands [40–42] only a fraction of the total carriers cool down to the band edge and affect BF, whereas all of them contribute to BGR. This means that BGR will dominate over BF. Since BGR red-shifts the energy band gap,
  , unoccupied states become available to the probe beam so that the probe beam gets absorbed, which leads to a decrease of the time-dependent reflectivity. At these fluences the reflectivity background which results from the occupancy of states at the bottom of
  -valley is about
  orders of magnitude larger than the amplitude of the LOPC oscillations. Here we choose a delay time step of 250 fs and deliberately focus on the relaxation dynamics.
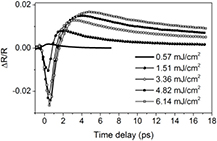
Figure 8. Time-resolved reflectivity of the lithium-doped CdTe measured at excitation fluences ranging from 0.57 mJ cm−2 until 6.14 mJ cm−2 are depicted.
Download figure:
Standard image High-resolution imageIn order to extract physical information from the data presented in figure 8, we use the theoretical foundations presented in sections 4 and 5. SPA excites electrons into the energy band  that contains
  available states. Accordingly, a laser pulse of intensity I(t) can excite no more than
  electrons into this band as described by a term
  (SPA saturation) [32]. TPA on other hand involves large excitation energies and thus excites the carriers into
  band. The intensity dependence of TPA is taken into account by using an effective TPA coefficient of the form
  , with Isat being the saturation intensity.
Electrons excited at the  band will partially scatter to (i) the L-valley (intervalley scattering) and (ii) to the
  band. The number of electrons scattered to the L-valley or to the
  band depends on the scattering rates
  , which from [5] is about 3 ps−1, and
  (see below). The cooling rate
  describes carrier cooling towards the band edge and so determines the extend to which BF overcomes BGR. In the low-excitation regime,
  is attributed to the polar optical-phonon emission via the Fröhlich interaction. The typical scattering time is
  , where nLO is the number of emitted LO phonons and
  is about 70 fs [13]. With this value and taking into account the fact that an electron at
  needs to loose ∼1.4 eV of energy to reach the bottom of the conduction band, one can estimate the total cooling time:
  ps. This would result in a much slower increase of the reflectivity from the valley minimum of the time-dependent reflectivity curve than is experimentally measured. The best agreement with experiment (to within 5
 ) is obtained by assuming
  fs. Therefore there must be a relaxation channel of hot carriers that is much faster than LO phonon emission. Since CdTe is a polar semiconductor with strong coupling between LO phonons and carrier plasma (i.e. plasma of cold electrons near the bottom of the
  -valley, see section 3), the fast channel can be attributed to the LOPC modes. In this process hot electrons are scattered from a state with energy
  to a state with energy
  , where
  is the LOPC mode frequency,
  stands for the hot carrier wave vector at the initial state and
  for the final state (in the case of parabolic band approximation,
  ). The LOPC scattering rate depends on the energy
  and for L+ mode at electron densities above 1019 cm−3 can be an order of magnitude larger than the rate due to the POP scattering15
. Thus hot carriers relax much more efficiently by emitting LOPC modes than by emitting pure LO phonons. Such scattering channel has been invoked to interpret hot-luminescence data in n-type Si-doped GaAs [9]. There, Petersen and Lyon observed that LOPC mode emission dominates the initial energy loss of hot electrons injected into a background electron density (due to doping) of ∼ cm−3. At their electron densities, however, the LOPC scattering rate was comparable to the LO mode scattering. Gong et al [43] were also able to observe relaxation of hot carriers through the emission of LOPC modes in n-type GaAs. In p-doped GaAs where the carrier plasma is dominated by the holes, on the other hand, owing to the complex structure of the valence band (including intra- and inter-valence band transitions), this scattering channel was not observed. In our measurements, the LOPC modes are dominated by the electron plasma. Since the density of injected carriers is about three orders of magnitude larger than the density of p-type dopant atoms, the influence of doping in the carrier plasma is expected to be negligible. Due to the big difference in the curvatures of the conduction and the heavy hole valence bands, most of the excess energy provided by the laser resides in the electrons rather than in the holes (i.e. the heavy hole valence band around the
  -valley where most of photoexcitation takes place is almost flat and, therefore, holes have much less excess energy than electrons). If holes would have been involved in the cooling of hot carriers, in order to fulfill the energy and momentum conservation, they need to emit LOPC modes with large wave vectors q. In comparison to electrons, this would imply much slower cooling rate since the rate matrix elements are proportional to 1/q2, contrary to our experimental results and expectations [5].
When electrons and holes cool down towards their band edges, they start to recombine. In our measurements, the decrease of the reflectivity towards the unperturbed value, determined mainly by the recombination of carriers, happens on a time scale ranging from few ps to few tens of ps. Since for n = 1018 cm−3 the radiative recombination ( cm3 s−1) is on the order of ns [44] the fast reflectivity decrease must be attributed to the more efficient Auger recombination. A typical Auger recombination process involves three carriers and is therefore proportional to N3, where N is the free carrier density. Detailed investigations, however, show that there are deviations from this rule in the case of (i) degenerate semiconductors and (ii) when screening of the coulomb potential which mediates carrier–carrier interaction is taken into account [45]. When screening of Coulomb potential is included, the transition matrix elements become density dependent and, as a result, the Auger transition rate is weakened by a factor of N−2 or N2/3, depending on the degeneracy condition. This implies that Auger recombination rate can have a density dependence varying as N or N7/3, depending on the transition from a strong degeneracy to no degeneracy. Experiments in highly excited narrow band-gap semiconductors confirmed that the Auger recombination rate follows N2 rather than N3 dependence [45–47]. In our case, the treatment of Auger recombination is even more complex since in addition to central
  -valley, we populate the L-valley. Population of L-valley is fluence dependent. The best fit (to within 5%) is achieved by using an Auger recombination rate that follows N2 dependence and a fluence dependent Auger coefficient with values listed in table 3.
Table 3. The values of parameters used for simulations in figure 9.
| F (mJ cm−2) | 1.51 | 3.36 | 4.82 | 6.14 |
|---|---|---|---|---|
 (μm) (μm) |
1.4 | 1.4 | 1.4 | 1.4 |
 (cm−3) (cm−3) |
1018 | 1018 | 1018 | 1018 |
 (cm GW−1) (cm GW−1) |
46 | 22 | 13 | 9 |
1/ (fs) (fs) |
300 | 300 | 300 | 300 |
1/ (fs) (fs) |
2000 | 2000 | 2000 | 2000 |
1/ (fs) (fs) |
70 | 70 | 70 | 70 |
1/ (fs) (fs) |
500 | 520 | 550 | 600 |
| CAug (cm3 s−1) |  |
 |
 |
 |
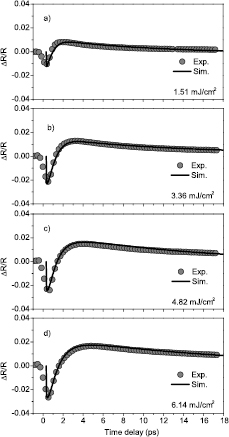
Figure 9. Comparison of the high-fluence measurements with the simulations.
Download figure:
Standard image High-resolution imageBy computing the carrier density using the extended Stanton–Bailey model (equations (5a)–(5b)), combined with the susceptibility (equation (6)) and the refractive index (equation (14)) calculated in section 5, one can simulate the time-dependent reflectivity curves (equation (15)) and compare them with the measured ones. Figure 9 shows the comparison between simulation and experiment. The parameters used in the simulation are listed in table 3. The absorption coefficient  extracted from the fitting in figure 9 is about
  cm GW−1 with a saturation intensity of about
  GWcm−2. To the best of our knowledge there is no reported TPA coefficient for CdTe at 800 nm, however one can compare it with the value measured at 1024 nm, since according to Hutchings and Van Stryland [48] the ratio
  . At 1024 nm, the reported TPA coefficients for CdTe range from 20 cm GW−1 to 200 cm GW−1 [49–51], thus we can conclude that our extracted TPA coefficient is reasonable.
7. Conclusion
In conclusion, the complex transient reflectivity changes in CdTe from a low excitation fluence of 0.06 mJ cm−2 to a high value of 6.14 mJ cm−2 were investigated. A framework is presented to account for carrier dynamics in the presence of phonon–plasmon modes as well as electron–hole plasma effects such as band filling, band-gap renormalization and Coulomb screening. In conjunction with the susceptibility computation framework proposed by Haug and Koch [3], the measured time-dependent reflectivity changes were modeled. A charge-density wave of an injected plasma near the bottom of the  -valley couples with the coherent longitudinal phonons and forms phonon–plasmon modes that conform to the scenario modeled by Kuznetsov and Stanton [10]. At high fluences, pump-enhanced absorption is related to the band-gap renormalization and the ultrafast rise of reflectivity is related to the ultrafast excess-energy relaxation of hot carriers by the phonon–plasmon coupling. We find that photo-excited hot carriers cool much more efficiently by emitting phonon–plasmon modes rather than bare LO phonons − this leads to a sub-picosecond cooling of their population. While at low excitation fluences single-photon absorption dominates the photoexcitation, at high fluences it competes with the two-photon absorption. At the high fluence regime both absorption mechanism saturate and the screening of the Coulomb interaction by the electron–hole plasma modifies the density dependence of the Auger recombination rate.
Acknowledgments
The authors would like to thank Professor Bruce Doak (Arizona State University) for his helpful comments and Manfred Spiwek (DESY) for the sample characterization. We gratefully acknowledge financial support by the Max Planck Society. M S and S T are grateful for financial support, SFB 755 'Nanoscale Photonic Imaging'/project B03.
Footnotes
- 11
In an EHP, the screening length
 is calculated from the screening lengths of electrons () and holes (), , where , with . Here is the chemical potential of carriers which can be calculated using equation (4) in Nilsson 1978 Appl. Phys. Lett. 33 653.
 - 12
This formula is obtained from the well elaborated many-body approach developed by Banyai and Koch (1986 Z. Phys. B: Condens. Matter 63 283, and references therein), and compares well with other approaches (e.g. Zimmermann 1988 Phys. Status Solidi b 146 371, see Versteegh et al 2011) and with experimental results (see Versteegh et al 2011 and references in the paper of Banyai and Koch 1986).
- 13
Since the LOPC mode frequencies depend on the carrier density (see figure 1), due to the decay of the carrier density to values below 1017 cm−3,
asymptotically approaches THz, whereas gets so small that, due to the time window of our experiment, it cannot be captured. - 14
When the sample temperature-increase induced by laser irradiation
is large (>C), Cd atoms can sublimate and leave behind an excess Te layer at the surface [34, 35]. In our measurements, C [36] and, thus, we do not expect a laser induced growth of Te-overlayer during the data acquisition (here, F is the laser fluence, Ch is the volumetric heat capacity and ζ the laser penetration depth). We expect that the Te overlayer is few nanometers thick (<10 nm) [37], much smaller than the laser penetration depth (i.e. the depth of the photoexcited region). In this context, the dynamics observed at higher fluences is not expected to be affected by the Te optical modes. - 15
The scattering rate
for an hot electron interacting with a LOPC mode of energy , is ([5], chapter 9, equation (9.31)) where M is the reduced cation–anion mass, V0 is the primitive unit cell volume, is the permittivity of free space, eL is the effective charge, q is the LOPC mode wave vector, is the phonon occupation number and f is the Fermi–Dirac distribution (here its assumed that electrons have already established the equilibrium with themselves). This equation is similar to the POP scattering rate if we neglect screening and use instead of ω, instead of and (see [5], chapter 3, equations (3.15) and (3.140)). This comparison suggests that the difference between the LOPC and POP scattering is largely affected by the factor defined by (see [5], chapter 9, equations (9.28), (9.30) and (9.31)) The ratio between and , , indicates how efficient LOPC scattering is relative to the POP (Froehlich) scattering and for electron densities above 1019 cm−3 can be larger than 30.


![$\frac{1}{\tau}=\frac{{{e}^{2}}}{8{{\pi}^{2}}M{{V}_{0}}\varepsilon _{0}^{2}}{\int}^{}\frac{e_{L}^{2}Q\left(\omega,q\right)}{\omega {{q}^{2}}}\left(1-{{f}_{{{\mathbf{k}}^{\prime}}}}\right){{\delta}_{\mathbf{k}-\mathbf{q}+{{\mathbf{k}}^{\prime}},0}}\left[n\left(\omega \right)+1\right]\delta \left({{E}_{{{\mathbf{k}}^{\prime}}}}-{{E}_{\mathbf{k}}}+\hbar \omega \right)\text{d}\mathbf{q}$](https://content.cld.iop.org/journals/0953-8984/29/9/095701/revision2/cmaa5478ieqn204.gif)


![$Q\left(\omega \right)={{\left(\frac{{{\omega}^{2}}-\omega _{\text{TO}}^{2}}{\omega _{\text{LO}}^{2}-\omega _{\text{TO}}^{2}}\right)}^{2}}{{\left[1+\frac{\omega _{\text{e}}^{4}{{\left({{\omega}^{2}}-\omega _{\text{TO}}^{2}\right)}^{2}}}{\omega _{\text{e}}^{2}{{\omega}^{4}}\left(\omega _{\text{LO}}^{2}-\omega _{\text{TO}}^{2}\right)}\right]}^{-1}}$](https://content.cld.iop.org/journals/0953-8984/29/9/095701/revision2/cmaa5478ieqn212.gif)


