 69, 00-681, Warsaw, Poland

Abstract
Neutron-rich Ba isotopes are expected to exhibit octupolar correlations, reaching their maximum in isotopes around mass A = 146. The odd-A neutron-rich members of this isotopic chain show typical patterns related to non-axially symmetric shapes, which are however less marked compared to even-A ones, pointing to a major contribution from vibrations. In the present paper we present results from a recent study focused on 148–150Cs β-decay performed at the ISOLDE Decay Station equipped with fast-timing detectors. A detailed analysis of the measured decay half-lives and decay scheme of 149Ba is presented, giving a first insight in the structure of this neutron-rich nucleus.
Export citation and abstract BibTeX RIS

Content from this work may be used under the terms of the Creative Commons Attribution 3.0 licence. Any further distribution of this work must maintain attribution to the author(s) and the title of the work, journal citation and DOI.
1. Introduction
The region of n-rich Ba nuclei is known to exhibit strong octupole correlations, which have been postulated more than 30 years ago by Nazarewicz et al [1]. The occurrence of octupolar deformations in this region is driven by the  and
and  neutron and proton orbitals.
Leander et al [2] have discussed the evolution of octupolarity in neutron-rich Bariums, predicting that the non-axial deformations are mainly arising from vibrations, since shallow minima in the energy surfaces are expected, at variance to the Ra–Th isotopes. Already in this paper octupolar deformations are predicted to reach their maximum in 145–146Ba, while heavier Ba isotopes should present more axially symmetric shapes.
While the presence of strong octupolar correlations has been experimentally established in even–even 222–228Ra isotopes, in most cases, both for actinides and lanthanides, the description of octupole states is consistent with vibrational couplings to the ground-state bands [3].
The Ba isotopic chain has been extensively studied in past years up to A = 148, mainly via spontaneous fission of both 252Cf and 248Cm sources. Spins and parities of both yrast and side bands could be assigned in most cases through directional correlations from oriented states (DCO) and polarization measurements [4, 5]. β decay studies of the Cs parent nuclei have also been performed, highlighting the population of non-yrast low-spin states [6].
More recently, 144Ba and 146Ba have been studied at the CARIBU facility in Argonne. In the first case the beam was post-accelerated to allow for a Coulomb excitation experiment, leading, for the first time, to the measurement of the B(E3; ) transition probability [7]. The β decay of 146Cs into 146Ba has been measured with improved statistics, leading to a great extension of the level scheme up to 2.2 MeV [8].
Octupolar correlations have been identified in the even-A members of the Ba isotopic chain, while the indications of strong octupole collectivity are less pronounced in the odd-A ones. Evidences of well-developed alternating-parity bands, characteristic of reflection-asymmetric shape of a nucleus, were only reported for 143Ba [9, 10] and 145Ba [11]. A recent β-decay experiment suggested some degree of octupolar deformation in the ground state of 147Ba, but no additional indication from higher-lying sates could give insight on the evolution at higher excitation energies [12]. However a recent study of 147Ba, populated by fission of 248Cm [13], demonstrated that the spin of the ground state is  , at variance from previous assignments as
  , and showed that octupolarity in odd-A145–147Ba arises from octupole vibrations rather than from static octupole deformations.
In the isotonic chain of N = 93, on the contrary, the development of axially deformed structures has been reported, and the alternating bands found in these nuclei are accounted for as a polarizing effect of the unpaired neutron [14].
Located at the crossing between the axially deformed N = 93 isotones and the octupolar odd-A Z = 56 isotopes, the analysis of low-lying structures in 149Ba can provide useful information for a first insight in this nucleus.
In this contribution we describe a β decay experiment performed using the ISOLDE Decay Station (IDS) set-up to study the most exotic members of the isotopic chain of Ba accessible up to date. In particular, data from the decay of 149Cs  149Ba will be shown for the first time, which lead to a detailed level scheme for the daughter nucleus. A comparison of decay half-lives to most recent calculations is also presented.
2. Experimental details
Cs isotopes ranging from A = 148 to A = 150 have been produced at ISOLDE (CERN) [15] impinging the 1.4 GeV proton beam delivered by the PS-Booster on a nano-structured UCx target. The intensity of the A = 150 beam was of the order of 2 Ions μC–1, at the limit of detection with the available set-up, thus preventing the study of the more exotic isotopes. Yields are discussed in more details later in this section.
In order to enhance short-living species among long-living components of the decay chain, a short extraction time was defined. The extraction of the exotic species started when the proton pulse impacts the target, and it is stopped by an external signal (the so-called beam gate) whose delay was set in accordance to the expected half-life. Beam gate intervals ranging from 150 to 350 ms were used in the experiment here described, as specified later in the text.
The experiment was performed using the IDS, equipped with 3 fast-responding plastic scintillator detectors, for β particles detection, 4 HPGe clover detectors for high-resolution γ-ray spectroscopy, and 2 small-volume LaBr3(Ce) detectors to perform lifetime measurements on specific nuclear states. A detailed description of the setup can also be found in [16], while a description of the properties of the LaBr3(Ce) detectors is given in [17] and in a specific contribution to this Special Issue [18].
Pictures of the setup are shown in figure 1: in the left panel the holding structure and location of the clover detectors is presented. Two of the clover detectors have a thin C window which allows to efficiently measure γ and x-rays down to very low energies. X-rays from Ba, with energies around 30 keV could be seen in the spectra, thus allowing for a better identification of the decay chain. A close-up view of the arrangement of LaBr3(Ce) and plastic detectors is given in the central panel of figure 1: the two large detectors on the side are the LaBr3(Ce), wrapped, together with their PMT tubes, in black tape for light shielding. Each of them faces a small plastic β scintillator, which is placed onto the beamline. Facing the implantation point we see the larger β detector, which was the only one used for fast-timing measurements thanks to its fast response time. The location of the different classes of detectors is also reported schematically in the right panel of figure 1.
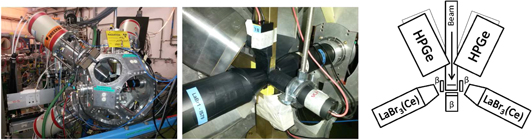
Figure 1. Left and central panels: pictures of the experimental setup. The left panel shows the holding structure of the clover detectors, placed backwards as respect to the beamline, while in the central panel a detailed view of the fast-timing setup is visible: to the sides we see the two LaBr3(Ce) detectors, each of them facing a thin plastic detector directly attached to the beamline, while in front of the implantation point another fast-responding plastic detector is placed. A schematics of the detectors' arrangement is presented in the right panel.
Download figure:
Standard image High-resolution imageEnergy and time signals were acquired using a digital trigger-less acquisition system based on digitizers with 14 bits resolution and 100 MHz internal clock [19]. The fast signals arising from the LaBr3(Ce) detectors were processed by analog constant fraction discriminators, optimized for external delay and time walk. Time spectra were constructed using time to amplitude converters (TAC) modules set up to record the following coincidences: LaBr3(Ce)–LaBr3(Ce) and LaBr3(Ce)-plastic. Coincidences between the LaBr3(Ce) detector and the plastic detector placed on the same side were not considered.
The β detection array efficiency was 20%, while that of the total HPGe efficiency using add-back was 6% at 0.6 MeV. The digital processing of the energy signals provided resolutions at 1.3 MeV of the order of 2.3 keV for the HPGe detectors and 40 keV for the LaBr3(Ce) ones.
Cs ions were implanted on an alluminized mylar film facing the β detector. The beam extraction was started at the arrival of the proton pulse. Data acquisition was also started with the proton arrival, and left open until the arrival of the next pulse. The tape was moved every super-cycle, i.e. every 20–25 proton pulses.
Three different decay chains were studied in this experiment, A = 148, 149, 150. The focus of the present contribution is on the odd isotope, while the remaining ones are subject of a subsequent publication.
In order to check performances of the setup we started from the less exotic setting on A = 148: γ transitions for daughter and grand-daughter products are well studied, with decay half-lives ranging from 152 ms (148Cs decay), to 344 ms for the decay of 148Ba, to 1.05 s for the decay of 148La into 148Ce. By varying the requirement on the time between the proton signal and the emission of the β particle we could enhance the contribution from the first decay steps (i.e. 148Cs  148Ba), or the final ones (i.e. 148La
  148Ce). The corresponding spectra are shown in the two left panels of figure 2: most top one refers to an interval between the proton emission and the β decay corresponding to 0–400 ms, while the second panel to a retarded coincidence, in the interval 1200–3000 ms. Transitions belonging to 148Ba are enhanced in the first panel, while in the second one we identify contributions coming only from the grand-daughter and great-grand-daughter, 148La and 148Ce respectively [20, 21].
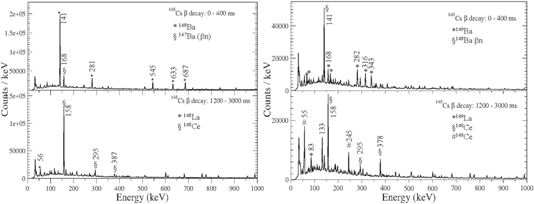
Figure 2.
 coincindence spectra built in two time ranges to enhance short- and long-living members of the decay chains. In the top panels of the figures the
  time-coincidence window is restricted to 0–400 ms, while in the spectra in the bottom it extends between 1200 and 3000 ms. Panels on the left refer to spectra obtained for mass A = 148 while the ones to the right to mass A = 149. Main transitions in the daughter nuclei are highlighted by their energy and symbols indicate the daughter nuclei.
Download figure:
Standard image High-resolution imageIn the first panel we can identify γ transitions which are known to depopulate states up to the 3− state at 774 keV. The line at 281 keV belongs to the decay of 147Ba, therefore populated by delayed emission of one neutron. The decay times associated to these lines are consistent with each other and result in the average value of 152(1) ms, discussed in section 3.
The same procedure has been applied to transitions for the decay chain of mass A = 149, resulting in the spectra shown in the right panels of figure 2. Again the prompt coincidence window enhances transitions from the decay of 149Cs  149Ba, while the retarded window the decay of the subsequent products. In general, the decay from 149Cs is fragmented onto many, closely lying, final states, and a strong contribution from delayed emission of neutrons is present. The βn branch seems to be mainly populating the 2+ state in 148Ba, even if a contribution from the 4+
  2+ transition might be present but is covered by the presence of a γ transition at similar energy in the decay of 149Ba. This will be discussed in more details later on in this paper.
In the lower panel we see transitions coming from many different nuclei, in particular from 148Ce and 149Ce [20, 22]. The decay of 149La presents a small, but non-negligible, neutron-emission branch, with a probability of 1.5% [23]. In addition 148Ce can also be populated as a grand-daughter in the decay chain started by the βn branch of the mother nucleus 149Cs.
Yields were extracted starting from the intensity of γ lines, taking into account β and γ efficiency and ground-state feeding from missing intensity. The yields were much lower than expected, preventing to reach out towards A = 151–152 Cs isotopes. They are reported in table 1 and compared to values obtained in a former attempt to populate this mass region under similar conditions, i.e. using an UCx target and the ISOLDE PSB protons at a lower energy of 1 GeV [24]. The table shows also official values reported in ISOLDE database [25].
Table 1. Comparison of the yields for the measured Cs isotopes: the ones measured in this work are reported in column 2 while those obtained at PSB with 1 GeV protons in column 3. Yields reported in column 4 are obtained from the SC ISOLDE, and are taken from the ISOLDE database. See text for details.
| Isotopes | Yields (ions μC–1) | ||
|---|---|---|---|
| This work | PSB 1 GeV | ISOLDE Yields | |
| 148Cs | 5.5 × 10² | 9 × 10⁴ | 2.5 × 10⁵ |
| 149Cs | 100 | ≈4000 | 7.1 × 10⁴ |
| 150Cs | 2 | ≈100 | 1.2 × 10⁴ |
In [24] it is already argued that the diminishing yields could be related to a decrease in the cross section when using reactions driven by high-energy protons: the stronger decrease is seen when going from SC 0.6 GeV protons to 1 GeV protons delivered by PSB. This effect cannot, however, fully account for the further reduction seen in this latest attempt to reach the exotic Cs isotopes, which are two orders of magnitude lower than previously seen with PSB beams. A detailed knowledge of the release curve could be instrumental in defining the best experimental conditions.
3. Decay half-lives
The half-lives for the 148Cs  148Ba, 149Cs
  149Ba and 150Cs
  150Ba decays have been determined from γ transitions depopulating the daughter nuclei. Most intensely populated lines have been used in each case, and examples of the resulting decay curves are shown in the three panels of figure 3. Owing to the large statistics obtained for A = 148 a simple exponential function has been fit, while for the other isotopes the fitting function consisted in an exponential plus a linear background. The fitting functions are indicated as dashed lines, while their envelope is shown in a continuous line. Resulting half-lives also reported in the figure, together with the energy of the transition used to obtain the lifetime. Similar plots have been built in coincidence with other intense transitions for the three nuclei, yielding similar results. This analysis is consistent with the presence of just one decaying state in each of the nuclei. The statistics for the decays 149Cs
  149Ba and 150Cs
  150Ba is limited and the spectra show fluctuations at long times. The presence of a second exponent has been investigated, but no conclusive result could be drawn.

Figure 3. Decay curves for 148Cs (left panel), 149Cs (central panel) and 150Cs (right panel). In each panel the vertical lines indicate the beam gate, and the continuous red lines show the fit to the decay curve. In the case of 148Cs, giving the high statistics, a simple exponential curve has been fitted, while for the other two isotopes the fitting function is formed by an exponential plus a linear background. The two functions are shown with dashed lines. Energy of the transitions used to determine the plots shown are indicated in each panel, together with the resulting half-lives.
Download figure:
Standard image High-resolution imageThe half-life for the decay 148Cs  148Ba results in 152(2) ms, in accordance with the adopted value of 146(6) ms [29] and a previous study at ISOLDE [24], 158(7) ms. A half-life of 84(2) ms is obtained for 149Cs
  149Ba, shorter than previously estimated at ISOLDE [24], 112(3) ms. In the case of 150Cs
  150Ba the current estimate of 80(4) ms agrees with the former measurement of 82(7) ms.
In order to show the evolution of the half-lives in the Ba isotopic chain, these experimental results are compared to state-of-the-art calculations based on various mass models and approximations. In particular they are compared to calculations based on the Kratz-Herrman formula [26], to the FRDM+QRPA (finite-range Droplet model), a microscopic-macroscopic approach based on quasi-particle random phase approximation [27], and to recently developed calculations based on energy density functionals (D3C*) by Marketin et al [28].
The QRPA calculations, by Möller et al, are based on the FRDM+QRPA mass model and include first-forbidden transitions as a second order term developed within the Gross theory framework. The D3C* approach is instead based on fully self-consistent covariant density functional theory. The ground state of all nuclei is calculated using the relativistic Hartree–Bogoliubov model, and excited states are obtained within the proton–neutron relativistic quasiparticle random phase approximation. In this approach both Gamow–Teller and first-forbidden transitions are treated on equal footing.
Calculations are reported in figure 4 as open symbols (squares, diamonds and triangles) connected by full lines, while experimental values taken from literature [29] are shown with open circles. The results obtained in this analysis are shown as filled circles. The newly measured half-lives for the decays of 149–150Cs show a steeper decrease compared to the lighter isotopes in the chain.
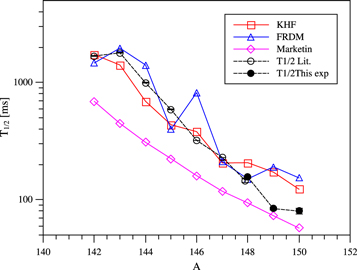
Figure 4. Comparison between experimental and theoretical half-lives for Cs nuclei ranging from A = 142–150. Experimental results are shown with dots: the open dots refer to literature data [29], while the filled ones are the values extracted in this analysis. The data are compared by theoretical predictions using the Kratz-Hermann formula (red open squares), the FRDM-QRPA approach (blue open triangles) and the D3C* approach based on energy density functionals (magenta open diamonds). See text for details.
Download figure:
Standard image High-resolution imageThough the macroscopic–microscopic approaches of KHF and FRDM+QRPA account well for the half-lives in the mass range A = 142–148, with one large deviation at mass 146, the new calculations by D3C*, which are underestimating the lighter masses, seem to better converge for the most exotic species. The authors note that their approach seems to better account for decays characterized by large Qβ windows, where mismatches between angular momenta of the ground state of parent and daughter nuclei become less important, owing to the larger number of available final states. The FRDM+QRPA approach has the distinctive feature to predict an odd–even staggering which is not usually present in the experimental data, as is the case also for this decay chain.
Marketin et al [28] predict that first-forbidden contributions would account for ≈50% of the total decay rate, with increased importance towards the most exotic species. Moreover, the half-lives and Pn values might be affected by the presence of strong non-axial, deformations. The role of γ softness has not been clarified so far by any detailed calculations, and would give more insight in many mass regions.
4. Fast-timing method with IDS setup
The possibility to detect the decay towards 148Ce offers us the chance to test our fast-timing set-up, thus validating the technique for future reference.
One of the experimental techniques used to extract the lifetime of a nuclear level is the so-called fast-timing technique, which is based on the measurement of the time difference between a transition feeding and a transition de-exciting a specific nuclear level. The γ transitions are detected in two different detectors, and the time difference is measured using a standard TAC electronic module. Lifetimes in the range between tens of ps to tens of ns are accessible by this technique. In order to clean the spectrum and isolate the contribution from a single level, additional coincidences on de-exciting γ transitions are required. Details on the fast-timing technique can be found in [16, 18, 30, 31].
Owing to their intrinsic fast response and to an energy resolution higher than other scintillator materials, small volume LaBr3(Ce) detectors are routinely used for fast-timing applications [17]. In the present experiment, two LaBr3(Ce) detectors were placed to the sides of the implantation point at ≈2 cm, and connected to a TAC module which was started by the signal coming from the central β detector. See figure 1 and section 2 for details. An additional time spectrum was constructed between the two LaBr3(Ce) detectors, using a dedicated TAC module.
Using standard calibration sources we carefully corrected for the effect of the time walk, which otherwise dominates the time resolution at the lowest energies. This is particularly important in our case since low-lying transitions in the nuclei of interest are expected to have energies below 200 keV.
The decay scheme of 148Ce shows discrete γ lines which can be easily disentangled using a LaBr3(Ce) detector: in particular the 158 keV level is fed by a transition at 295 keV then directly decays to the ground state [20]. The large statistics allows us to build coincidence matrices, where two of the axis are the energy spectra measured by the LaBr3(Ce) detectors and the third axis is the TAC spectrum.
A two-dimensional projection is shown in the left panel of figure 5. The axis are shown in the energy range spanning 80–250 keV (X axis) and 200–900 keV (Y axis) in order to enhance the coincidences with the above-mentioned low-lying transitions.
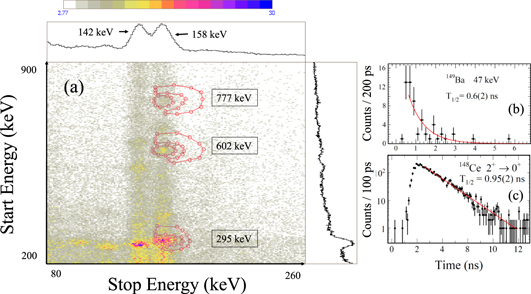
Figure 5. The left panel shows a two-dimensional  matrix obtained with coincidences between the two LaBr3(Ce) detectors. The X axis covers a range between 80 and 260 keV while the Y axis between 200 and 900 keV, in order to enhance the coincidences to the lowest-lying transitions belonging to the decay of 148Ce. In the bottom right panel the decay time spectrum for the 2+ state in 148Ce obtained from the β-LaBr3(Ce)–LaBr3(Ce) coincidences, as explained in details in the text, is shown, while the top panels show the decay time spectrum for the 47 keV line in 149Ba.
Download figure:
Standard image High-resolution imageFirst of all, the behavior of prompt transitions (602 and 777 keV) was extracted, and afterwards the time behavior of the level of interest was studied by gating on the coincidence, as it is shown by the two-dimensional gates in the left panel of figure 5. The time behavior of the background has been subtracted using the half-moon gates also shown in the spectrum.
The resulting decay spectrum is shown in the bottom panel to the right side of figure 5, which is then fitted by an exponential decay curve, resulting in the lifetime of the level under analysis. The fit is shown as a full line in the plot. The value extracted from this analysis is T1/2 = 0.95(2) ns, which is in agreement with the literature value of 1.01(6) ns [20].
5. Decay scheme of 149Cs  149Ba
149Ba

The actual knowledge of the decay 149Cs  149Ba comes from a previous study where the isotope has been identified and mass separated among fission fragments. No information on the de-excitation scheme is available [32]. A former attempt to populate this isotope has been performed at ISOLDE, not reporting any γ transitions [24].
The strongest transitions seen in the spectrum reported in figure 2 are the 168, 282, 316 and 343 keV lines. Two weak lines at 47 and 68 keV are also visible in the spectrum.
The high statistics collected for the internal decay of 149Ba allowed to perform  coincidence studies extending the level scheme up to 1 MeV. 149Ba being an odd–even nucleus, its decay is fragmented onto many final states, and transitions to the lowest-lying levels occur at very low energies. 30 transitions and 18 levels have been identified. Only the 279 keV transition does not show coincidences with other lines. It is visible in the total
  spectrum, and placed in the level scheme according to energy considerations.
The coincidence relations with the lines at 47, 68, 282 and 316 keV have been accurately analyzed and are reported in the four panels of figure 6. The 47 keV line is the decay from the first excited state to the ground state and is seen in coincidence with lines at 78, 190, 343 and 441 keV, thus defining the location of states at 124.8, 236.4, 316.4, 389.7 and 488.1 keV. All these states show a direct branching towards the ground state.

Figure 6. Example of coincidence spectra obtained gating on the transitions indicated in each panel. Main lines are labeled by their energy.
Download figure:
Standard image High-resolution imageThe 68 keV line depopulates the second excited state, showing coincidences with the transitions indicated in the second panel of figure 6. These coincidences define the location of the states at 164.7, 236.4, 279.1, 316.4 and 362.2 keV. Among these states only the 316.4 keV one decays towards both the ground and first excited states.
The coincidences with the 282 keV γ line have been carefully analyzed since several nuclei in this region show transitions at similar energies. In particular we wanted to discriminate the decay chain originated from the β-delayed neutron emission, populating state in 148Ba, where a 281 keV transition connects the 4+ state to the  state. In this gated spectrum we can clearly see γ lines belonging to the decay of 148Ba: the 142 keV transition is the 2+
  0+ and the 352 keV one is the
  4+ transition. Additional transitions are seen, giving confidence of the existence of the 282 keV transition in the decay of 149Ba. The 282 keV line is expected to directly feed the ground state, and is seen in coincidence with transitions at 206 and 383 keV, thus defining the location of the levels at 488.1 and 665.4 keV.
The strongest line seen in the  spectrum of figure 2 (top left panel) is at 316 keV. This transition is directly feeding the ground state, and is seen in coincidence with lines at 172, 347, 366, 596 and 601 keV. The presence of this transition confirms the location of the level at 316 keV, and the coincidences define states at 488.1, 665.4, 682.5, 911.2 and 917.6 keV.
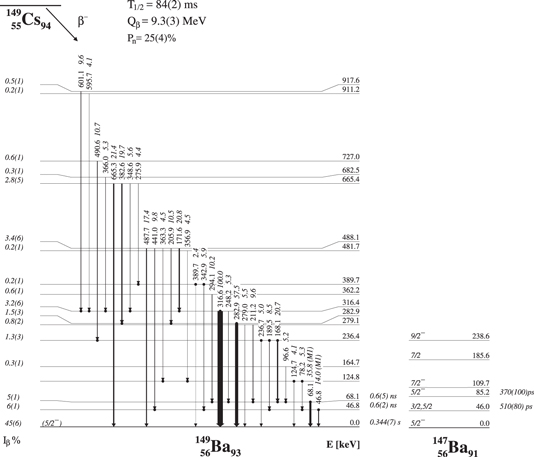
The analysis of the coincidence relations resulted in the level scheme reported in the left part of figure 7. Transitions are represented by arrows, whose width resembles the intensity measured in the  spectrum and are normalized to the most intense line at 316 keV. Dots indicate whether the transition was seen in coincidence with gamma rays feeding the initial state (if placed at the beginning of the line) or de-exciting the state (if instead placed at the end of the arrow). At variance from what is seen in the β decay of 147Cs and 145Cs we could measure the direct decay of the first two excited states, lying at 46.8 and 68.1 keV.
Figure 7. Proposed level scheme for the decay 149Cs  149Ba. The lowest part of the decay scheme of 147Ba is shown on the right-hand side of the figure for comparison.
Download figure:
Standard image High-resolution image
Absolute γ-ray intensities in 149Ba were extracted by normalizing the total number of decays to the number of daughter nuclei 149La and 149Ce, the normalization factor being 0.06(1). Literature values were used for Iγ (149Ce; 305.5 keV) = 3.2(3) [22]. The neutron emission probability,  for 149Cs, was extracted from the ratio of the total number of 148Ba and 149Cs nuclei using absolute γ-ray intensities in 149Ba and
  daughters 148La and 148Ce. Literature values were used for Iγ (148La; 415.8 keV) = 3.6(1) [21] and Iγ (148Ce; 158.5 keV) = 56(1) [20].
We could extract the lifetimes of the low-lying states in 149Ba even if the intensity of the lines is limited. To reduce the background,  -Time coincidences built using the high-resolution HPGe detectors were studied, gating on the feeding transitions. The time distribution between β and LaBr3(Ce) for the low-lying 47 keV transition is shown in the bottom panel to the right side of figure 5. The resulting value has been checked by varying the background subtraction and gating conditions, resulting in the reported value of 0.6(2) ns. A similar analysis was also performed on the transition at 68.1 keV, resulting in a half-life of 0.6(5) ns. The measured lifetimes rule out the possibility for these transitions to have an E2 characters, since the calculated B(E2) would be, in both cases, greater than 1000 W.u. As is the case for 147Ba also for these two transitions we propose an almost pure M1 multipolarity.
In the spectrum gated on the 68 keV transition no evidence for Ba x-rays is found, at variance from the other spectra. This would point towards an E1 character for the 97 keV line. The conversion coefficient for this multipolarity is, in fact, consistent with the non-observation of x-rays, while for higher order multipolarities, or in the case of M1 transitions, a contribution similar to what is seen in the other spectra is expected.
The conversion coefficients for the 46.8 and 68.1 keV transitions are calculated as 8.87(13) and 2.98 (5) respectively using BrIcc code [33] and assuming the transitions as pure M1. This is important in estimating the direct β feeding towards the first two excited states, which reduced the direct ground state feeding.
The apparent β feeding to the states (Iβ), reported on the left side of figure 7, have been evaluated starting from the γ-ray intensities corrected for the β and γ efficiency and conversion coefficients, to which the contribution going through the βn channel has been subtracted. They have to be regarded as upper limits, since a large contribution from pandemonium is expected owing to the large Qβ window and the high degree of fragmentation always present in even–odd nuclei.
6. Discussion
In the N = 93 isotonic chain including nuclei heavier than  Ba, such as
  Sm,
Sm,  Nd,
Nd,  Ce, no traces of octupolarity have been found, and the measured E1 decay strength can be attributed to a polarizing effect of the unpaired neutron [14]. Another common feature in these isotones is the ground state band
  being equal to
  , whose configuration is mainly driven by the 3/2−[521] orbital, while low-lying 5/2+ bands are mainly built on top of the 5/2+[642] deformed orbital.
Moving, instead, along the Z = 56 Ba isotopic chain, octupolarity is found to be present: the rotational bands in both 143Ba and 145Ba are consistent with calculations using octupolar deformations of the order of  , and the intrinsic structure of the low-lying states is dominated by the octupole deformed Nilsson orbitals ν[521]3/2, ν[523]5/2 and ν[660]1/2, resulting in
  = 5/2− ground state bands [11, 34].
147Ba was first interpreted as showing features different from the lighter ones, and a  = 3/2− spin parity was initially proposed [12], based on β-decay data. A thorough investigation of data coming from spontaneous fission of 248Cm changed this assignment to 5/2−, which can be constructed from the mixing of four neutron orbitals 1/2[541], 1/2[530], 3/2[532] and 3/2[521]. The higher-lying structures are also compatible with a non-axially symmetric deformation presenting sizable deformation parameter
  .
.
The properties of low-lying bands in both 145Ba and 147Ba suggest an admixture of parity doublets, therefore leading to the picture of octupolar vibrations rather than firm static deformations being responsible for octupolar correlations in these nuclei.
A comparison between the low-lying states of 149Ba to those of 147Ba is made in the right panel of figure 7: here one notices a close resemblance between the two decay schemes, suggesting that the 46.8, 68.1, 164.7 and 236.4 keV levels might have the same origin as the ones in 147Ba, therefore pointing to a possible  = 5/2− ground state also in this case. With the available data, however, we cannot rule out the
  = 3/2− option.
The multipolarity proposed for the low-lying transitions would attribute negative parity to the levels at 46.8 and 68.1 keV levels. On the contrary, if the 97 keV line would be confirmed to be an E1 transition, the level at 164.7 keV is expected to have opposite multipolarity to that of 68.1 keV.
7. Conclusions
In this contribution, recent results from an experiment devoted to study the isotopic chain of Ba with A = 148–149 via β decay have been reported. The experiment was performed with the IDS setup for fast-timing measurements. A steeper decrease of the half-lives of Cs isotopes starting from A = 148 has been seen, rendering the access to the coming isotopes more difficult.
The presence of transitions with known lifetimes was exploited to test the fast-timing method with the used set-up, and then used to analyze transitions in the newly studied 149Ba. The level scheme of 149Ba has been studied using  coincidences and shows close resemblances to the lighter odd isotopes. The promising results call for further analysis using angular correlations to firmly establish spins and parities of the states and give an insight on octupole correlations in the odd-A isotopes of Ba.
Acknowledgments
The authors are indebted to the memory of late Prof Henryk Mach whose experience helped in designing and performing the experiment. The authors would like to thank E Vigezzi for fruitful discussion and T Marketin for providing latest calculations to be compared to the data.
The IDS collaboration acknowledges financial support from: Istituto Nazionale di Fisica Nucleare, the Italian 'Programmi di Ricerca Scientifica di Rilevante Interesse Nazionale (PRIN)' contract number 2001024324 01302, the European Union's seventh framework through ENSAR, contract no. 262010, the European Unions Horizon 2020 Framework research and innovation programme under grant agreement no. 654002 (ENSAR2), the FATIMA-NuPNET network via the PRI-PIMNUP-2011-1338 project, the Spanish MINECO projects reference numbers FPA2013-41467-P AND FPA2015-646969-P, the German BMBF under contract 05P15PKCIA and 'Verbundprojekt 05P2015', the FWO-Vlaanderen (Belgium) and the IAP Belgian Science Policy (BriX network P7/12). VCh and ZP acknowledge support by the polish grant of Narodowe Centrum Nauki nr 2015/18/M/ST2/00523.