

Abstract
In this study, ammonia (NH3) vapor was added to an atmospheric pressure argon plasma jet generated by a sinusoidal power supply (with an applied voltage of 4 kV and frequency of 35 kHz) and it was analyzed by electrical, optical, and chemical probe measurements. A total gas flow rate of 1200 sccm under 2% flow rate of either water or ammonia solution at concentrations up to 0.75% mixed with 98% argon feeding gas. The dissipated power of the plasma jet estimated by voltage-charge plots was found to decrease continuously with increase in ammonia concentrations at a fixed applied voltage. The optical emission spectra inside the quartz tube obtained for the NH3 mixed plasma indicated the presence of nitrogen emission lines which were absent in the water only mixed argon plasma. Colorimetric measurements of hydrogen peroxide (H2O2) and nitrite ( ) in plasma activated water (PAW) were performed at different consumed energy varied by plasma exposure time. The H2O2 concentration decreased to 4 ppm from 14 ppm, while the
  concentration simultaneously increased to 6 ppm from 1 ppm as the ammonia concentrations increased to 0.75% from 0% throughout 2.07 × 10³ joule energy consumption. We also analyzed the corresponding variation of pH values, in absence of ammonia, PAW leads to acidification but addition of small amount of ammonia in plasma is sufficient to make it alkaline. Additionally, we measured the hydroxyl (OH) radical density in gas and liquid phases by utilizing UV absorption spectroscopy and chemical probe method, respectively. OH radical density in both phases also decreased with the increase in the NH3 concentrations. Experimental results obtained from this experiment can be attributed to control H2O2 concentrations in the PAW via plasma-assisted nitrification.
Export citation and abstract BibTeX RIS
1. Introduction
Over the last few decades, non-thermal atmospheric pressure plasma sources (NTAPPs) have received enormous attention due to their diverse applications in various fields, such as plasma assisted combustion [1–3], material processing [4, 5], agriculture [6, 7], plasma-assisted biomedical applications [8–11], plasma-assisted nitrogen fixation [12–16], and pollution control [17–19]. The key main purpose of plasma in these fields is to generate various types of reactive oxygen species (ROS) like hydroxyl radical (OH), atomic oxygen (O), singlet oxygen (1O2), and hydrogen peroxide (H2O2), reactive nitrogen species (RNS) like excited ( ), and amine (NH2) and reactive oxygen and nitrogen species (RONS) like nitric oxide (NO), nitrite (NO2), nitrate (NO3), and peroxynitrite (ONOO–) [20–24]. These species are produced through the interaction of energetic electrons, ions and excited species with ambient gases.
In many applications of NTAPPs, most of these reactive species are generated simultaneously [20, 22]. Some of the reactive species may not be useful for intended application. For example, selective production of nitric oxide, nitrite and nitrate can be beneficial in agriculture to get more crop yield as these species are considered the major source of nitrogen for protein synthesis [25]. But, NTAPPs also produce abundant H2O2 which might not be necessary and harmful to growth of crops [26]. One the other hand, reasonable concentrations of H2O2 could be beneficial in both agriculture and plasma medicine because it involve in chemical and physiological behaviors in cells, such as signaling pathways [27–29] but their high doses result in oxidative stress, which is an adverse process that can be an important moderator for the damage of cellular structures and DNA [21, 22]. Customizing the production of a particular type of reactive species is of crucial importance for efficient and targeted application of plasma sources.
Several researchers have taken the initiative to control the production pathways of reactive species in plasma phase and liquid phase [30–33] but until now control H2O2 by utilizing ammonia (NH3) oxidation has hardly been discussed. NH3 is a common inorganic substance existing in the environment and it can be oxidized into nitrite through nitrification process [34, 35]. Nitrification is a two-step process, the first stage involves the oxidation of NH3 to  , and in the second step, the
  formed is rapidly oxidized to
  . Avoiding the traditional approach, ammonia oxidation process was performed through the direct photo-oxidation [36], electrochemical oxidation [37], ozone oxidation [38], catalytic oxidation [39], and using OH radicals formed through the photocatalytic decomposition of ambient H2O2 [40]. Various studies also suggested that ammonia could be decomposed into NH2 and NH via dielectric-barrier discharge (DBD) plasma [18, 41].
The development of a method for the oxidation of ammonia to nitrite using the plasma and plasma generated reactive species is very important. In this paper, we present the experimental results of the plasma-assisted nitrification by adding a mixture of aqueous ammonia at concentration up to 0.75% in argon plasma (Ar/NH3) and it is compared with the argon plasma jet mixed with water only (Ar/H2O). The Ar/NH3 plasma jet is capable of controlling the concentration of H2O2 in plasma-activated water (PAW) by utilizing nitrification. The effect of Ar/NH3 plasma on the concentrations of H2O2 and  is investigated by varying the concentrations of liquid ammonia present in the feeding gas. Our experimental results clearly show that the concentration of H2O2 and
  can be precisely tuned in the PAW by the addition of ammonia into the plasma jet.
This paper is organized as follows: first, we present the experimental setup and methodology in section 2. In section 3, the main results obtained with and without addition of ammonia in the Ar feeding gas are discussed. The chemical pathway of interaction between ammonia and product of plasma are discussed in section 4. Finally, the main conclusions are explained in section 5.
2. Experimental setup and methodology
Figure 1 shows a schematic of the experimental setup. A plasma jet was fabricated by inserting a stainless-steel needle electrode (with length of 35 mm, outer diameter of 0.9 mm, and inner diameter of 0.6 mm) inside a quartz tube (with length of 190 mm, outer diameter of 3 mm, and inner diameter of 1 mm). The peripheral region between the top of the quartz tube and the needle electrode was sealed by Torr-seal. The working gas enters the quartz tube through the opening of the needle electrode. A custom-made DC to AC inverter, with a repetition frequency of 35 kHz, was used as a driving source to generate the plasma. For grounding, copper tape (with width of 3 mm) was wrapped around the quartz tube at a position 20 mm below the tip of the needle electrode. When an alternating sinusoidal voltage of ~4 kV (rms) was applied, plasma was generated within these two electrodes inside the quartz tube, and which further propagated along the quartz tube to reach under ambient atmospheric pressure condition. The total gas flow (Qt) was continuously maintained at 1200 sccm, 98% argon and 2% water vapor (Ar/H2O) or 98% argon and 2% ammonia vapor (Ar/NH3) with concentrations in the range of 0.25–0.75%, volume by volume, by using a mass flow controller (MFC). The gas flow had two branches, one branch was directly connected to pure argon gas (QAr) and the other branch was routed through a bubbler system containing ammonia solution to obtain the mixtures of argon and ammonia vapor (QV). Thus, the total feeding flow into the plasma jet is Qt = QAr + QV. The temperature of the bubbler system was maintained below room temperature to prevent the premature vaporization of ammonia from the water. To provide sufficient dissociation of ammonia molecules resulting from the collisions along the plasma plume, the plasma was allowed to propagate within a length of 155 mm from the end of the needle to the nozzle of the quartz tube. The plasma plume with cross-sectional area of 0.031 cm2 was directly irradiated on the surface of 2 ml deionized (DI) water which is located at a distance of 1 mm from the tip of the quartz tube and PAW was formed.
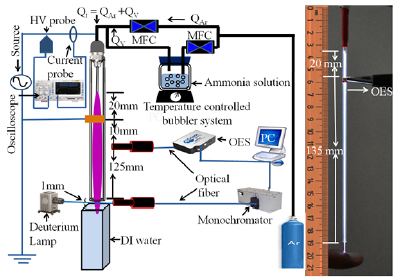
Figure 1. A schematic drawing of the experimental setup along with the photograph of plasma produced at temperature close to room temperature.
Download figure:
Standard image High-resolution imageThe optical emission spectra (OES) of the plasma jet were measured by HR4000 + CG-UV-NIR (Ocean Optics, Inc.) spectrometer and the discharge waveform was acquired LeCroy wave surfer 434 MHz oscilloscope by using Tektronix P6015A high-voltage (HV) probe and a LeCroy CP030 current probe at a position as shown in figure 1. The (UV) absorption spectroscopy [20, 42, 43] was applied to detect the OH radical density at 1 mm position above the surface of DI water (just outside the nozzle of the quartz tube). OH radicals decay by absorbing UV light [20, 42, 43]. In this method, the density of the OH radical can be calculated using the comparison of transmitted signal (I) of UV passed through the plasma with those of incident signal (Io) coming from UV source (deuterium lamp). The OH radical density in gaseous phase at several ammonia admixture to the plasma jet was calculated using the Beer–Lambert's law as [20, 42, 43]:

where n is the OH radical density, σ is absorption cross-section of the OH radicals, and x = 1 mm is the absorption length (length of the plasma travelled by the UV light). The value of the absorption cross-section for OH radicals is 1.2 × 10⁻¹⁶ cm2 at 309 nm [20, 42–44]. In addition, for the measurement of OH radical density in the liquid phase, we utilized terephthalic acid (TA) as a chemical probe. This probe has been widely used for the detection of OH radicals [45–47]. The OH radical density was measured at 10 mm below the surface of the liquid using the same methodology that in our previous work [47].
To determine the concentrations of H2O2 and  in the PAW, colorimetric measurements were performed. Colorimetric assay reagents provided by BioAssay Systems were used for the detection of H2O2 and
  at their absorbance wavelengths of 585 and 540 nm, respectively. For the accurate measurement of these sample species, their color intensities were measured. The concentration of species in the PAW can be determined from the calibration curves obtained from the absorbance of known concentrations. Similarly, QuantiFluo™ Ammonia Assay Kit (DNH3-200) was used to measure the concentration of dissolved ammonia in PAW. This assay is based on an improved o-phthalaldehyde method, where the reagent reacts with ammonia and forms a fluorescent product. The fluorescence intensity (λex/em = 360/450 nm) is proportional to the ammonia concentration, which can be determined from the instructions by the manufacturer.
3. Results
3.1. Electrical and optical characteristics
Figure 2(a) shows the typical current and voltage waveforms of the discharge. The discharge current (I) was calculated by subtracting the displacement current from the total current. The positive current peaks appear in the rising region of the applied voltage (V), and they result in the accumulation of charges (Q) inside the quartz tube. These accumulated charges are released in the negative region of the applied voltage producing discharge current peaks in the negative direction. The corresponding Q–V plot (Lissajous figure) of dotted region within one period in figure 2(a) is shown in the inset of figure 2(b). The Lissajous figure appears as a closed loop, and the dissipated power was calculated using the area enclosed within this loop [48] as:
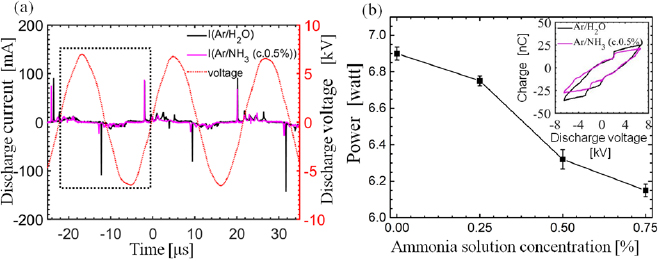
Figure 2. Electrical characteristics of the discharge. (a) Current and voltage waveforms of the discharge versus time. (Gas flow rate in the main tube: 1200 sccm (98% argon +2% water and 98% argon +2% ammonia solution at 0.5% concentration) and (b) power dissipation as a function of ammonia concentrations present in the solution mixed with feeding gas).
Download figure:
Standard image High-resolution imageThe effect of ammonia concentration present in the plasma jet on dissipation power is shown in figure 2(b). The dissipated power for Ar/H2O was determined to be 6.9 watt and it was observed to decrease continuously with increase in ammonia concentrations present in the solution mixed with feeding gas. The dissipated power dropped to 6.15 watt at ammonia concentration of 0.75% in Ar/NH3 plasma. Similarly, power density over the area of plasma which is directly in contact with DI water was calculated to be 219.75 Watt cm−2 in Ar/H2O plasma and for 0.25%, 0.5% and 0.75% of ammonia concentration in Ar/NH3 plasmas, the power densities are estimated to be to 214.97, 201.27, and 198.85 Watt cm−2 respectively. The peaks of the discharge current were measured to be smaller in the Ar/NH3 plasmas than in the Ar/H2O plasma, which results in a lower power dissipation.
To investigate the dissociation of ammonia by plasma and the formation of various ROS and RNS in the plasma discharge region inside the quartz tube, the OES were obtained at a position of 10 mm below the grounded electrode. Figure 3 shows the OES of Ar/H2O plasma (indicated by black lines) and Ar/NH3 plasma (indicated by pink lines) at ammonia concentration of 0.5% over the wide wavelength range (200–1050 nm). It can be seen that the emission intensities of nitrogen species (N2 SPS) in the Ar/NH3 plasma are significantly higher than that in the Ar/H2O plasma. For better visualization, the range of 300–380 nm is magnified and the intensities in the two conditions are compared in the inset graph of figure 3. The spectra of the Ar/NH3 in this region are similar to that of argon mixed with a small amount of nitrogen [44, 49, 50], even though no nitrogen was used in this experiment. These lines originate from OH,  , NH, and other species. The emission line at 309 nm is attributed to be from OH radical species corresponding to the transition A2Σ+(v'' = 0)–X2Π(v'' = 0) [20, 47, 51], whose formation mainly controlled by the water vapor present in the feeding gas. Close to 326 nm and 336 nm, the two lines of NH(A3Π(v' = 0)–X3Σ−(v'' = 0)) and NH(A3Π(v' = 1)–X3Σ−(v'' = 1)) [44, 49–54] are observed. The prominent molecular nitrogen lines in the 300–390 nm spectral region include bands from the second positive systems (N2(C3Πg–B3Πg)) at315.9, 337.1, 353.6, 375.4, and 380.5 nm and from the first negative system of (
 (B2
(B2 –X2
–X2 )) at ~400 nm [50, 51, 53]. These species are in accordance with decomposition of the ammonia vapors mixed with feeding gas in this experiment.
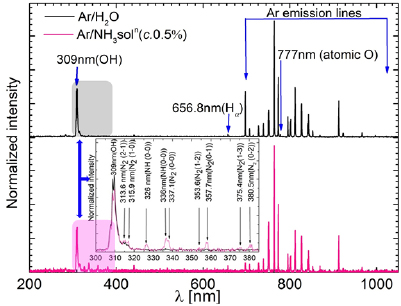
Figure 3. Normalized OES of the water mixed argon plasma and its comparison with ammonia mixed argon plasma. [Gas flow rate in the main tube: 1200 sccm (98% argon +2% water and 98% argon +2% ammonia solution at 0.5% concentration) and applied voltage: 4 kV(rms)].
Download figure:
Standard image High-resolution image3.2. Measurement of H2O2 and  concentration in the PAW

In the subsequent experiments, we studied the effect of dissipated energy varied through the plasma exposure time on the concentration of H2O2 and  in the PAW with Ar/H2O and Ar/NH3 plasmas. Figure 4(a) shows the concentration of the H2O2 in the PAW as a function of energy at several ammonia admixtures to the argon feeding gas. The concentration of H2O2 continuously increased as the energy increased for all plasmas but a significant decrease in the concentration of H2O2 was observed when the ammonia was mixed in the feeding gas, compared to that in Ar/H2O plasma for all energy consumption. As the ammonia concentration increased to 0.75% in the Ar/NH3 plasma from 0% in the Ar/H2O plasma, the H2O2 concentration decreased to 4 ppm from 14 ppm after 2.07 × 10³ joule energy consumption.
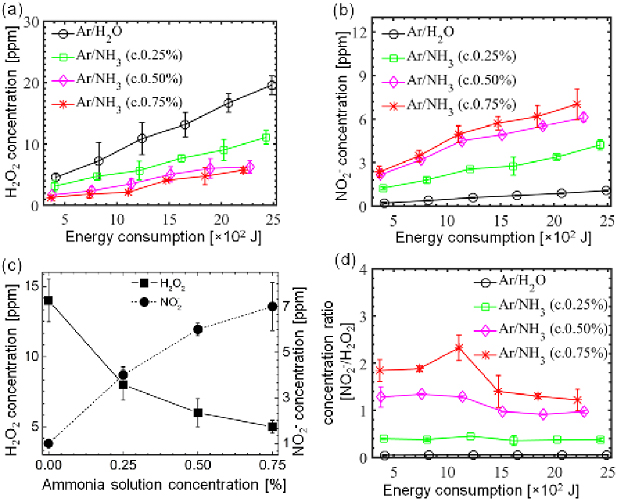
Figure 4. Effect of the consumed energy varied by plasma exposure time in the (a) H2O2 (b)  concentrations in PAW at several ammonia concentrations, (c) change in H2O2 and
  concentrations in PAW versus ammonia concentration at a constant consumed energy of 2.07 × 10³ joule (d) the variation of
  to H2O2 concentration ratio in PAW with consumption energy at different ammonia concentrations.
Download figure:
Standard image High-resolution imageIn addition, we investigated the corresponding concentrations of  in the PAW shown in figure 4(b). The
  concentration increased slightly with the dissipated energy increased by plasma exposure time from 1 to 6 min; however, it increased drastically with the addition of ammonia in the solution mixed with the feeding gas, in comparison with the Ar/H2O plasma. A further increase in the concentration of ammonia resulted in a further increase of the concentration of
  . This was found to be true for all Ar/NH3 plasmas. The measured
  concentration also increased from 1 to 6 ppm when the ammonia concentration increased from 0% to 0.75% at the 2.07 × 10³ joule energy consumption. The change in the H2O2 and
  concentration in the PAW at all ammonia admixtures throughout a constant energy consumption value 2.07 × 10³ joule energy is also shown in figure 4(c). As can be seen in figure 4(c), the decrease rate of H2O2 was tracked by the enrichment of the production rate of
  . As the ammonia concentration increased from 0% to 0.75% in the feeding gas, the H2O2 concentration decreased by 64% and the
  concentration increased by about seven times, compared to that in the Ar/H2O plasma.
Furthermore,  to H2O2 concentration ratio (
 ) in PAW was calculated at different consumed energy differed by plasma exposure time in both Ar/H2O and Ar/NH3 plasmas in order to estimate the dominancy of
  and H2O2. From figure 4(d), it is clear that the concentration ratio is almost independent with energy consumption but it is greatly affected by concentrations of ammonia admixtures feeding gas. The average
  to H2O2 concentration ratio in the PAW sharply increased from 0.03 to 1.70 with the increase in the ammonia concentration from 0% to 0.75%. Particularly, due to the low level of mixing of the ambient atmospheric air with the plasma, the
  concentration in the liquid was significantly lower than the H2O2 concentration without ammonia admixture, whereas the ammonia water converted the dominancy of H2O2 to
  . This noticeable increase in the concentration of
  can be attributed to the oxidation of ammonia, which is discussed in section 4.
3.3. pH measurement
Figure 5(a) shows the pH value of the PAW as a function of the dissipated energy varied through the plasma exposure time at several ammonia concentrations in the solution mixed with feeding gas. The pH value of Ar/H2O plasma treated water dropped significantly from 6.5 to 4.1 after the 2.07 × 10³ joule energy consumption, implying that the water had undergone acidification. Similar results have been presented by a previously published study [55]. The decrease in pH resulted from the exposure of plasma to DI water at room temperature, as the H2O2 was mainly produced in the PAW. In addition, when the ammonia concentrations in Ar/NH3 plasma increased to 0.25%, 0.5%, and 0.75%, the pH values increased to 7.69, 8.12 and, 9.18, respectively, after the same energy (2.07 × 10³ joule) consumption. This increase in pH may be due to the deposition of dissolved ammonia in the PAW. The ammonia concentrations in the PAW are shown in figure 5(b). For the Ar/H2O plasma, the concentration of the ammonia was nearly zero, because no ammonia was formed by the plasma. For the Ar/NH3 plasma at ammonia concentrations of 0.25%, 0.5%, and 0.75%, the concentrations of ammonia in the PAW were measured as 3, 6, and 30 ppm, respectively, after the 2.07 × 10³ joule energy consumption.
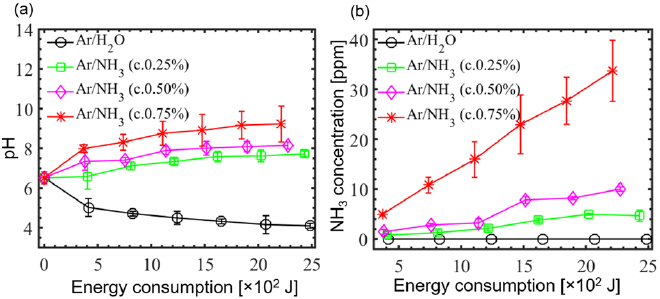
Figure 5. (a) pH value of the PAW. The flow rate in the main tube is 1200 sccm (98% argon + 2% ammonia vapor at different concentrations), (b) residues of unreacted ammonia in the PAW for the same conditions as that in (a).
Download figure:
Standard image High-resolution image4. Discussion
There are several possible pathways that can result in the decomposition of ammonia [56, 57]. From ammonia, via collisional excitation, ionization, and penning ionization, NH2 and NH radicals can be produced in the plasma. The classical model of discharge chemistry for the decomposition of ammonia in argon have been summarized in various studies [56–58]. It is well known that the electron is crucially important in the mechanism of radical species generation. The formation of excited nitrogen species within the plasma during the Ar/NH3 gas flow can be defined by the following reactions [56–58]:


Furthermore, the penning ionization reaction between metastable argon  and NH3 in plasma phase results in NH and NH2 formation as [57]
The formation of OH radicals inside the quartz tube can occur by the dissociation of water molecules via collisions with electrons or metastable argon atoms as [20, 43]


For the OH radicals at the gas–liquid interface the penning ionization reaction is possible via the reactions [20, 43]


For the OH radicals below the liquids, the UV photolysis can be activated via the reactions [20, 43, 59]


The OH radicals formed by the reactions in equations (12), (14), and (16) are combined to form H2O2 via the reaction [20, 43, 47]

Several advanced oxidation technologies have been developed to oxidize ammonia. The common characteristics of all these technologies are that the oxidation processes involve OH radicals. The pathway of the oxidation of ammonia by OH radical from the H2O or H2O2 photolysis is explained by the following expressions [40, 60].


In this dissociation pathway, it has been demonstrated that when ammonia reacts with OH, it can be oxidized to NH2 both in the gas and liquid phases. Then, NH2 from the reactions (6), (8), and (18) can be rapidly oxidized to NHOH in the presence of H2O2 in water. Once formed, NHOH can rapidly decay into  and then,
  splits into
  due to its unstable nature in water [40, 60]. Furthermore, The formation of hydrox- ylamine (NH2OH) also opens a route to further oxidation products such as
  in alkaline solution [60, 61]. In these pathways, OH radicals suggested as an oxidant for nitrification to achieve reasonable
  production efficiency. Zhang et al [62] reported that nitrogen and oxygen admixture to a argon can be another plasma source to increase the production rate of
  in a PAW like Ar/NH3 plasma but we observed the decreasing trend of H2O2 and acidity in Ar/NH3 plasma, which are opposite to those nitrogen and oxygen mixed argon plasma.
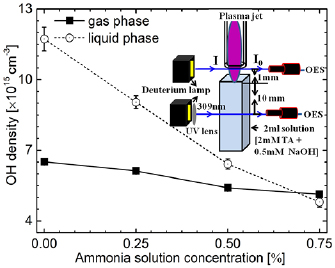
Water molecules flow rate in Ar/H2O plasma jet is ~6 × 10²⁰ molecules min−1, only few of them ionized into OH radicals as explained in reactions (9), (12), (14), and (16). These OH radicals are used as an oxidant for nitrification so decreasing trend of the OH radicals with increase in ammonia concentration is measured in both gas and liquid phase, which is shown in figure 6. In this graph, the OH radical density is measured as a function of the concentration of the ammonia concentrations. As the ammonia concentration present in the solution mixed with feeding increased from 0% to 0.75%, ammonia flow rate was also estimated to increase from 0 to 5.58 × 10¹⁸ molecules min−1. Due to this increase in ammonia flow rate, the OH radical density in gas and liquid phase was reduced to 5.13 × 1015 cm−3 and 4.08 × 1015 cm−3 from 6.51 × 1015 cm−3 and 1.17 × 1016 cm−3, respectively. Decreasing trend of OH radical density in liquid phase is significantly more than in gas phase, these results indicates that, reactions (18) and (20) is more active in aqueous phase than in gaseous phase, however due to complexity of solution it is difficult to predict exact pathways.
Figure 6. Variation of OH radical density in gaseous and liquid phase as a function of the ammonia concentrations present in the solution mixed with argon feeding gas.
Download figure:
Standard image High-resolution image
The ammonia flow rate was estimated to be quite higher than the electron density in this experiment. Electron density was measured to be approximately 7.00 × 1013 cm−3, using a measurement method similar to that in our previous work [44]. The ammonia probably not fully decomposed by plasma electrons into NH or NH2. Furthermore, the density of the OH radical species was approximately 5.13 × 1015 cm−3 in this experiment; thus, most of ammonia was also not oxidized by OH and H2O2 in the gas phase or at the gas–liquid interfacial regions so they remain as a dissolved residue in the PAW. The dissolved ammonia is alkaline in nature. Results, the pH of the PAW increased with the concentration of ammonia mixed with the feeding gas and the plasma exposure time. The ammonia deposited in the PAW treated by the Ar/NH3 plasma at an ammonia concentration of 0.75% is analogous to the idea presented by Xia et al [18], who suggested that the ammonia oxidation via DBD plasma is more efficient at low ammonia flow rates.
Non-thermal atmospheric pressure plasma jets operated in ambient environment generate a variety of reactive oxygen and nitrogen species (RONS) which are known to affect many biological and agricultural applications. Most of the RONS are generated simultaneously and some species may give rise to negative effects for an intended application therefore various research has been performed in order to increase and control their concentrations. In certain applications, the H2O2 generated in the discharge process needs to be controlled. Despite the complexity of solution and reaction pathways, we proposed a new method with the advantage of not only neutralizing the concentration of H2O2, but increasing the formation of  in the PAW, which is superior to the conventional OH radical scavenging methods. In this work, ammonia oxidation is not only viewed as a nitrification but also considered together with a new approach to control H2O2 concentration in PAW. The addition of a very small fraction of ammonia with working gas may be useful to some biomedical applications but its high concentrations, such as ~5.58 × 10¹⁸ molecules per min, are not suitable for biomedical applications; however, this estimated ammonia flow can be beneficial in agriculture because nitrification is essential process to mobilizes nitrogen because nitrite are much more mobile in soils than ammonia and ammonium (
 ); thus, it becomes more suitable for plant uptake [34, 35].
5. Conclusion
Our experiments demonstrate the effect of ammonia water admixture to the argon plasma jet which was analyzed through electrical, optical, UV-absorption spectroscopy, and chemical probe measurements. The observation of OES inside the quartz tube indicated the presence of nitrogen emission lines from the second positive systems, the first negative system, NH, and NH2 in ammonia mixed argon plasma jet which was not observed in water only mixed argon plasma jet. In addition, decreasing trend of dissipation power, OH radical density and H2O2 concentration in PAW were measured with increase in the ammonia concentration present in the solution mixed with the argon feeding gas but  concentration and pH value in PAW were found to increase simultaneously. The OH radicals were used as oxidants of ammonia and also major precursors for the formation of H2O2 therefore their decreasing trends were measured. Further, NHOH and NH2OH were formed when ammonia and its derivatives (NH2 or NH) were oxidized. The splitting of NHOH and NH2OH in the liquid phase was possibly important for the enhancement of
  production. This research opens boundless opportunities in plasma-assisted nitrification.
Acknowledgments
This work was supported by a grant (NRF-2016K1A4A39- 14113) from the National Research Foundation of Korea (NRF) and in part by the Kwangwoon University 2019, Korea.