Abstract
The design optimization through modeling of a thinned bulk-PZT-based vibration energy harvester on a flexible polymeric substrate is presented. We also propose a simple foil-level fabrication process for their realization, by thinning the PZT down to 50 μm and laminating it via dry film photoresist onto a PET substrate at low temperature (<85 °C). Two models, based on analytical and finite element modeling (FEM) methods, were developed and experimentally validated. The first, referred to as the hybrid model, is based mainly on analytical equations with the introduction of a correction factor derived from FEM simulations. The second, referred to as the numerical model, is fully based on COMSOL simulations. Both models have exhibited a very good agreement with the measured output power and resonance frequency. After their validation, a geometrical optimization through a parametric study was performed for the length, width, and thicknesses of the different layers comprising the device. As a result, an output power of 6.7 μW at 49.8 Hz and 0.1 g, a normalized power density (NPD) of 11 683 μW g−2 cm−3, and a figure of merit (FOM) of 227 μW g−2 cm−3 were obtained for the optimized harvester.
Export citation and abstract BibTeX RIS
1. Introduction
The increasing use of portable and ultra-low power smart wireless devices consuming less than 100 μW continues to boost interest in energy harvesters that could provide autonomy for extended periods of time. They could either recharge or completely replace electro-chemical energy sources such as batteries, thus reducing maintenance/replacement costs, and enabling the realization of smart systems placed at remote and/or isolated locations. The piezoelectric principle for energy conversion is favored for micro-sized devices, due to its achievable small dimensions and its high power density [1–5]. Among different transduction mechanisms, resonant vibration harvesters are widely investigated in the literature due to a greater power generation from ambient sources [5]. Compact and functional MEMS piezoelectric energy harvesters based on thin and thick piezoelectric materials have been demonstrated.
Thanks to MEMS fabrication processes and the relatively high electromechanical coupling, different active piezoelectric materials have been integrated onto rigid silicon cantilevers; of those, one can cite sputtered aluminum nitride (AlN) [6–8], deposited thin film lead zirconate titanate (PZT) [9–12], screen-printed thick PZT [13, 14], and thinned bulk-PZT [15, 16]. Besides the silicon industry, the plastic and printed electronics industry is starting to establish itself. A new class of smart sensing objects or large area surfaces is emerging thanks to the use of polymeric foil with unique characteristics. Energy components such as flexible solar cells, batteries, and supercapacitors are currently under development [17–19], with some commercial examples already available. The realization of mechanical energy harvesters on flexible or elastomeric substrates has gained a lot of attention recently. The fabrication processes of vibration harvesters on flexible substrates using screen-printed PZT on polyimide [20], coated polyvinylidene difluoride (PVDF) on PET substrates [21, 22], and the transfer of bulk-PZT onto PET [23] have been reported. The latter takes advantage of the excellent piezoelectric properties of commercially available bulk piezoelectric ceramics. More recently, interest has increased in fully flexible energy harvesters employing bending modes instead of resonant modes, to be used in low-frequency and on-body applications. Such configurations typically use zinc oxide (ZnO) and PZT as vertically aligned nanowires (NWs) [24–26], transfer-printed nano-ribbons [27], and transfer-printed PZT onto polydimethylsiloxane (PDMS) substrates [28].
In this work, we combine the superior piezoelectric properties of bulk-PZT [16, 29, 30] with PET polymeric substrates towards the realization of vibration energy harvesters to achieve high power densities at low frequencies (<50 Hz). A cost-effective, foil-based, and low-temperature fabrication process was developed which is based on the lamination of thinned bulk-PZT (50 μm) onto a flexible PET substrate at low temperatures. Models are required to geometrically optimize the harvester structure in order to maximize its output power and further reduce its resonance frequency. Some groups have already presented analytical models describing the mechanical and electrical behavior of vibration cantilever harvesters [31–37], accounting for point proof masses and the back-coupling effect. However, the combination of the back-coupling effect with a distributed model of the proof mass to determine the mechanical and the electrical harvester performance has not been addressed yet. The two models presented here account for a distributed mass at the free end, the back-coupling effect, and the additional stress-charges generated in the anchor region. The first model, referred to as the hybrid model, is based on the Euler–Bernoulli beam theory used by Ertuk [31–33]. Additionally, it is further extended by considering the distributed mass used in the multi-span theory [38], and combining it with the back-coupling effect and FEM simulations proposed individually by other authors [34, 37]. The presented model allows for optimization of the mass/beam ratio, which was shown to have an important influence in the output power and resonance frequency of the harvester.
The second, referred to as the numerical model, was developed entirely using FEM simulations in COMSOL, integrating the piezoelectric and the electric circuit modules. Both models (hybrid and numerical) were validated with experimental data. Finally, in addition to the geometrical optimization of the structure for maximum output power generation at a minimized frequency, the electrical and mechanical characterization of fabricated optimal devices are presented and compared to the developed models.
2. Design and methodology
The vibration energy harvester presented is a unimorph cantilever beam with a rectangular cross-sectional area and a proof mass located at the free end. It consists of a piece of thinned bulk-PZT (d31 mode) laminated onto a flexible polymeric substrate (polyethylene terephthalate—PET) at low temperature (<85 °C). Figure 1 provides the design and the dimension nomenclature which will be used throughout this document. Two modeling approaches were followed to design and optimize the harvesters in terms of power at both low frequency and low acceleration.
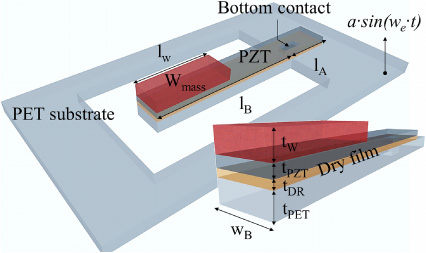
Figure 1. Schematic representation of the vibration energy harvester, illustrating the multi-layer structure and the dimension nomenclature.
Download figure:
Standard image High-resolution imageThe hybrid model is a combination of analytical equations calculated using MATLAB and a simulated correction factor (α) from COMSOL simulations. The correction factor is included to account for the extra stress-charges generated in the anchor electrode area (A) that are excluded by the hybrid model, which assumes perfect clamping at one end of the beam (figure 2(a)).

Figure 2. Schematic representation of (a) the hybrid model and (b) the numerical model using analytical and FEM modeling, respectively.
Download figure:
Standard image High-resolution imageThe numerical model calculates all of the output variables using only COMSOL simulations, which allows evaluation of more complex geometries and clamping conditions. This model implements clamping boundaries that are more realistic by including an anchor region connected to a rigid substrate (figure 2(b)). The anchor electrode area (A) directly includes both the extra capacitance and the additional stress-charges generated.
Following the fabrication of the first generation of harvesters used to validate the models and to quantify the damping coefficients, a geometrical optimization was performed that considered the length, width, and thicknesses of each of the layers to achieve high power at low frequencies. Based on the optimal dimensions, a second generation of devices was fabricated and compared once more to the developed models to corroborate their validity and the design approach.
3. Materials
The vibration energy harvester is composed of an active layer of bulk lead zirconate titanate (PZT) laminated onto a flexible polyethylene terephthalate (PET) substrate (Melinex® ST506, 125 μm thick from DuPont©). Both layers were assembled together using the dry film photoresist (DP) PerMX3014 (14 μm thick) from DuPont. The PZT layer is PSI-5H4E® (127 μm thick), from Piezo Systems©, Inc. (Massachusetts, USA), which comes in the form of a sheet (7 × 7 cm2). Vacuum sputtered nickel (Ni) electrodes were pre-deposited on both sides (100 nm thick). The piezoelectric ceramic presents extremely low current leakage and low magnetic permeability, with a relative dielectric constant of 3800 (when mechanically free). The PZT thickness was thinned down from 127 μm (initial value) to 75 μm and finally 50 μm in order to enhance the output power and to reduce the resonance frequency for the same lateral device dimensions. The dry adhesive ARClear 8932®, from Adhesives Research Inc., was used both to attach the fabricated harvesters onto rigid copper-clad glass-reinforced epoxy (FR-4) substrates for characterization purposes, and to fix the proof mass (a tungsten (W) sheet 500 μm thick) to the beam. The electrical contacts to the Ni electrodes were made using silver-filled epoxy glue (EPO-TEK H70E®), from Epoxy Technology Inc., and wire soldering.
4. Modeling and experimental methods
4.1. Hybrid model
The hybrid model combines analytical equations and a correction factor from COMSOL simulations. The analytical side associates already existing theories into a more complete vibration energy harvester model. The equations describe the mechanical and electrical behavior of the harvester, combining the back-coupling effect [31] and the distributed mass model at the free end [38]. This implementation is not trivial, since the mass locally modifies the neutral plane, the moment of inertia, and thus the deflection profile of the beam [38].
The analytical development is based on Euler–Bernoulli beam theory [31, 32], which describes the deflection of the beam as a function of position and time in response to an external force [33, 39–41]. The cantilever is excited by both the movement of its base and the inertia of the beam and mass combined [31, 42]. Besides enlarging the beam deflection, the mass creates a high stress region along its inner edge, improving the charge generation. All the equations were implemented and numerically solved using MATLAB scripts for static and harmonic acceleration regimes in the vertical direction (z-axis).
To begin with, the multi-layer cantilever was transformed into an equivalent two-span beam system which accounts for the distributed mass at the free end [38], as shown in figure 3. This transformation is the core of the analytical approach dividing the beam into two blocks (b1, b2) in the vertical direction at the point where the mass starts. Each segment is represented by its equivalent bending stiffness (EI1,2), calculated from the material properties and their respective dimensions, as follows [43]:


where h1,2 is the neutral plane with respect to the z-axis for each block, EMAT, AMAT, wMAT, and tMAT are the Young's modulus, the cross-sectional area, the width, and the thickness of the respective materials, zMAT is the distance from the bottom plane to the center of each material, and IMAT1,2 is the inertia for each material in each of the blocks.
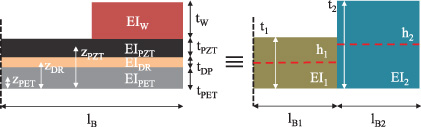
Figure 3. Schematic of the equivalent Young's modulus and the moment of inertia between the harvester layers and the modeled multi-span beam.
Download figure:
Standard image High-resolution imageUsing the multi-span beam system, the general Euler–Bernoulli motion equation set is presented as follows [31]:
where z1,2(x, t), c1,2, m1,2, f1,2(x, t), K1,2U(t) are the vertical displacement as a function of horizontal position and time, the damping, the equivalent mass, the external forces, and the back-coupling effect, for b1 and b2, respectively. Although other models have already been proposed in the literature[41, 44], in the present work we have developed a model which combines a distributed mass approach with the back-coupling effect. The back-coupling effect describes the extra stiffness of the PZT beam during operation, due to an opposing bending force caused by the stress-charges generated in the active layer [45].
The method of separation of variables was used to solve equation (4) for the vertical displacement (Z1,2(x, t)), as shown in equation (5).

where X1,2(x) and T(t) are the vertical displacement functions with respect to space and time, respectively.
The homogeneous Euler–Bernoulli equation (neglecting the damping, the back-coupling, and the external forces) was solved in order to find the natural frequency of the system and later to calculate the general displacement equation of the beam. The spatial coordinate and the characteristic equations are then defined as follows:

where β1,2 is the wavenumber, ωn is the circular frequency, lB1,2 is the length of the beam, and λ1,2 is the eigenvalue, for b1 and b2, respectively.
The characteristic equation (6) is solved for the spatial composition (X1,2(x)), which gives the generic equation (9), including eight coefficients: A1,2, B1,2, C1,2, and D1,2. The coefficients were found using the boundary conditions for the system [46], shown in the set of equation (10).
Substituting the boundary conditions in the spatial equation (9), the set of eight coefficients can be found for each block: b1 equations (11) and b2 equations (12).
Using the Euler–Bernoulli equation along with the orthogonality condition for natural modes [38], and assuming a sinusoidal acceleration a applied on the piezoelectric energy harvester, the amplitude T of the vertical displacement with respect to time T(t) is given by equation (13) [31].

where

Considering the electrical circuit as a capacitor (representing a piezoelectric energy harvester having no internal resistance) connected to an external resistor R, and assuming that all the current Ic generated by the PZT flows into the resistor R, the voltage U across the resistive load can be calculated by equation (17).

where Qd1,2 are stress-charges generated along the surface of the PZT and C is the internal capacitance of the PZT layer, given by equations (18) and (19).
where α is the correction factor extracted from COMSOL simulations. It is defined as the sum of all the stress-charges generated within the PZT (including the extra charges) divided by the sum of the stress-charges created in the cantilever (without the anchor) (refer to section 6.1.2).
Finally, inserting equation (13) into equation (17) and rearranging the terms, the average generated power was obtained by solving equation (20).
where
Equation (20) uses the calculated stress-charges for each block qd1 and qd2 with respect to space, the estimated optimal load R (found at the maximum power by sweeping a resistive load and the resonance frequency), the measured damping coefficient ζ, the theoretical natural frequency ωn, and the excitation frequency of the base ωe for a given acceleration a.
4.2. FEM simulations
Two finite element simulations were implemented in COMSOL Multiphysics v4.2 using the clamping conditions shown in figure 2(b). The first uses the piezoelectric module of COMSOL to calculate the correction factor α emulating the total generated stress-charges in the cantilever beam. As discussed previously, this factor is then implemented in the hybrid model. The second simulation defines the numerical model, combining the piezoelectric and electric circuit modules to introduce a resistive load connected across the electrodes of the PZT material. This combination enables the simulation of the output power generated by the system as a function of load, acceleration, damping, and excitation frequency, as well as geometrical parameters.
In both cases, the material models used were as follows: piezoelectric material for the PZT layer and linear elastic material for the others (PET substrate, dry film photoresist, tungsten mass, and rigid fixation substrate). In order to get accurate results within a reasonable calculation time, the mesh was optimized depending on the different materials and dimensions. The mesh was defined with the mapped and distributed functions of COMSOL using square-shaped elements. The PZT layer has the smallest mesh size (0.1 mm × 0.2 mm × 1 μm for the length, width, and thickness) due to its electromechanical behavior, while the proof mass and the rest of the structure have a mesh size of 0.1 mm × 0.2 mm × 20 μm. The designs were simulated using the 3D geometry representation, and the mechanical boundary conditions were set such that the base was rigidly anchored while the rest of the structure remained free. In the second simulation, only the PZT bottom electrode was electrically set as ground while the top electrode was connected to a variable resistor through the terminal boundary condition. The metal conductors and the adhesion between layers were assumed to be ideal. The type of materials and their corresponding mechanical and electrical properties used for the analytical and FEM approaches are shown in tables 1 and 2, respectively.
Table 1. Mechanical properties of the materials used for the analytical calculations and the FEM simulations.
| Mechanical properties | |||
|---|---|---|---|
| Material | E (GPa) | Density (kg m−3) | Poisson's ratio (—) |
| PZT-5H | 62 | 7 800 | 0.27 |
| PET-Melinex | 4.6 | 1 430 | 0.33 |
| DP-PerMX | 2 | 1 430 | 0.33 |
| Tungsten | 411 | 19 350 | 0.28 |
| PCB | 22 | 1 900 | 0.28 |
Table 2. Electrical properties of the PZT-5H used for the analytical calculations and the FEM simulations.
| Electrical properties (PZT) | |||
|---|---|---|---|
| Piezo. coefficients (pC N−1) | Rel. perm. | ||
| d31 | −320 | ε11 | 3130 |
| d33 | 650 | ε22 | 3130 |
| d15 | 741 | ε33 | 3800 |
4.3. Validation procedures
The same validation procedure was followed for the hybrid model and the numerical model. After defining the geometry, the mechanical/electrical properties, and the boundary conditions, the first mode eigen-frequency for the respective design was calculated/simulated. Next, a frequency sweep was performed at short- and open-circuit conditions within a range that includes the eigen-frequency previously found. In [47], it was shown that the losses due to damping are mainly caused by internal structural friction with low influence of the surrounding air (no significant differences were observed between measurements under vacuum and air environments). The effect of air damping was tested by measuring the damping coefficient of ten devices with different dimensions (areas ranging from 30 to 65 mm2). The damping coefficient was shown to be 0.012 ± 0.002, which represents a relatively small variation, and therefore it was assumed to be constant over this range of dimensions. In addition, a linear relationship between the damping coefficient and the input acceleration (range from 0.3 g to 1 g) was observed with an incremental ratio of around 0.0037 g−1. Finally, a parametric sweep study was implemented to find the optimal resistive load value that gives the maximum output power. Using equations (1)–(21), and in parallel the frequency domain sweep simulation in COMSOL, the stress-charges at the surface, the voltage, and the power at the optimal load were calculated or simulated, respectively. It should be noted that this procedure can be performed including or excluding the proof mass, a process which allows one to compare its influence on the mechanical and electrical dynamic behavior of the cantilever stack.
The characterization procedure followed for the fabricated devices is based on [48], where an automatic test bench is used to measure values such as resonance and anti-resonance frequency, coupling coefficient, power as a function of frequency (short and open circuit), power as a function of resistive load (at fixed frequency and acceleration), optimal load, power, voltage, bandwidth, and tip displacement.
After validation, the analytical model was used to optimize the geometry of the harvester in order to obtain the maximum output power at low frequencies. Due to the relatively fast feedback given by the MATLAB scripts, the beam length (0–30 mm), the beam width (2–5 mm), the PZT/PET length ratio (0–1), the PZT thickness (10−150 μm), and the mass/beam length ratio (0–1) were swept, and optimized values were determined.
5. Fabrication
An optimized vibration energy harvester fabrication is presented. The process is based on lamination steps in order to bond bulk-PZT sheets to PET substrates and printing techniques to make the electrical contacts [23]. Besides targeting low complexity, the process is developed at low temperature due to the relatively low glass transition temperature of PET, ≈80 °C. Figure 4 shows the main fabrication steps, indicating some typically used parameters for the geometry and the type of material.

Figure 4. Schematic of the fabrication process: (a) grinding of the PZT sheet to reduce and optimize its thickness, (b) laser ablation of the PET substrates with the cantilever shape, (c) hot roll lamination of the dry photoresist (DP) film to the PZT beams at 85 °C, (d) bonding of the PZT/DP stack to the PET substrate by means of heat and pressure, (e) stencil printing of the Ag-based paste for bottom electrical connection, and (f) fixation to the rigid substrate and fixation of the W mass.
Download figure:
Standard image High-resolution imageTo enhance the output power and to achieve low resonance frequencies, the PZT layer was thinned down at wafer level using a grinder DAG810® from Disco© [15]. The latter process uses a rotating wheel with diamond sweeps that removes material from the PZT sheet at very precise vertical displacements (figure 4(a)). The grinding speed was 30 μm min−1, with a total thickness variation of around 1 μm and a final roughness at the PZT surface of less than 100 nm. Next, the PZT was diced with a diamond saw according to the required dimensions. In parallel, the PET substrates were laser ablated to the respective dimensions with a Speedy 300 fiberTM CO2 laser from Trotec® (figure 4(b)).
The transferring process starts with the lamination of the dry film photoresist (DP) PerMX (14 μm thick) onto the diced PZT beams (figure 4(c)). The lamination was performed using a semi-automatic double-roller laminator at 85 °C, 2 bar, and 2 m min−1. After a post-lamination bake (5 min @ 85 °C), the stack was exposed to UV light (250 mJ cm−2) from the PET side in order to polymerize the DP [49]. Finally, a post-exposure bake (10 min @ 60 °C) was performed in order to finalize the cross-linking process. Next, the PZT/DP stack was aligned and bonded to the PET cantilever substrate using 8 kPa of pressure at 85 °C for 10 min (figure 4(d)). In order to obtain a good adhesion between the layers and to achieve the flexible mechanical properties of the DP, the stack was hard cured at 85 °C for 1 h in a convection oven [49]. To facilitate the characterization experiments, the PZT/DP/PET stack was fixed to a FR-4 rigid substrate using the dry adhesive AR8932. The top and bottom contacts were connected using stencil-printed silver-filled epoxy adhesive (EPO-TEK H70E), from the top to the copper-clad PCB and through the dry adhesive vias, respectively (figures 4(e) and (f)). The conductive adhesive was cured in a convection oven for 2 h at 85 °C. Finally, a laser-ablated tungsten mass was fixed at the free end of the beam using the dry adhesive.
6. Results and discussion
6.1. Hybrid model (analytical and FEM based)
6.1.1. Two-span beam displacement continuity
The displacement of each block (b1, b2) was calculated from equation (9), solving for X1(x) and X2(x), the deflections of the two blocks along the x-axis. The solution of these two spatial displacements was obtained using the boundary conditions presented in equation (10), which describes the interaction of the two blocks with respect to each other and the clamping. Using the mentioned displacement profiles, X1(x) and X2(x), the resonance frequency, the strain, the stress-charges, the voltage, and the power were obtained according to equations (13)–(21).
Figure 5 displays the calculated displacement values along the x-axis for each block, in order to show the continuity of the equations at their interface (x = 9.5 mm). The insets of figure 5 show a schematic and the tip displacement as a function of frequency of a device with a distributed mass at the free end (distributed on 50% of the total beam length) and at the optimal load. The continuity corroborates the validity of the boundary conditions for the equivalent blocks.
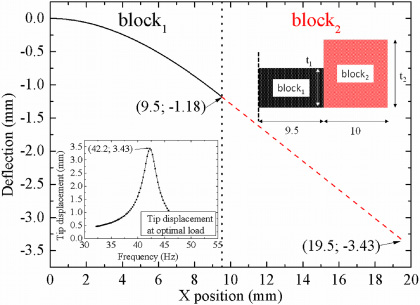
Figure 5. Calculated displacement profile versus the x position of a harvester beam with a distributed mass at the free end (on 50% of the total beam length). Insets: top right: schematic of the simulated harvester; bottom left: tip displacement of the beam versus frequency.
Download figure:
Standard image High-resolution image6.1.2. Additional charge simulation
The hybrid model uses a mechanically fixed boundary condition along the beam thickness (at the PCB frame) and not at the base of the anchor point (as in reality) due to the relatively lower complexity. As shown in equation (21), the additional stress-charges are corrected with the factor α from COMSOL simulations. This factor depends on the mechanical properties (i.e. flexural rigidity) of the beam. Since the same materials, cross-section, and fixation technique were used in all of our devices, the correction factor is almost constant. Figure 6 shows the first resonant mode (eigen-frequency simulation at optimal load) solved for the von Mises stress of the structure and for the current density of the PZT at the anchor point and at the interface with the mass (close-up view). It should be noted that the maximum stress region (at the anchor point) corresponds to the maximum current density. The latter is an indication of the stress-induced charges in the PZT. These simulations show that the stress-charges generated increase by 10–15% when the anchor region is included and a flexible PET substrate is used.
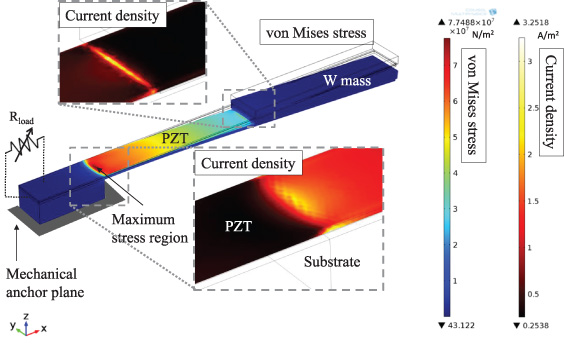
Figure 6. First resonance mode of the multi-stack harvester. The color legend of the whole structure represents the simulated von Mises stress (red to blue range), while the color legend of the maximum stress regions represents the simulated current density (black to white range).
Download figure:
Standard image High-resolution image6.1.3. Model validation
The validity of the hybrid model for a range of accelerations (0.3–1 g) and cantilever areas (30−70 mm2, with a linear increase of the damping coefficient with respect to the acceleration) was proven by comparing calculated and experimental data of the power generated at different vibrating frequencies. The optimal load used for the power calculation was found by sweeping it from 100 Ω (short circuit) to 1 MΩ (open circuit). Figures 7(a)–(d) compare the same device: with (A) and without (B) mass at 0.3 g, 0.5 g, 0.7 g, and 1 g, respectively. The solid lines represent the values obtained from the hybrid model, while the dotted lines denote the experimental data. The measured dimensions of devices A and B are given in table 3. Figure 7 shows a good correlation between the calculated and measured curves, validating the model at least for the mentioned ranges of acceleration and dimensions. The average differences for all accelerations (0.3 g, 0.5 g, 0.7 g, and 1 g) between the calculated and measured values for output power and resonance frequency were 13 ± 5%, 1.5 ± 0.5% with mass and 15 ± 6%, 4.5 ± 0.4% without mass, respectively. By simulating and comparing the output power versus frequency curves with and without the back-coupling effect (neglecting the coupling factor K1,2 in equations (13)–(16)), it was found that the power and resonance frequency were just slightly decreased and up-shifted, respectively. In [47], it was shown by our group that the back-coupling effect in Si-based devices was relatively higher than in polymer-based ones, probably due to the higher electromechanical coupling coefficient.
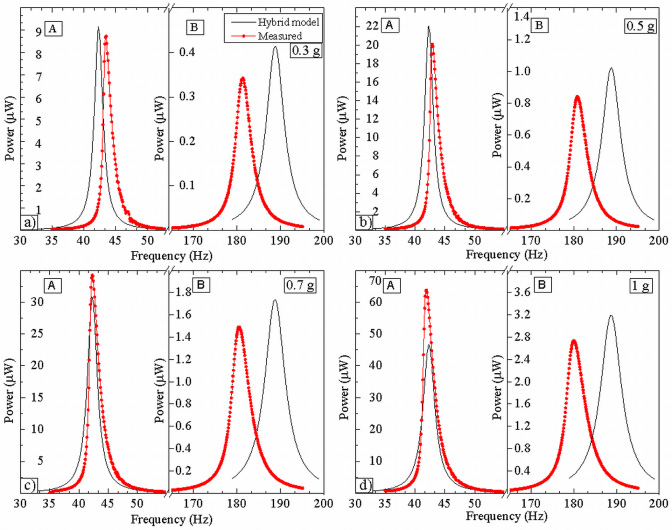
Figure 7. Comparison of calculated (solid lines) and measured (dotted lines) power versus frequency for a device with (A) and without (B) mass, at (a) 0.3 g, (b) 0.5 g, (c) 0.7 g, and (d) 1 g.
Download figure:
Standard image High-resolution imageTable 3. Geometrical parameters used for the simulated and fabricated devices with the hybrid model and the numerical model.
| Material | Width (mm) | Length (mm) | Thickness (μm) |
|---|---|---|---|
| PZT-5H | 2.0 | 19.5 | 70 |
| PET-Melinex | 2.0 | 19.5 | 125 |
| DP-PerMX | 2.0 | 19.5 | 14 |
| Tungsten | 2.2 | 10.0 | 500 |
| Extra PZT (la) | 2.0 | 4.0 | 70 |
6.1.4. Geometrical optimization
The geometrical optimization was performed using the relatively fast feedback from MATLAB scripts of the hybrid model. Figure 8 shows the curves of power (left axis) and resonance frequency (right axis) versus beam length, beam width, PZT thickness, the PZT/PET length ratio, and the mass/beam length ratio.
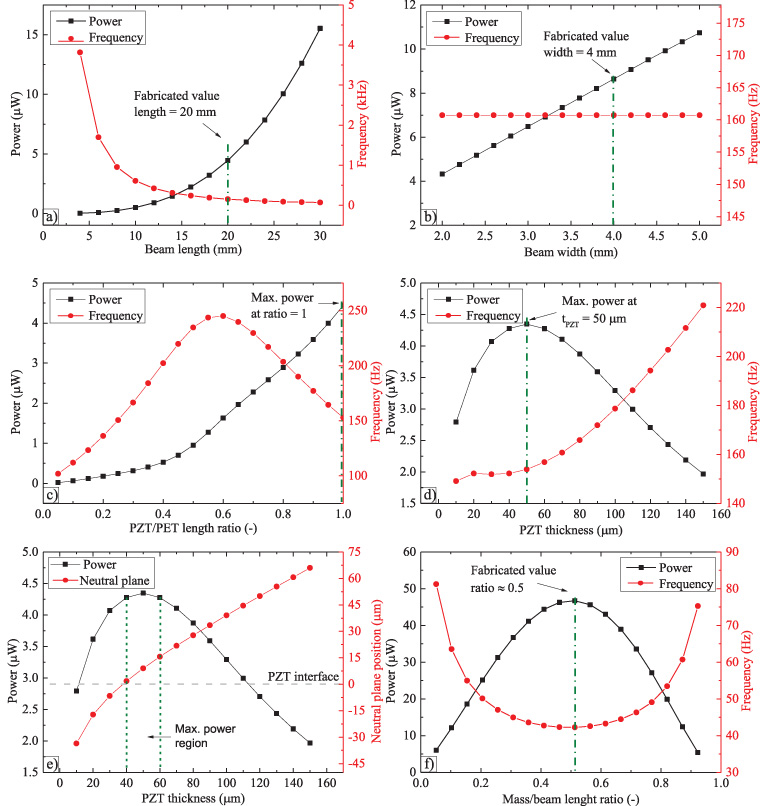
Figure 8. Comparison at 1 g of power and resonance frequency versus (a) beam length, (b) beam width, (c) PZT/PET length ratio, (d) PZT thickness, (e) neutral plane location, and (f) mass/beam length ratio.
Download figure:
Standard image High-resolution imageA longer beam increases the power and reduces the frequency (equation (8)). However, it could affect the mechanical integrity of the beam by causing fractures due to both an increase in mass and larger deflections. Furthermore, a wider beam augments the output power due to an increase in area and mass of the device, whereas the resonance frequency remains constant provided that geometry of the structure is a cantilever and not a plate (i.e. length/width ratio ≫ 1). Here, a trade-off is identified between the size of the device and the output power, and therefore the optimum value depends on the application of interest (figures 8(a) and (b)).
Full coverage of PZT over the PET cantilever (i.e. PZT/PET ratio = 1) was found to give the maximum power for constant thicknesses, as shown in figure 8(c). The frequency presents a maximum value at about 60% coverage due to the higher relative stiffness of the stack (i.e. the Young's modulus of PZT is higher than that of PET). For larger coverage ratios, the frequency decreases, since the effect of the additional mass is more significant than the effect of its rigidity.
In addition to the PZT/PET length ratio, their respective thicknesses play an important role in the harvester optimization due to the location of the neutral plane. In [23], it was shown that the power can be maximized by placing the neutral plane as close as possible to the interface between the PZT and the PET layers. Appropriate manipulation of the neutral plane can be achieved by either increasing the thickness of the PET or by decreasing the thickness of the PZT layer, due to their respective Young's moduli (EPZT > EPET). In this work, the PZT thickness was decreased, following the grinding procedure described previously, in order to keep the overall dimensions of the design as small as possible. Additionally, the resonance frequency is directly proportional to the thickness of the PZT layer; therefore, reducing the thickness reduces the resonance frequency of the cantilever.
Using the hybrid model, the neutral plane, the power, and the resonance frequency were calculated while sweeping the PZT thickness from 10 to 150 μm and keeping the PET thickness constant at 125 μm. The maximum output power was found for a PZT thickness of 50 μm (figures 8(d) and (e)). Here, also, the resonance frequency tends to increase for thicker layers, due to the increased stiffness of the beam.
Finally, the mass/beam length ratio was increased from the free end of the beam to the anchor point fully covering the beam (i.e. mass/beam ratio = 1). The power and the resonance frequency of the harvester were calculated over this range, as shown in figure 8(f). The output power reaches a maximum value and the resonance frequency falls to a minimum value for a ratio of about 0.5, due to the trade-off between the stiffness and the mass of the cantilever.
6.2. Numerical model (entirely FEM based)
6.2.1. Model validation
The validity of the numerical model implemented in COMSOL for the range of accelerations (0.3–1 g) and cantilever areas (30−70 mm2 with a linear increase of the damping coefficient with respect to the acceleration) was proven by comparing the simulations to the experimental data representing the output power at different frequencies. The optimal load used for the power simulations was found after sweeping the connected resistor from 100 Ω (short circuit) to 1 MΩ (open circuit). Figures 9(a)–(d) compare the same device with (A) and without (B) mass at 0.3 g, 0.5 g, 0.7 g, and 1 g, respectively. The solid lines represent the values simulated with the numerical model, while the dotted lines denote the experimental data. The dimensions and measured characteristics of the devices are found in table 3. Figure 9 shows a good correlation between the simulated and measured curves, validating the model at least for the mentioned ranges of accelerations and dimensions. The average differences for all accelerations (0.3 g, 0.5 g, 0.7 g, and 1 g) between the calculated and measured values for power and resonance frequency were 16 ± 8%, 1.3 ± 0.6% with mass and 7 ± 4%, 1.4 ± 0.3% without mass, respectively. It should be noted that for a device with a mass, excited at relatively high accelerations (e.g. 1 g), the measured power curve (figure 9(d)) is not symmetric, as a result of the nonlinear response of the PZT under large stress [50]. The use of nonlinear elastic mechanical properties and damping coefficients has been proposed to overcome these limitations [51]. In its present state, these effects are not taken into account in the hybrid model or in the numerical model, which limits their respective accuracy.
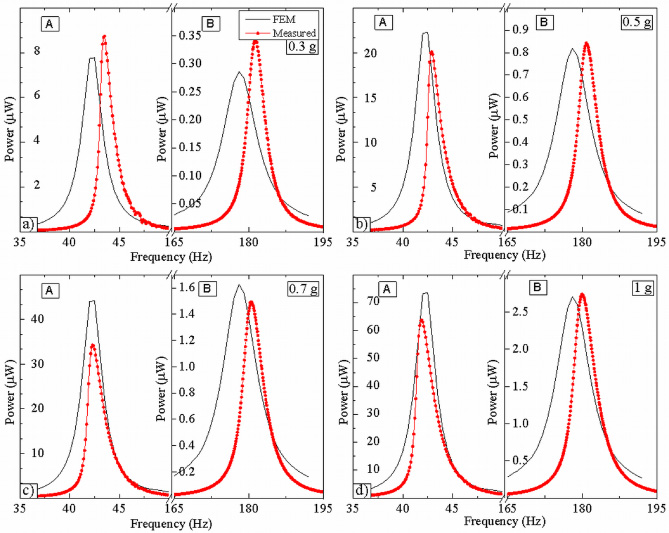
Figure 9. Comparison of FEM-simulated (solid lines) and measured (dotted lines) power versus frequency for a device with (A) and without (B) mass, at (a) 0.3 g, (b) 0.5 g, (c) 0.7 g, and (d) 1 g.
Download figure:
Standard image High-resolution image6.2.2. Optimized harvester
Two optimal devices, known as harvester I (long) and harvester II (short), were fabricated following the results and design recommendations from the harvester geometrical optimization (figure 8). The dimensions were as follows: length 19.3 mm (device I) and 15 mm (device II), width 4 mm, PZT/PET length ratio 1, PZT thickness 50 μm, and mass/beam length ratio 0.5. Harvester I without mass is depicted in figure 10(a), while the optimized one (including the tungsten proof mass) is shown in figure 10(b). A cross-sectional view of the multi-layer stack is presented in figure 10(c), indicating the respective materials and thicknesses. The final dimensions of the devices are reported in table 4.
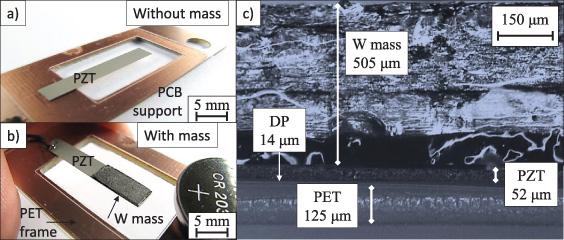
Figure 10. Pictures of fabricated optimal harvester I: (a) side view of the harvester mounted on a PCB without the mass, (b) side view of the harvester with the mass compared to a button battery, and (c) cross-sectional view of the harvester showing the PET, DP, PZT, and W layers.
Download figure:
Standard image High-resolution imageTable 4. Geometrical parameters of the optimized and fabricated harvester.
| Material | Width (mm) | Length I/II (mm) | Thickness (μm) |
|---|---|---|---|
| PZT-5H | 4.3 | 19.3/15 | 52 |
| PET-Melinex | 4.3 | 19.3/15 | 125 |
| DP-PerMX | 4.3 | 19.3/15 | 14 |
| Tungsten | 4.3 | 9.7 | 505 |
| Extra elec. | 4.0 | 4.0 | 70 |
The numerical model simulations (solid lines) and measured values (dotted lines) for output power were compared and are found to be in good agreement at the optimal load for optimized harvesters I and II: with (figures 11(a),
12(a)) and without (figures 11(b), 12(b)) the proof mass. Figure 11(a) shows the output power curves for accelerations from 0.1 to 0.6 g. The input acceleration was limited to 0.6 g, since above this value the beam deflection was greater than the allocated space (≈2.5 mm) and could induce damage of the device. The damping value at 0.1 g was calculated from the linear regression of damping versus acceleration (0.0037 g−1) mentioned previously. Figure 11(a) shows output powers of 88.7 μW at 48.6 Hz and 6.7 μW at 49.8 Hz for optimized harvester I with an optimal load of 75 kΩ at 0.5 g and 0.1 g, respectively. As pointed out previously, the model excludes the nonlinear effects which appear for large beam deflections. The calculated dynamic electromechanical coupling coefficient  (where foc and fsc are the open-circuit and short-circuit resonance frequencies) was calculated for the optimized harvesters I and II, resulting in values of 2.03% and 1.8%, respectively.
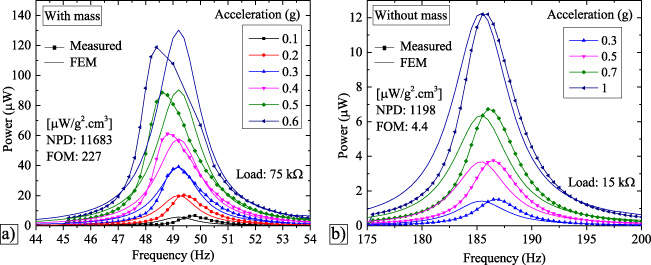
Figure 11. Comparison of numerical FEM-simulated (solid lines) and measured (dotted lines) power versus frequency for optimized harvester I with (a) and without (b) mass at different accelerations.
Download figure:
Standard image High-resolution image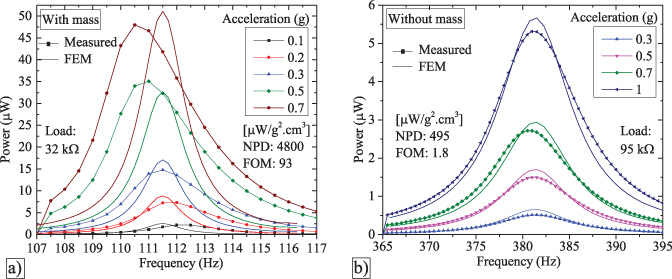
Figure 12. Comparison of numerical FEM-simulated (solid lines) and measured (dotted lines) power versus frequency for optimized harvester II with (a) and without (b) mass at different accelerations.
Download figure:
Standard image High-resolution imageRelatively high values for normalized power density (NPD) [52] of 11 683 μW g−2 cm−3 and volume displacement figure of merit (FOM) [48] of 227 μW g−2 cm−3 were found for optimized harvester I. The volume displacement FOM was calculated using FOM = P × g−2 × (VΣ)−1 × Q−1, where P is the output power, g is the input acceleration, Q is the quality factor, and VΣ = wB × lB × (tPET + tDR + tPZT + tW + dmax), with dmax as the maximum peak-to-peak displacement of the cantilever beam. Optimized harvester I outperformed the previous version [47] in terms of output power (at 0.1 g), NPD (including the empty volume between the proof mass and the anchor region of the beam), and FOM (including the beam displacement) by a factor of 5.1, 2.46, and 2.3, respectively. Figure 11(b) shows the maximum generated power of 12 μW, a resonance frequency of 185 Hz, and an optimal load of 15 kΩ at 1 g without proof mass.
Figure 12 shows a good agreement between the measured harvester (harvester II) and its numerical simulations, resulting in a maximum power of 48 μW at 110.5 Hz and 32 kΩ of optimal load.
Additionally, figure 13 shows the average current and voltage curves for optimized harvester I (with and without mass). It is pointed out that the average current and voltage values at the resonance frequency, optimal load, and including the proof mass, are 40 μA and 3.1 V, respectively.
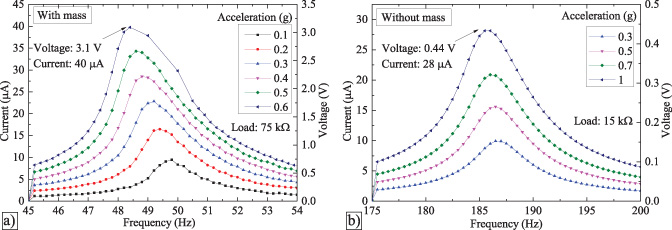
Figure 13. Current (left axis) and voltage (right axis) curves for optimized harvester I with (a) and without (b) mass at different accelerations.
Download figure:
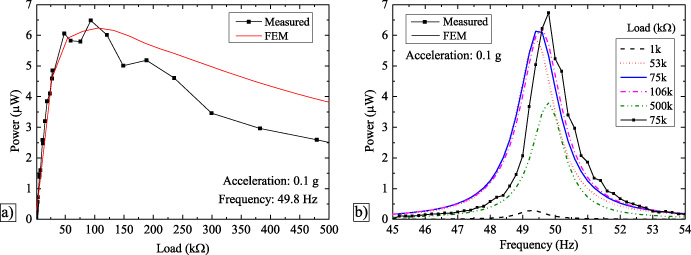
Standard image High-resolution imageA comparison of the power as a function of load curves between the numerical model simulations (solid lines) and measured data (dotted lines) was performed to completely corroborate the validity of the model. Figure 14(a) shows the output power as a function of load at 0.1 g and a fixed frequency of 49.8 Hz (the natural frequency of the harvester), while figure 14(b) shows the power curves and frequency shifts (additional stiffness due to the back-coupling effect) for several resistive loads (from 1 to 500 kΩ). For the measured data as well as for the FEM simulations, the optimal load was found to be between 80 and 100 kΩ, providing a maximum power of 6.7 μW at 0.1 g. It should be noted that the system generates considerable power levels at relatively low frequencies (≈50 Hz) and at low input accelerations, which was one of the main reasons to use the polymeric PET substrate.
Figure 14. Comparison of FEM-simulated (solid lines) and measured (dotted lines) power versus load for an optimized device with mass at 0.1 g of acceleration for optimized harvester I; (a) power versus load and (b) power versus frequency at different loads (from 1 to 500 kΩ).
Download figure:
Standard image High-resolution image
The overview and comparison of optimized harvester I with other published harvesters is summarized in table 5. As we can see, the NPD of harvester I outperformed the others due to the relative higher displacements thus higher power per acceleration. However, higher flexibility causes reduction of the FOM, which takes into account tip displacements.
Table 5. Performance comparison between the optimized harvester presented in this work (harvester I) and two other relevant devices from literature.
| Device | PZT type | Freq. (Hz) | Power (μW g−2) | Current (μA g−1) | Voltage (V g−1) | Rl(kΩ) | Disp. (mm) | Total volume (mm3) | k2(%) | NPD (μW g−2 cm−3) | FOM (μW g−2 cm−3) |
|---|---|---|---|---|---|---|---|---|---|---|---|
| This work (I) | Thinned bulk PZT-5H | 49.8 | 670 | 100 | 5 | 75 | 2 | 57.3 | 2.03 | 11 683 | 227.4 |
| [16] (Michigan) | Thinned bulk PZT-5A | 167 | 274 | — | 11.7 | 500 | — | 27 | — | 10 150 | — |
| [53] (DTU) | Screen-printed PZT | 235 | 14 | — | 1.5 | 100 | — | 12.9 | — | 1 087 | — |
7. Conclusion
The modeling and the fabrication of an optimized thinned bulk-PZT-based vibration energy harvester on a plastic polymeric substrate (PET) is presented in this paper. A hybrid model (analytical + FEM) and a numerical model (only FEM) were validated and shown to be in good agreement with the experimental data collected from fabricated devices. The hybrid model, based on the Euler–Bernoulli beam theory, the multi-span theory and enhanced with COMSOL simulations, was used to geometrically optimize the harvester. The power was maximized for a low-frequency operation (below 100 Hz) through a parametric study. The optimized device was in good agreement with the developed models, generating a power of 6.7 μW at 49.8 Hz, 0.1 g across a load of 75 kΩ. It exhibited a normalized power density NPD of 11 683 μW g−2 cm−3 and a figure of merit (FOM) of 227 μW g−2 cm−3 (including displacement). In addition, an output power higher than 100 μW was obtained for accelerations above 0.5 g.
Acknowledgments
This work was partly funded by the EU FP7 project FlexSmell, a Marie Curie Initial Training Network (ITN), under grant no. 238454. The authors thank Dr Rolanas Dauksevicius at EPFL-IMT SAMLAB for fruitful discussions, and Dr Bill A McDonald from DuPont® Teijin Films and Dr Nikki Birkbeck from Adhesives Research, for the supply of Melinex® ST506 and ARClear 8923 samples, respectively.