Abstract
This paper reports on direct thermal to electrical energy conversion by performing the Olsen (or Ericsson) cycle on [001]-poled 0.945PbZn1/3Nb2/3O3–0.055PbTiO3 (PZN-5.5PT) single crystals. The cycle consists of two isothermal and two constant electric field processes. The energy density was found to decrease with increasing cycle frequency while the power density increased. The maximum energy density obtained was 150 J/l/cycle for temperatures between 100 and 190 °C and electric field between 0 and 1.2 MV m−1 at frequency 0.034 Hz. The maximum power density reached 11.7 W l−1 at 0.1 Hz for temperatures between 100 and 190 °C and electric fields between 0.2 and 1.5 MV m−1. Moreover, the dielectric constant and saturation polarization of PZN-5.5PT are reported for the first time at 0.1 Hz for temperatures between 100 and 190 °C. Finally, the experimental results agree relatively well with predictions by a recently developed temperature-dependent property model already validated with PMN-32PT. Inter-sample variability and sample durability are also discussed.
Export citation and abstract BibTeX RIS
1. Introduction
The rising interest in renewable energy and energy-efficient technologies has stimulated efforts in harvesting thermal energy that would otherwise be wasted. In 2009, an estimated 50% of the energy consumed in the United States was wasted in the form of low grade waste heat [1]. The Olsen cycle performed on pyroelectric material can convert thermal energy directly into electricity [2]. This cycle consists of two isothermal and two isoelectric field processes in the displacement versus electric field (D–E) diagram [2]. It is analogous to the Ericsson cycle, in which a working fluid undergoes two isothermal and two isobaric processes in the pressure–volume diagram [3]. Figure 1 shows the isothermal bipolar hysteresis loops at cold and hot temperatures Tcold and Thot. It also illustrates the Olsen cycle. Process 1–2 corresponds to an increase in the electric field from EL to EH at constant temperature Tcold. Process 2–3 consists of heating the material from Tcold to Thot under constant electric field EH. Process 3–4 corresponds to a decrease in the electric field from EH to EL at constant temperature Thot. Finally, process 4–1 closes the cycle by cooling the material from Thot to Tcold under constant electric field EL. The area shaded in gray corresponds to the generated energy density ND defined as the electrical energy produced per unit volume of the material per cycle. It is expressed as [2]
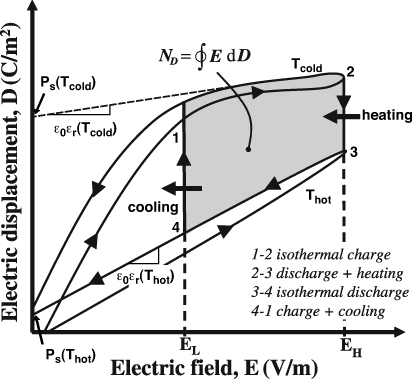
Figure 1. Electric displacement versus electric field for a typical pyroelectric material at temperatures Thot and Tcold along with the Olsen cycle. The electrical energy generated per cycle is represented by the gray area enclosed by 1–4.
Download figure:
Standard imageIn practice, the generated energy can be harvested by delivering it to an external load or storage unit [4]. Several devices have been designed and built to implement the Olsen cycle [2, 5–11]. They have explored several heat transfer strategies ranging from laminar convective heat transfer [2, 4, 6–9] to conduction [10, 11] and nanoscale radiation [5]. The required temperature oscillations have been achieved passively in various designs [10, 12]. In order to achieve the maximum device performance, it is also necessary to identify the best pyroelectric material and the associated optimum operating temperature range.
The present study aims to assess the energy harvesting performance of commercially available [001]-poled 0.945PbZn1/3Nb2/3O3–0.055PbTiO3 (PZN-5.5PT) single crystals undergoing the Olsen cycle. Particular attention was paid to the effects of temperature, electric field and cycle frequency as well as inter-sample variability. Other objectives of this study were to measure the dielectric properties of PZN-5.5PT at low frequencies and to validate a recently developed physics-based model [13].
2. Background
2.1. PZN-PT properties
The properties of PZN-PT have been studied extensively as it is a popular ferroelectric material used in sensors and actuators [14–23]. Poled single crystal PZN-4.5PT undergoes a phase transformation sequence from rhombohedral (R) to tetragonal (T) to cubic (C) during heating from 25 to 160 °C under zero electric field [19]. A small fraction of rhombohedral domains exist in the tetragonal phase [19]. The phase diagram for PZN-xPT indicates that, for PZN-5.5PT, the rhombohedral to tetragonal transition occurs between 122 and 130 °C and the tetragonal to cubic transition occurs around TCurie = 165 °C [20]. Renault et al [23] showed that during field cooling from 177 to 27 °C [001]-oriented PZN-4.5PT has an additional orthorhombic (O) phase and undergoes a C–T–O–R phase transition sequence. The authors also demonstrated that the transition temperatures were dependent on the applied electric field which varied from 0 to 0.3 MV m−1.
Ren et al [14] showed that electric-field-induced phase transitions and piezoelectric properties of PZN-xPT are strongly dependent on temperature and composition for x between 4.5 and 8%. In addition, Shen and Cao [17] reported the temperature dependence of the piezoelectric, pyroelectric and dielectric properties of PZN-xPT poled by two different methods for x equal to 4.5 and 8%. The relative permittivity and saturation polarization of PZN-4.5PT were found to be extremely sensitive to (i) the applied electric field used during poling [22] and (ii) to the poling method [17]. Although the properties of PZN-4.5PT have been reported in the literature [14–23], to the best of our knowledge, dielectric properties of PZN-5.5PT, investigated here, have not been reported.
2.2. Olsen cycle on PZN-PT
Khodayari et al [24] studied the energy harvesting capabilities of [110]-oriented PZN-4.5PT using the Olsen cycle. The authors achieved 216.5 J/l/cycle (1 J/l/cycle = 1 mJ/cm3/cycle) by successively dipping a 1 mm thick single crystal PZN-4.5PT sample in baths at 100 and 160 °C while the electric fields varied between EL = 0 MV m−1 and EH = 2 MV m−1. Zhu et al [25] also used 1.1 mm thick [110]-oriented PZN-4.5PT single crystals to examine the energy generated with electric-field-induced phase transitions through rhombohedral, orthorhombic and tetragonal phases during the Olsen cycle. The authors obtained 101.8 J/l/cycle operating between temperatures 100 and 130 °C and electric fields EL = 0 MV m−1 and EH = 2 MV m−1 [25]. For these operating conditions, they determined that, during the isothermal processes 1–2 and 3–4 in the Olsen cycle, the samples experienced rhombohedral to orthorhombic (R–O) and orthorhombic to tetragonal (O–T) frequency-dependent phase transitions, respectively. Zhu et al [25] also found that the energy density increased with reducing the duration of isothermal process 1–2 and increasing the duration of isothermal process 3–4 which varied from 0.1 to 100 s. Finally, if the isothermal processes were of equal duration, the energy density increased with increasing duration [25]. In both of these studies [24, 25], it is unclear if these experimental results were averaged over multiple cycles and/or were repeated for different samples. In contrast, the present study performs the Olsen cycle on several PZN-5.5PT single crystal samples and assesses the sample variability in terms of generated energy.
2.3. Modeling
Recently, Kandilian et al [13] derived a model estimating the energy harvesting capabilities of single crystal relaxor ferroelectric materials undergoing the Olsen cycle. The model expresses the energy density as [13]
where ε0 is the vacuum permittivity (=8.854 × 10⁻¹² F m−1), εr(Tcold) and εr(Thot) are the low frequency (∼0.1 Hz) relative permittivities of the pyroelectric material at the cold and hot operating temperatures Tcold and Thot, respectively. The saturation polarizations of the pyroelectric material at Tcold and Thot are respectively denoted by Ps(Tcold) and Ps(Thot) and expressed in C m−2 [26]. In addition, d33 is the piezoelectric coefficient of the single crystal (in C N−1), s33 is the elastic compliance of the single crystal (in m2 N−1) and x3 = α3(Thot − Tcold), where α3 is the thermal expansion coefficient (in K−1). Note that this model was based on the assumption that the dielectric contribution to the primary pyroelectric coefficient was negligible compared with the dipole contribution (see equation (8) in [13]). This model was validated against experimental data collected on PMN-32PT single crystals and using properties reported in the literature [27–30] for Tcold = 80 °C and Thot varying from 130 to 170 °C, while EL was 0.2 MV m−1 and EH ranged from 0.4 to 0.9 MV m−1 [13]. The model given by equation (2) is expressed as a function of material properties typically reported in the literature. Thus, it can enable rapid identification of promising materials for waste heat harvesting without physically performing the Olsen cycle.
The present paper aims (i) to assess the performance of PZN-5.5PT single crystals in converting waste heat into electricity, (ii) to measure their dielectric properties and (iii) to further validate the above model.
3. Experiments
3.1. Samples
In the present study, five single crystal PZN-5.5PT samples were purchased from Microfine Materials Technologies Pte Ltd, Singapore. The samples were poled in the [001] direction. Their surface area and thickness were 1 × 1 cm2 and 200 µm, respectively. Each 1 × 1 cm2 face of the samples was coated with a ∼10 nm NiCr bond layer and a ∼1 μm thick Au0.68Pd0.32 electrode. These layers were deposited by an RF sputter-deposition technique. Electrical wires were attached to the electrodes using conductive silver epoxy.
3.2. D–E loops
Isothermal bipolar displacement versus electric field hysteresis curves were collected at various temperatures by applying a triangular voltage with frequency of 0.1 Hz across the single crystal samples. The samples were placed in a silicone oil bath at the desired temperatures of 100, 125, 150, 175 or 190 °C. The amplitude of the voltage corresponded to an electric field varying from − 1 to 1 MV m−1. All measurements were repeated five times on each of the five different samples to assess repeatability and experimental uncertainty.
Moreover, the saturation polarization Ps(T) and the dielectric constant εr(T) of each sample at temperature T were evaluated by linearly fitting the section of the bipolar D–E loops corresponding to a relatively large electric field decreasing from 1 to 0.5 MV m−1 according to [31]

The saturation polarization Ps(T) is equal to the electric displacement in the linear fit of D versus E extrapolated at zero electric field [28] and the slope of this linear fit corresponds to the product ε0εr(T) as illustrated in figure 1.
Moreover, isothermal unipolar D–E loops were collected on sample 5 for the same above temperatures. They were compared with bipolar D–E loops along with the associated values of εr(T) and Ps(T).
3.3. Olsen cycle
The Olsen cycle was performed on the PZN-5.5PT samples for (i) different values of low and high electric fields EL and EH, (ii) various hot operating temperature Thot and (iii) various cycle frequency f. The experimental set-up consisted of a thermal and an electrical subsystem. The experimental apparatus and procedure were identical to those used in our previous studies [13, 32] and need not be repeated. The cold operating temperature Tcold was fixed at 100 °C. The hot operating temperature was varied from 125 to 190 °C. The electric fields EL and EH ranged from 0 to 0.2 MV m−1 and from 0.5 to 1.5 MV m−1, respectively. The overall cycle frequency was defined as f = (τ12+τ23+τ34+τ41)−1, where τij corresponds to the duration of process i–j. It varied from 0.021 to 0.15 Hz by changing the duration of the isoelectric field heating and cooling processes 2–3 and 4–1, denoted by τ23 and τ41 (figure 1). However, the time rate of change of the electric field during the isothermal processes 1–2 and 3–4 remained the same at 0.4 MV m−1 s−1. Note that this rate was identical to that used to collect the D–E loops between − 1 and 1 MV m−1 at 0.1 Hz. In other words, τ12 and τ34 were equal and constant for a given electric field span. For example, τ12 = τ34 = 2.5 s for EH − EL = 1 MV m−1. The times τ23 and τ41 varied between 0.5 and 20 s corresponding to the cycle frequency varying from 0.15 to 0.021 Hz.
The energy density generated per cycle ND (expressed in J/l/cycle) is represented by the area enclosed by the cycle in the D–E diagram (figure 1). It was calculated by numerical integration of equation (1) using the trapezoidal rule. In addition, the power density PD is the amount of energy generated by the pyroelectric material per unit volume per unit time and is expressed in W l−1. It is defined as PD = NDf, where f is the Olsen cycle frequency.
4. Results and discussion
4.1. D–E loops
Figure 2 shows typical isothermal bipolar D–E loops at Tcold = 100 °C as well as loops for Thot equal to (a) 125 °C, (b) 150 °C, (c) 175 °C and (d) 190 °C obtained with sample 5. The isothermal D–E loops followed a counter-clockwise path. Figure 2 also shows that Olsen cycles corresponding to the above temperatures with EL = 0.0 or 0.2 MV m−1 and EH = 1.0 MV m−1. Results indicated that all [001] PZN-5.5PT samples were ferroelectric at 100, 125 and 150 °C. They were paraelectric at 190 °C as their saturation polarization vanished (figure 2(d)). In addition, samples 1 and 2 were paraelectric at 175 °C while samples 3, 4 and 5 were ferroelectric at 175 °C.

Figure 2. Isothermal bipolar D–E loops and experimental Olsen cycles at EL = 0.0 and 0.2 MV m−1 for PZN-5.5PT (sample 5) with Tcold = 100 °C and EH = 1.0 MV m−1 for Thot equal to (a) 125 °C, (b) 150 °C, (c) 175 °C and (d) 190 °C.
Download figure:
Standard imageMoreover, table 1 summarizes the values of Ps(T) and εr(T) retrieved from the isothermal D–E loops for each sample at different temperatures. The greatest inter-sample variability in D–E loops and in the resulting Ps(T) and εr(T) values was observed at 125 and 175 °C. The relative errors in Ps(T) and εr(T) among samples were less than 20% for temperatures 100, 150 and 190 °C. They were less than 25% and 30% for temperatures 125 and 175 °C, respectively. The variability at 125 °C can be attributed to the presence of mixed rhombohedral and tetragonal phases. In fact, the volume ratio of these phases may vary from one sample to another due to small chemical inhomogeneities [33]. The sample variability observed at 175 °C can be attributed to the fact that samples 3, 4 and 5 were ferroelectric with Ps ≈ 0.13 C m−2 while samples 1 and 2 were paraelectric at this temperature.
Table 1. Saturation polarization Ps(T) and dielectric constant εr(T) for the five [001] PZN-5.5PT samples used in this study.
| Sample | Properties | Units | |||||
|---|---|---|---|---|---|---|---|
| T | ( °C) | 100 | 125 | 150 | 175 | 190 | |
| 1 | Ps(T) | (C m−2) | 0.233 | 0.221 | 0.2049 | 0.0593 | — |
| εr(T) | — | 2535 | 4327 | 4833 | 16 684 | — | |
| 2 | Ps(T) | (C m−2) | 0.2554 | 0.2569 | 0.2322 | 0.0959 | 0.034 |
| εr(T) | — | 2937 | 3445 | 4352 | 13 889 | 12 781 | |
| 3 | Ps(T) | (C m−2) | 0.2078 | 0.2110 | 0.2222 | 0.1346 | 0.0529 |
| εr(T) | — | 3617 | 5620 | 5136 | 10 015 | 13 598 | |
| 4 | Ps(T) | (C m−2) | 0.2922 | 0.2801 | 0.2458 | 0.1308 | 0.0451 |
| εr(T) | — | 3500 | 3471 | 3840 | 10 448 | 14 364 | |
| 5 | Ps(T) | (C m−2) | 0.2967 | 0.2814 | 0.2397 | 0.1266 | 0.0384 |
| εr(T) | — | 3180 | 3180 | 4100 | 11 100 | 14 500 |
Finally, figure 3 compares unipolar and bipolar D–E loops performed on sample 5 at 100 °C. The unipolar D–E loop, corresponding to a frequency of 0.2 Hz, had the same time rate of change in the electric field as the bipolar D–E loop measured at 0.1 Hz. Note also that the unipolar D–E loops measured at 0.1 and 0.2 Hz were nearly identical. A notable difference between the unipolar and bipolar D–E loops at 100 °C was the absence of a field-induced phase transition in the unipolar loops. Such a phase transition was responsible for the nonlinear behavior of the bipolar D–E loops at low electric field. In contrast, the unipolar D–E loops followed a nearly linear path between 0.0 and 1.0 MV m−1. Figure 3 establishes that the unipolar D–E loops followed the upper curve of the bipolar D–E loop corresponding to a decreasing electric field. Thus, analysis of the unipolar D–E loops or the upper curve of bipolar D–E loops resulted in nearly identical values of saturation polarization Ps(T) and dielectric permittivity ε0εr(T). The same conclusions were reached at other temperatures (not shown). Finally, the D–E loops were closed for all temperatures indicating that there was no leakage current.
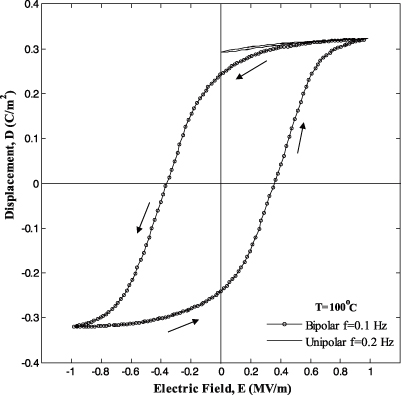
Figure 3. Isothermal bipolar D–E loops at 0.1 Hz and unipolar D–E loops at 0.2 Hz for PZN-5.5PT (sample 5) at T = 100 °C.
Download figure:
Standard image4.2. Effect of frequency on ND and PD
Figure 4 shows the isothermal bipolar D–E loops at temperatures 100 and 190 °C for sample 4. It also depicts the experimental Olsen cycle in the D–E diagram for sample 4 at various cycle frequencies between 0.021 and 0.15 Hz. The cycle followed a clockwise path and was performed between Tcold = 100 °C and Thot = 190 °C and electric field from EL = 0 MV m−1 to EH = 1.0 MV m−1. Note also that all the experimental Olsen cycles were closed and, unlike P(VDF-TrFE) [32], no leakage current was observed.

Figure 4. D–E diagram of isothermal bipolar D–E loops and experimental Olsen cycles at various frequencies for PZN-5.5PT (sample 4). The temperatures Tcold and Thot were maintained at 100 and 190 °C, respectively, and the low and high electric fields EL and EH were set at 0.0 and 1.0 MV m−1, respectively.
Download figure:
Standard imageFirst, it is interesting to note that the Olsen cycles measured at frequencies of 0.021 and 0.034 Hz overlapped. Indeed, for these frequencies, the electric displacement had reached steady state, i.e. ∂D/∂t = 0, before the electric field was varied. In this case, processes 1–2 and 3–4 followed a relatively smooth path, indicating that the four different processes in the Olsen cycle were performed under quasi-equilibrium conditions.
Moreover, for cycle frequencies larger than 0.034 Hz, the isoelectric field processes 2–3 and 4–1 were not performed under quasi-equilibrium conditions. For such cycle frequencies, the electric displacement had not reached steady state before the electric field was varied to perform processes 1–2 and 3–4. In other words, the phase transition was incomplete. In addition, the Olsen cycles did not follow a smooth path between EL and EH during processes 1–2 and 3–4 in the D–E diagram, as illustrated in figure 4.
Figures 5(a) and (b) respectively show the energy density and power density as functions of frequency for the Olsen cycles performed on sample 4 and reported in figure 4. Each data point corresponds to the energy density or power density averaged over five cycles. The associated error bars correspond to two standard deviations or a 95% confidence interval. The energy density reached a plateau of 140 J/l/cycle at frequencies below 0.034 Hz and decreased with increasing cycle frequency. Reducing the cycle frequency below 0.034 Hz, by increasing the duration of the isoelectric field processes 2–3 and 4–1, did not result in larger energy density because each process of the Olsen cycle was performed under quasi-equilibrium.
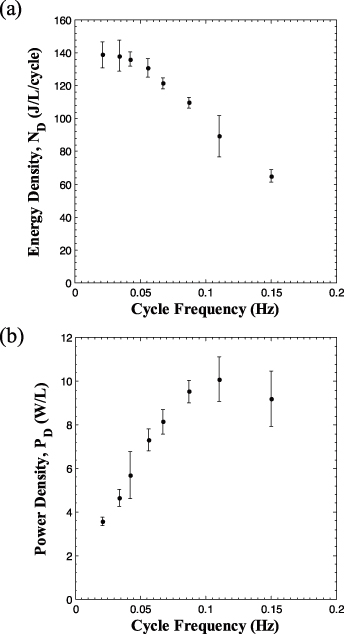
Figure 5. Experimentally measured (a) energy density and (b) power density generated with PZN-5.5PT single crystal (sample 4) as a function of cycle frequency. The temperatures Tcold and Thot were maintained at 100 and 190 °C, respectively. The low and high electric fields EL and EH were set at 0.0 and 1.0 MV m−1, respectively.
Download figure:
Standard imageConversely, the power density increased with increasing frequency and reached a maximum of 10.1 W l−1 at 0.1 Hz. For frequencies larger than 0.1 Hz, PD decreased with increasing frequency. This can be explained by considering the expression PD = ND(f)f. For frequencies less than 0.1 Hz, the decrease in ND(f), previously discussed, was compensated by the increase in frequency so that PD increased. However, beyond 0.1 Hz, ND decreased significantly with frequency, resulting in smaller values of PD. In practice, the operating frequency could be adjusted according to the power needed for a given load. Note that the frequency of 0.15 Hz corresponded to τ23 = τ41 = 0.5 s while the time required to physically transfer the sample between the hot and cold baths was ∼0.25 s per transfer.
Furthermore, the Biot number for the pyroelectric assembly (film with electrodes) is defined as Bi = hb/keff, where h is the heat transfer coefficient, and b and keff are the sample thickness and effective thermal conductivity, respectively. The heat transfer coefficient h = 300 W m−2 K−1 corresponded to convective quenching in an oil bath [34]. The effective thermal conductivity of the assembly was estimated using the series model. The thermal conductivity of PZN-5.5PT could not be found in the literature and was approximated to be that of PZT, i.e., k ≃ 1.2 W m−1 K−1 at room temperature [35] while that of gold was k = 310 W m−1 K−1 [36]. Thus, the effective thermal conductivity of the assembly of thickness b = 202 μm was keff ≃ 1.21 W m−1 K−1 resulting in Bi ≃ 0.05 or Bi ≪ 1. Therefore, the temperature was uniform across the sample and the lumped capacitance approximation was valid for all conditions considered [36].
Finally, the thermal time constant τ associated with processes 2–3 and 3–4 can be estimated as τ = ρeffcp,effb/h [36], where ρeff and cp,eff are the effective density and specific heat of the pyroelectric assembly, respectively. The thermal time constant was estimated to be 1.68 s for a 200 µm thick PZN-5.5PT film with ρ = 8000 kg m−3 [37] and cp = 312.5 J kg−1 K−1 [38] sandwiched between two 1 µm thick Au0.68Pd0.32 electrodes having ρ = 16 951 kg m−3 [39] and specific heat cp = 156.8 J kg−1 K−1. This time constant indicates that for cycle frequencies above 0.065 Hz the sample may have not reached thermal equilibrium during processes 2–3 and 4–1 of the Olsen cycle.
4.3. Sample variability at peak power
For practical purposes and for validating the model, it is important to assess sample variability. Figure 6 shows the power density generated experimentally as a function of high electric field EH at cycle frequency of 0.1 Hz for four different samples. Here also, each data point corresponds to the power density averaged over five cycles and the associated error bars correspond to two standard deviations. In these cycles, Tcold and EL were set to be 100 °C and 0.2 MV m−1, respectively. The temperature Thot varied from 125 to 190 °C while EH ranged from 0.5 to 1.5 MV m−1. Figure 6 demonstrates that, for all samples, the power density increases with increasing electric field EH and with hot source temperature Thot. The maximum power obtained was 11.7 W l−1 for Tcold = 100 °C, Thot = 190 °C, EL = 0.2 MV m−1 and EH = 1.5 MV m−1. Increasing the electric field EH beyond 1.5 MV m−1 during the Olsen cycle led to sample failure caused by excessive thermo-electro-mechanical stress.
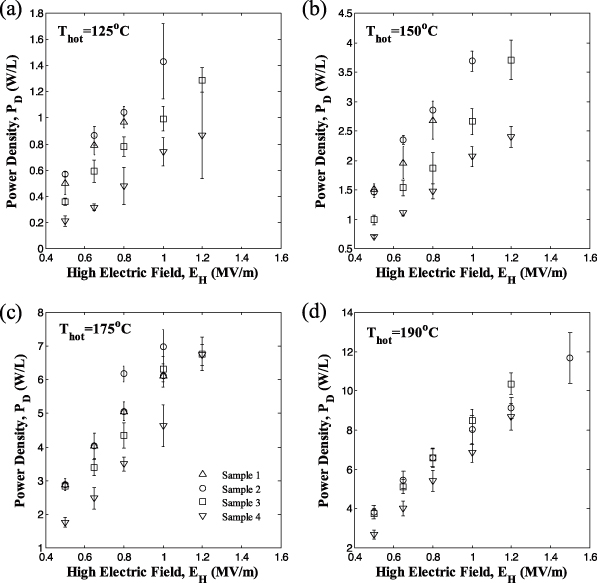
Figure 6. Experimentally measured power density generated at 0.1 Hz from four different samples of PZN-5.5PT single crystal as a function of high electric field EH for Thot equal to (a) 125 °C, (b) 150 °C, (c) 175 °C and (d) 190 °C. The temperature Tcold was maintained at 100 °C and the low electric field EL was set at 0.2 MV m−1.
Download figure:
Standard imageFurthermore, the maximum relative error in PD among samples for all values of EH was 18.3% for Thot = 125 °C. It decreased to 18.0%, 9.8%, and 6.5% as Thot increased from 150, 175 to 190 °C, respectively. The larger variability observed at lower temperature can be attributed to the large differences in the rhombohedral and tetragonal volume fractions among samples. This was already observed in the bipolar D–E loops and in the retrieved properties Ps(T) and εr(T). On the other hand, the value of EH was found to have no significant effect on sample variability.
4.4. Energy density under quasi-equilibrium conditions
Figures 7 and 8 show the generated energy density ND as a function of electric field EH for sample 5 with low electric field EL equal to 0.0 and 0.2 MV m−1, respectively. In all cases, the temperature Tcold was 100 °C while Thot was (a) 125, (b) 150, (c) 175 and (d) 190 °C. The cycle frequency was 0.034 Hz corresponding to Olsen cycles with quasi-equilibrium processes, as previously discussed. Results for EH = 1.0 MV m−1 correspond to the Olsen cycles shown in figure 2 for each value of Thot.
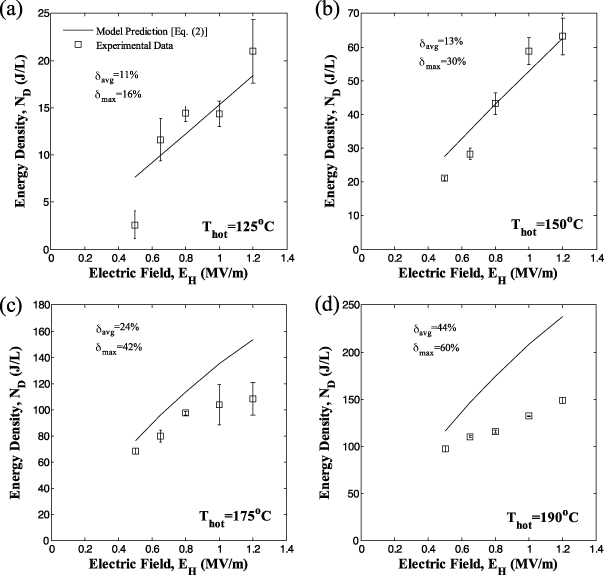
Figure 7. Experimentally measured energy density generated at 0.034 Hz from PZN-5.5PT single crystal (sample 5) versus high electric field EH for Thot equal to (a) 125 °C, (b) 150 °C, (c) 175 °C and (d) 190 °C. The temperature Tcold was maintained at 100 °C and the low electric field EL was set at 0.0 MV m−1. The solid line corresponds to predictions by equation (2) using properties retrieved from isothermal D–E loops (table 1).
Download figure:
Standard image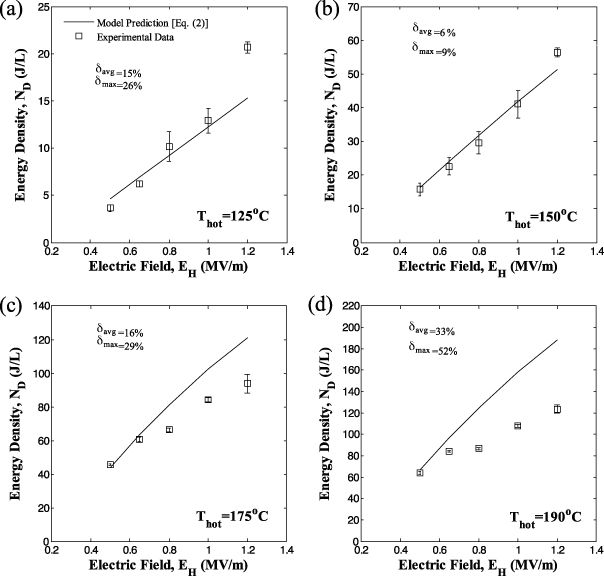
Figure 8. Experimentally measured energy density generated at 0.034 Hz from PZN-5.5PT single crystal (sample 5) versus high electric field EH for Thot equal to (a) 125 °C, (b) 150 °C, (c) 175 °C and (d) 190 °C. The temperature Tcold was maintained at 100 °C and the low electric field EL was set at 0.2 MV m−1. The solid line corresponds to predictions by equation (2) using properties retrieved from isothermal D–E loops (table 1).
Download figure:
Standard imageFigures 7 and 8 indicate that the energy density increased with increasing values of Thot and EH. They demonstrate that operating the cycle with Thot above TCurie = 165 °C yields significantly higher energy densities than cycles operating below TCurie. In fact, a maximum energy density of 150 J/l/cycle was achieved for operating temperatures between Tcold = 100 °C and Thot = 190 °C and electric fields EL and EH equal to 0.0 and 1.2 MV m−1, respectively.
In addition, increasing EL resulted in a decrease in the generated energy density. For example, the maximum energy density decreased from 150 to 124 J/l/cycle as EL increased from 0.0 to 0.2 MV m−1 for the same Tcold = 100 °C, Thot = 190 °C and EH = 1.2 MV m−1. This indicates that the PZN-5.5PT sample did not become depoled when lowering the applied electric field to 0.0 MV m−1, unlike observations made with PMN-32PT [13]. Since PZN-5.5PT retains its polarization at zero electric field, the isoelectric field cooling process 4–1 can be performed at EL = 0 MV m−1 which may simplify the practical implementation of the Olsen cycle.
Moreover, it is interesting to compare the maximum energy density of 150 J/l/cycle obtained with PZN-5.5PT with 100 J/l/cycle obtained with PMN-32PT for the same temperature difference (90 °C) and for EL and EH equal to 0.2 and 0.9 MV m−1, respectively. However, note that Tcold and Thot were 80 and 170 °C for PMN-32PT [13] instead of 100 and 190 °C for PZN-5.5PT. This suggests that these two materials should be operated in slightly different temperature ranges for optimum performance. This could be useful in a multistage pyroelectric converter as envisioned by Olsen et al [9]. Another material that could be included in the same multistage device is [110]-oriented PZN-4.5PT whose Curie temperature is around 157 °C [20] compared with 150 °C and 165 °C for PMN-32PT and PZN-5.5PT, respectively.
Finally, Khodayari et al [24] obtained 216.5 J l−1 with PZN-4.5PT single crystal samples with operating conditions Tcold, Thot, EL and EH equal to 100 °C, 160 °C, 0.0 MV m−1 and 2.0 MV m−1, respectively. The larger energy density obtained for PZN-4.5PT can be attributed to the larger electric field span (EH − EL) and to the lower Curie temperature. Indeed, the lower Curie temperature of PZN-4.5PT allowed for the tetragonal to cubic phase transition to occur for smaller temperature swing but with the same value of Tcold. This results in reduced thermal stress on the samples. It may also be why the PZN-4.5PT samples were able to withstand electric fields as high as 2.0 MV m−1 without sample failure [24, 25] compared with up to 1.5 MV m−1 in the present study.
4.5. Model predictions
Figures 7 and 8 also compare experimental energy density generated by sample 5 with predictions of the model given by equation (2). The saturation polarization and dielectric constant of sample 5 at Tcold and Thot retrieved from D–E loops are given in table 1. Here, the last term of equation (2), corresponding to the contribution of thermal expansion to the energy density, was ignored. Indeed, the Olsen cycles performed on PZN-5.5PT fell on or within the bounds of the isothermal D–E loops at Tcold and Thot (figure 2), indicating that thermal expansion did not contribute to the generated energy.
Figures 7 and 8 also report the average and maximum relative error between experimental data and model predictions denoted by δavg and δmax, respectively. Relatively good agreement was observed between model predictions and experimental data, particularly for temperature Thot less than 175 °C and EL = 0.2 MV m−1. Then, the average relative error was less than 24%. Both the average and maximum relative errors were larger for EL = 0.0 MV m−1 than for EL = 0.2 MV m−1 for any given temperature Thot. This can be explained by considering the isothermal D–E loops shown in figures 2 and 3. For low electric fields (E < 0.2 MV m−1) and for temperatures below TCurie = 165 °C, the material is ferroelectric and the electric displacement is a nonlinear function of the electric field. This nonlinearity was also observed by Zhu et al [25] for [110]-oriented PZN-4.5PT and was attributed to electric-field-induced phase transitions. This phenomenon was not accounted for by the above model which treated εr(T) as a function of temperature only [13]. However, εr(T) could be assumed to depend only on T for electric fields larger than 0.2 MV m−1 as previously discussed.
Moreover, figures 7(d) and 8(d) indicate that the average difference between experimental and model predictions reached 44 and 33% for EL = 0.0 and 0.2 MV m−1 at Thot = 190 °C, respectively. For such a large value of Thot, the model systematically overpredicted the experimental data. For Thot = 175 °C, the discrepancies can be attributed to the fact that the quasi-equilibrium Olsen cycles did not follow the isothermal D–E loop as the electric field was reduced from 1 to 0 MV m−1 (process 3–4) as illustrated in figure 2(c). This suggests that the sample did not undergo the same phase transition during the isothermal D–E loops and the Olsen cycle. However, for Thot = 190 °C process 2–3 of the Olsen cycles did not span the same electric displacement as the isothermal D–E loop as illustrated in figure 2(d). An electric displacement extending beyond the bounds of the D–E loops was attributed to positive thermal expansion by Kandilian et al [13]. Conversely, the reduced electric displacement span can be attributed to negative thermal expansion. The lattice parameters of PZN-5.5PT were reported to be constant between 190 and 100 °C [18] indicating zero thermal expansion, whereas the thermal expansion coefficient of Au0.75Pd0.25 was reported to be 12 μm m−1 K−1 [39]. The mismatch in thermal expansion coefficients between the electrode and the PZN-5.5PT sample induced a tensile stress in the material, which may have resulted in a decrease in sample thickness. This phenomenon was not observed for Thot = 125 and 150 °C as is evident in figures 2(a) and (b) where the Olsen cycles tended to follow the path of the unipolar D–E loops measured at Thot. Then, good agreement was observed between model predictions and experimental data.
4.6. Sample durability
The samples used in this study broke after 100–250 cycles. The successive thermal stress in combination with the electrically induced strains contributed to the samples eventually cracking and breaking. This explains why data were not reported for all samples under all conditions (figure 6). Strategies to increase the sample durability include (i) pre-stressing the sample such as in thin layer unimorph ferroelectric driver and sensor actuators [40] and (ii) applying a conformal coating (e.g. Parylene HT) to the sample [41].
5. Conclusion
This study presented experimental measurements of energy and power densities generated by performing the Olsen cycle on [001]-poled PZN-5.5PT single crystals. It showed that, as the cycle frequency increased, the energy density decreased while the power density increased up to 0.1 Hz when it reached a peak. For temperatures Tcold = 100 °C and Thot = 190 °C and electric fields between 0.2 and 1.5 MV m−1 the power densities reached a maximum of 11.7 W l−1 at 0.1 Hz. The maximum energy density achieved was 150 J l−1 at frequency 0.034 Hz for Tcold = 100 °C, Thot = 190 °C, EL = 0.0 MV m−1 and EH = 1.2 MV m−1. Sample variability was relatively small. It was the largest around 125 °C due to variation in the rhombohedral/tetragonal volume fraction among samples and around 175 °C due to differences in Curie temperature. Moreover, the dielectric constant and saturation polarization of PZN-5.5PT are presented in table 1 for temperatures between 100 and 190 °C at 0.1 Hz. Finally, the results confirmed the validity of a recently developed model [13] given by equation (2) predicting the energy density generated from ferroelectric single crystals using the Olsen cycle under quasi-equilibrium conditions.
Acknowledgments
This research has been supported in part by NSF-IGERT program Clean Energy for Green Industry at UCLA. The authors would like to thank Professor C S Lynch from UCLA for useful discussions and exchange of information.