
Abstract
The ratio of emission intensities of the second positive N2(C3Πu, v' = 0) → N2(B3Πg, v = 0), 337.1 nm and first negative  (B
(B →
→  (X
(X , 391.4 nm systems of nitrogen have been measured in a nanosecond surface dielectric barrier discharge (SDBD). The measurements were carried out in synthetic air for a pressure range 1–3 bar for different polarities of the high-voltage (HV) pulse. For all the investigated conditions, the ratio of emission intensities at the wavelengthes 391.4 and 337.1 nm, measured experimentally,
  is systematically higher for the positive polarity of HV electrodes.
To analyze the spatial distribution of N2(C3Πu) and  (B
(B emissions, comprehensive two-dimensional numerical modeling for P = 1 bar has been performed. The details of the formation of a narrow gap between the dielectric surface and the streamer channel in the case of positive polarity of HV electrodes are discussed. The ratio of integrated over space calculated emission intensities,
  , has been analyzed and compared with obtained experimental data. A good agreement was obtained for a negative polarity SDBD. For a positive polarity discharge,
  for all the considered conditions. Explanation for the observed effect is suggested.
Export citation and abstract BibTeX RIS
1. Introduction
The papers presented during the last few decades demonstrate that nonequilibrium nanosecond plasma can be effectively used for the combustion process [1–3] and for flow control [4, 5].
According to experimental results for discharges in air and nitrogen at different gas densities [6–10] and parameters of applied pulses [11–14] the nanosecond plasma is significantly non-uninform at higher than atmospheric pressures. The plasma non-uniformity complicates the measurements of the electric field, electron density and temperature which are necessary for the proper description of the energy balance in a plasma. Spatially and temporary resolved measurements of the electric field in a single streamer dielectric barrier discharge (DBD) were presented for the first time in [15]. Characteristic values of the reduced electric field in the streamer channel, calculated from the measurements of N2 emission, are near 200 Td. Non-uniformity of the emission distribution in the streamer channel occurs on the scale of fractions of millimeters. In the case of surface DBD (SDBD), the scale of the discharge non-uniformity is smaller than for volumetric DBD [9, 10] and the emission measurements require a higher spatial resolution and are complicated because of the presence of the dielectric surface in the discharge region.
Additional information about spatial distribution of plasma parameters in the non-uniform discharges can be obtained by means of numerical modeling [12, 16–21]. The papers by Likshanskii et al [12], Soloviev and Krivtsov [16] and Zhu et al [20] present the results of calculations for SDBD in plane-to-plane geometry at atmospheric pressure. The modeling was performed in 2D-geometry, when 3D propagation of a set of discharge channels is substituted by the propagation of a semi-infinite plasma layer. A cross-section of the plasma layer in the plane perpendicular to the electrodes will be further referred to as 'streamer' or 'discharge channel' when discussing numerical modeling. So, the discharge propagates in a streamer form along the dielectric surface in a direction perpendicular to the high-voltage (HV) electrode.
The key phenomena for SDBD is the charging of the dielectric surface on the length of the discharge propagation. In their paper [16], Soloviev and Krivstov compare the development of the discharge initiated by HV single pulses of positive or negative polarity. The results of numerical simulations presented in their paper show that for both polarities, the distributions of electron density and electric field across the discharge channel are non-uniform: the characteristic discharge thickness is not higher than a fraction of a millimeter. However, the discharges are qualitatively different for different polarities.
For the positive polarity the discharge develops as a streamer located at some distance above the dielectric surface. For the negative polarity the discharge contacts the dielectric and slides along the surface without a streamer formation. For both HV electrode polarities the characteristic discharge thickness is not higher than a fraction of a millimeter.
According to a commonly used definition, the streamer implies a creation of a highly ionized self-consistent streamer head region, which provides gas ionization in front of the head and further streamer propagation. The electric field in the streamer head is strongly localized and high, about 1000 Td. The field in the front of the negative polarity discharge is diffuse and relatively weak, around a few hundred of Td [16]. This remarkable difference between positive and negative polarity cases, by means of the the numerical modeling, can be used to extract more information about the development mechanism of surface discharge channels.
Numerical modeling for the repetitive discharges [11, 12] demonstrates a significant role of the gas preionization and the residual charges on the surface. For this reason, it is preferable to make a comparison between the experiments and numerical modeling for the single pulse mode.
The aim of the present work is to analyze, on the basis of the experimental measurements and comprehensive numerical modeling, the behavior of the electric field in a nanosecond SDBD initiated by HV single pulses of different polarities.
2. Experimental setup and techniques
A cylindrical electrode system, used in [23] for initiation of combustion, is schematically described in figure 1. The central coaxial HV electrode is connected to a copper disk, 2 mm in thickness and 20 mm in diameter. The inner diameter of the low voltage aluminum electrode is equal to the outer diameter of the HV electrode. The outer diameter of low voltage electrode is equal to 46 mm. A dielectric PVC layer 0.3 mm in thickness is placed between the electrodes to avoid the short circuit. The electrode system is connected to the HV generator through a 30 m coaxial 50 Ω cable. The FID HV pulse generator FPG20-03NM used in experiments provides the following parameters: 0.5 ns pulse front rise time, 20 ns pulse duration and ± (12–30) kV voltage range (see figure 1). The effective voltage applied to the electrode system to initiate the discharge is equal to doubled voltage in the cable connecting the HV generator and the electrode system [22]. The discharge in considered geometry starts from the edge of the HV electrode and propagates radially above the surface of the PVC layer as the set of channels.
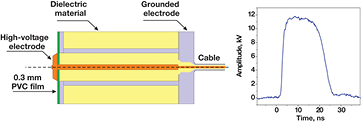
Figure 1. Electrode system and applied pulses.
Download figure:
Standard image High-resolution imageTwo calibrated back current shunts (BCS) were installed into the cable connecting the discharge electrode system and HV generator: one (BCS1) in the middle of the cable and another one (BCS2) at 1 m from the HV generator. BCS1 was used to measure the voltage applied to the electrode system and the energy deposited into the discharge. BSC2 was used for the synchronization of optical diagnostics with the discharge. The signals from BCS were registered by a LeCroy WaveRunner 600 MHz oscilloscope.
A general scheme of experimental setup is presented by figure 2. The electrode system described above is inserted into a high pressure discharge cell made of stainless steel to perform the discharge experiments in synthetic air at pressures up to 3 bar. The pressure is controlled by two gauges: a Pfeiffer capacitive vacuum gauge for the pressures lower than 10 Torr and an SCM capacitive gauge for the pressures higher than 1 bar. The cell has three optical quartz windows for optical diagnostics with a thickness of 15 mm and a diameter of 50 mm each. One optical window is situated in front of the electrode system and two others allow observation of the discharge development from the side. To select the emission from different zones of the discharge, three concentric plastic ring diaphragms of different diameters are installed 3 mm above the dielectric layer coaxially to the electrode system. The diaphragms select the rings 0–1 mm, 2–4 mm and 5–7 mm from the HV electrode edge respectively.

Figure 2. Experimental scheme of electric field measurements. BCS, back current shunt; HV, high voltage; PMT, photomultiplier; SDBD, surface dielectric barrier discharge.
Download figure:
Standard image High-resolution imageAndor SR-500i monochromator (1200 l mm−1 grating, 1.65 nm mm−1 dispersion) combined with Hamamatsu H6610 photomultiplier tube (PMT) was used for spectral diagnostics. The temporal resolution of PMT is 0.7 ns.
To study spatial structure and development of the surface discharge, a 2D map of emission integrated over the wavelength range 300–800 nm was recorded with an (ANDOR) ICCD camera iStar DH-734. The minimal camera gate is equal to 2 ns. Emission in 300–800 nm range at considered conditions corresponds mainly to the second positive system of molecular nitrogen. Since the quenching of excited nitrogen by molecular oxygen is strong (k = 2.73 · 10−10 cm3 s−1, see) [24], the images adequately reflect the spatial structure of the discharge. The camera was triggered by the signal from BCS. The delay of the camera gate was varied to obtain an ICCD image of the discharge development.
To analyze the electric field behavior, the ratio of intensities of the spectral bands of molecular nitrogen corresponding to transitions  (B
(B →
→  (X
(X , 391.4 nm and N2(C3Πu, v' = 0) → N2(B3Πg, v = 0), 337.1 nm was measured. The core idea of this technique is that at conditions of direct excitation by electron impact the ratio of emissions of different molecular bands can be used to measure the electric field. The density of excited molecules [N*] is governed by the following equation:
where kexc is the rate constant of excitation by electron impact, ne is an electron density, τ0 is a life time of excited nitrogen molecules,  are the quenching coefficients, [Mi] is the density of quenching molecules (N2 and O2 in our case). The rate constant of excitation by electron impact kexc is given by the equation:
where εth is the energy threshold of the excitation cross-section and f(ε) is the electron energy distribution function. The ratio of the rate constants for  (B
(B and N2(C3Πu) excitation by electron impact can be expressed as:
where subscripts B and C note the considered excited states of nitrogen. Since the emission intensities are proportional to the concentrations of the excited species, the ratio kB/kC can be obtained from equation (3) when the ratio of emission intensities I391/I337 is experimentally measured. If two electronic states are characterized by significantly different threshold energies εth and cross-sections of excitation, the ratio of their rates of excitation will be sensitive to mean electron energy and consequently to reduced electric field E/N. Excitation thresholds for  (B
(B and N2(C3Πu, v' = 0) are equal to εC = 11.03 eV and εB = 18.4 eV respectively and their cross-sections peaks at ≈17 eV for N2(C3Πu, v' = 0) and ≈100 eV for N2(B3Πg, v = 0). So, the considered excited states are good candidates for E/N measurements. This technique has been suggested by Paris et al in [25] and used by Starikovskii et al [28] and Kosarev et al [29]. In [26], Paris et al presents direct experimental measurements of R391/337 ratio as a function of measured E/N and they suggest the empirical equation:
In another paper, Paris et al [27] demonstrates the validity of method (1)–(4) by comparing calculated values with the measured values in the previously cited paper by Paris et al [26]. Detailed analysis of the approach proposed in that paper [26] for the case of nanosecond SDBD at high pressures can be found in Kosarev et al [29].
The emission from SDBD was focused onto the input slit of the monochromator with an attached photomoltiplier. The slits of the monochromator were adjusted so that only the molecular band of interest was monitored during the experiments. The entrance slit of the monochromator was set to the value of 1.84 mm for the recording of the emission of the second positive system of N2 and 1.05 mm for the measurements of the emission of the first negative system of N2. The output slit for both cases was 0.1 mm. Figure 3 represents typical results of emission measurements used to obtain the reduced electric field. Figure 3(a) demonstrates the emission intensities of the first negative and the second positive systems of nitrogen. It is seen that high signal-to-noise ratio for both emission systems is observed during the first 5 ns. This time interval was used for further analysis. Figure 3(b) represents the ratio between emission intensities R391/337 which allows, following the technique presented in Paris et al [26], for the determinination of the reduced electric field E/N presented in figure 3(c).
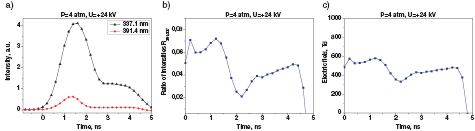
Figure 3. Technique for field calculation by emission measurements (a) emission intensities at 337.1 nm and 391.4 nm; (b) ratio of emission intensities R391/337; (c) electric field calculated from the emission intensities.
Download figure:
Standard image High-resolution imageAll the experiments presented in this paper were performed at single shot mode in synthetic air and without a gas flow. Reproducibility of the incident and reflected HV pulses (within a few percents), emission and ICCD images from pulse-to pulse were checked in a series of additional experiments when the gas was changed before each discharge. It was checked that the experiments without changing the gas when the discharge starts at 30 s each are identical to the experiments when the gas is replaced between the discharges. Finally, all the ICCD images were taken as single-shot images each 30 s without changing gas and the emission was averaged by 30 pulses. The gas pressure was varied from 1 to 6 atm in different experiments. Synthetic air (80% N2, 20% O2, Air Liquide, impurities did not exceed 3 ppm) has been used for the experiments.
3. Experimental results
If the technique for electric field measurements considered in the previous section is applied to significantly non uniform plasma, a special analysis is needed to link the ratio of intensities to the electric field. Nanosecond surface DBD discharge represents a complex 3D structure with a relatively uniform distribution of emission along the electrode edge: the discharge starts and develops as a set of synchronized channels. In our previous paper [8] it was found that, at high pressures and applied voltage, the negative polarity discharge transforms into strongly non-uniform filamentary form, when each 5–7 discharge channels merge together. To ensure that all the electric field measurements are performed in quasi-uniform 'channel' mode, the fast ICCD imaging of the discharge has been performed.
3.1. ICCD imaging
Figure 4 represents the results of frontal ICCD imaging of the discharge at different gas pressures and voltages. The camera gate is 2 ns. It is seen that the discharge consists of a lot of emitting channels propagating in a radial direction from the edge of the HV electrode to the edge of the grounded electrode. The characteristic optical diameter of the channels is equal to 0.3–1 mm.

Figure 4. Comparison of ICCD images for different polarities of applied pulses and different gas pressures. Synthetic air.
Download figure:
Standard image High-resolution imageThe typical value of the channel propagation speed Vch at considered conditions is a few mm per ns. The maximal observed speed Vmax = 4.7 mm ns−1 is reached at P = 1 atm and U = + 46 kV.
Figure 5 represents the dependencies of the distance between the edge of the HV electrode and head of the channel versus time. It is seen from figure 5(a) that at P = 1 atm and U = ± 24 kV there is a significant difference in channel speed for different polarities. The channel speed is the same for both polarities only first 1–2 ns. During this period the discharge channels reach the region which is 5 mm apart from the HV electrode edge. Then the channels significantly slow down for the negative polarity case and finally do not reach the edge of the grounded electrode. In the case of positive polarity, channels (streamers) propagate with approximately the same speed Vst = 3.2 mm ns−1 along the dielectric surface until they reach the edge of the grounded electrode. Figure 5(b) demonstrates the dependence of the distance between the edge of the HV electrode and the head of the streamer versus time for two cases: P = 1 atm, U = + 46 kV and for P = 3 atm, U = + 24 kV. Comparing these results to those presented in figure 5(a) one can conclude that the streamer speed decreases with pressure and increases with higher amplitude of applied pulses.
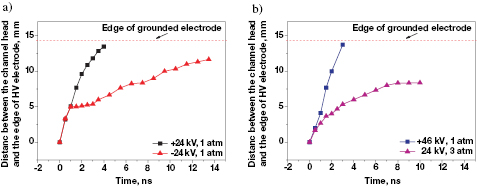
Figure 5. Distance between the HV electrode edge and the channel head for different pressures and voltages: a) P = 1 atm, U = ±24 kV; b) P = 1 atm, U = ±46 kV and for P = 3 atm, U = ±24 kV. Synthetic air.
Download figure:
Standard image High-resolution imageFigures 4 and 5 allow for the estimation of the position of discharge channels at different instances for the investigated conditions for further electric field measurements.
3.2. Electric field measurements
Measuring the ratio of emission intensities, we obtain the value
where the integration is performed over the plasma bulk Vpl from where the emission is collected. The R391/337 determined by (5), in a general case does not correspond to the electric field averaged over Vpl, which must be determined by the equation:

Equations (5) and (6) coincide only in the case of uniform plasma.
The results of ICCD imaging presented in the previous subsection demonstrate relative azimuthal uniformity of the discharge. This means that the emission, collected by a ring diaphragm, can be considered as an average value corresponding to a given distance from the electrode. The measurements of the intensities ratio R391/337 were performed with diaphragms at different distances from the HV electrode edge: 0–1 mm, 2–4 mm and 5–7 mm. The experiments were performed at three different gas pressures: 1–3 atm.
Before we discuss the morphology of the SDBD and the distribution of the emission of 2 + and 1− system in the direction perpendicular to the dielectric surface, we will call the electric field calculated from the measured intensity ratio R391/337 with equation (4) 'the efficient reduced electric field', (E/N)eff.
Figures 6–8 represent the evolution of the reduced electric field (E/N)eff obtained for 1–3 atm respectively. Each figure consists of two columns corresponding to positive and negative polarities. The region where the presented electric field was measured is written in the top right corner of each single plot in the frame of figures 6–8. Time t = 0 for each single plot in figures 6–8 corresponds to the instant when the discharge channels reach the considered region. The voltage amplitude of the pulses applied in presented measurements is 24 kV.

Figure 6. Evolution of the electric field at different distances from the HV electrode. P = 1 atm, U = ± 24 kV. Synthetic air.
Download figure:
Standard image High-resolution image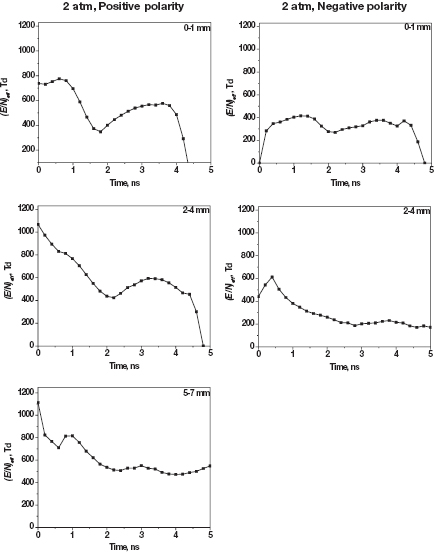
Figure 7. Evolution of the electric field at different distances from the HV electrode. P = 2 atm, U = ± 24 kV. Synthetic air.
Download figure:
Standard image High-resolution image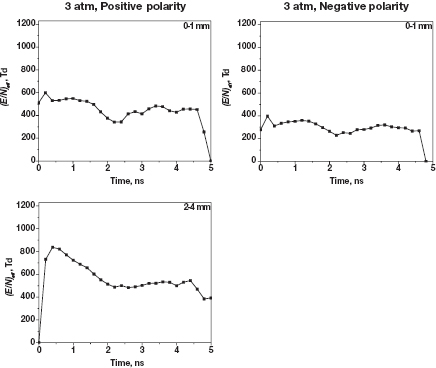
Figure 8. Evolution of the electric field at different distances from the HV electrode. P = 3 atm, U = ± 24 kV. Synthetic air.
Download figure:
Standard image High-resolution imageSome of (E/N)eff dependencies at 5–7 mm from the HV elecrode and P > 1 atm are not presented because of lower emission intensity in this region at high pressures and negative polarity of the applied pulses.
For all the figures demonstrating the reduced electric field evolution the value of (E/N)eff typically reaches its maximum in first 1–2 ns, then it decreases and than rises again until it reaches a value lower than the first maximum.
Obtained experimental results can be summarized in the following manner: at the same voltage pulse amplitude and front rise time, SDBD develops in a different way depending upon the polarity of the HV electrode. Characteristic values of the measured electric field are hundreds of Td and they are higher for the positive polarity of the HV electrode. Maximal observed velocities of SDBD front propagation, about 5 mm ns−1, correspond to the positive polarity on the HV electrode and to 1 atm pressure. Significant attenuation of the front velocity is observed with the pressure increase. For the negative polarity HV electrode, discharge starts with the same velocity but slows down significantly during the first 1–2 ns.
The absolute values of (E/N)eff obtained in the present work are in rather good correlation with previously observed electric fields E/N(t) at positive polarity [29] and with the maximum values of electric field for P = 1 atm obtained for both polarities [14].
It should be noted that, although according to the results of ICCD imaging, the discharge is rather uniform azimuthally at considered conditions, it can be non uniform in the direction perpendicular to the surface. Kosarev et al [29] suggest, on the basis of available numerical modeling for positive polarity [16, 30, 33], an existence of a narrow (tens of µm) gap where the electric field is higher than in the streamer channel and the electron density is lower. As a result the emission from the discharge region consists of  (B
(B emission from the gap and of N2(C3Πu) emission from the streamer channel. Integration of emission according to equation (5) will result in higher values of (E/N)eff compared to real values of the reduced electric field.
To analyze spatial distribution of the emission of two considered bands, obtained experimental data were compared with comprehensive numerical modeling.
4. Numerical modeling and discussion
Numerical simulation of SDBD evolution has been carried out for atmospheric air in 2D approximation on the basis of a physical and numerical model developed by Soloviev and Krivtsov and Soloviev et al [16, 30]. The list of reactions used for estimation of the N2(C3Πu) radiation per unit volume IC = NC/τC is shown in table 1. Here NC is the concentration of N2(C3Πu) molecules defined by local balance equations and τC is the radiation lifetime of these molecules.
Table 1. Rate constants for radiation intensity calculation.
| Number | Reaction | Rate constant, cm3 s−1 | Reference |
|---|---|---|---|
| R1 | e + N2 → N2(C3Πu) + e | 10−8.2 − 21.1/γa | [31] |
| R2 | N2(C3Πu) + O2 → N2(X) + O2 | 3 · 10−10 | [32] |
| R3 | N2(C3Πu) + N2 → N2 + N2 | 1 · 10−11 | [32] |
| R4 | N2(C3Πu) →  (B (B + hν + hν |
1/τC = 3 · 107 s−1 | [32] |
Calculations have been fulfilled for positive and negative polarity of HV exposed electrodes for the same voltage amplitude value U0 = 24 kV. Dielectric thickness is d = 0.3 mm, its relative dielectric permittivity ε = 3 and the length of a prominent part of the encapsulated grounded electrode Le = 5 mm. The reference point of the coordinate system is located on a dielectric surface near the edge of the exposed electrode. Both electrodes were assumed to be infinite in negative x-direction.
The evolution of the reduced electric field E/N for (a) negative polarity discharge and (b) positive polarity discharge is shown in figure 9; whereas a typical profile of electron density, E/N and radiation intensity of N2(C3Πu) and  (B
(B in a normal to dielectric surface direction are presented in figure 10.

Figure 9. Calculated isolines of E/N: (a) negative polarity discharge, U = − 24 kV; (b) positive polarity discharge, U = + 24 kV.
Download figure:
Standard image High-resolution image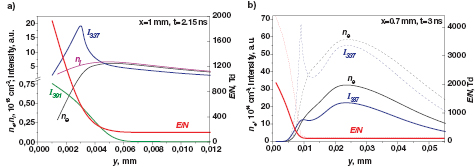
Figure 10. Reduced electric field, electron and ion density, emission at λ = 337.1 and 391.4 nm as functions of distance from the dielectric surface: (a) for negative polarity discharge; (b) for positive polarity discharge. Dashed lines at (b) represent calculations with 3D corrections (see explanations in the text).
Download figure:
Standard image High-resolution imageIt is seen from figure 9 that contours of the electric field represent a complex structure changing significantly in the normal to dielectric surface direction (y-axis). Both for negative and positive polarity discharge, the electric field decreases gradually with the y coordinate in the vicinity of the dielectric surface, because the charge surplus concentrates near the surface. For the negative polarity discharge it is a negative charge surplus primarily formed by electrons. Because of electron high mobility this extra charge is mainly represented by a surface charge of electrons that have reached the dielectric surface and are stuck on it. For the positive polarity discharge, the positive excessive charge is formed by heavy positive ions. The ion mobility is approximately 200 times less than the electron one; accordingly, the positive excessive charge is distributed over a thicker layer above the dielectric surface. The layer thickness for E-field steep drop off is near 0.003 mm for the negative discharge and 0.01 mm for the positive one (see figure 10).
For both polarities of the HV electrode, the electron density near the dielectric surface is close to zero, but the physical reasons for this phenomenon are different for different voltage signs. For the positive polarity, the normal component of the electric field is directed toward the surface. Accordingly, the electrons move from the surface and create a gap in the electron density between the surface and a streamer body. The gap corresponds to the region of the high electric field near the surface, clearly seen in figure 9.
For the negative polarity, two main phases can be distinguished. At the beginning of a discharge formation, the normal component of the electric field is directed from the surface. As a result, the electrons drift to the surface and the surface charge becomes high enough to compensate the normal component of the external electric field. At the second stage, the negative charge on the surface continues to grow due to electron diffusion flux [16]. This extra negative charge creates an opposite to initial normal component of electric field near the surface, which is directed to the surface and compensates the electron diffusion flux by the backward drift flux. Finally, after the creation of a surface charge, for the negative electrode polarity the normal component of the electric field on the surface is directed to the surface, as in the case of positive polarity and results in a zero electron concentration near the surface.
Emission intensity is defined by a product of electron density ne and a rate constant of N2 excitation by electron impact (reaction R1 in table 1), which is strongly managed by E/N value. Because of aforementioned E/N and ne profiles over normal to the surface direction, the radiation intensity has a non-monotonic dependence over y-direction shown in figure 10.
It was mentioned above that one of the main aims of the numerical modeling in this work is to estimate the distribution of the intensity ratio R391/337 in the y-direction and to compare the theoretical results with the experimental data. In the process of measurements, emission was collected by a spectrometer and photomultiplier situated far away from the electrode system. As for the distance between the registration system and discharge being much larger than a typical size of the diaphragm, we can consider the process of measurements as integration of emission in the y-direction. This is schematically presented in figure 11.

Figure 11. Scheme of data collection in the experimental procedure and integration of the numerical result. The window marked in red corresponds to the region of integration.
Download figure:
Standard image High-resolution imageTo compare the results of numerical modeling with the experimental data the following procedure has been performed:
- (a)The emission of the first negative system of the nitrogen molecular ion I391(x, y, t) at λ = 391.4 nm was estimated on the basis of numerically calculated E/N(x, y, t) and I337(x, y, t). The equation (4) relating the intensities of first negative and second positive systems in nitrogen was used for this procedure.
- (b)The calculated emissions of the first negative system I391(x, y, t) and second positive system I337(x, y, t) for a given time instant t were integrated along the y-axis for a given position x. The ratio R391/337 of two obtained integrals (see equation (5)) is:
 is plotted in figure 12 as a function of y for the different distances from the HV electrode edge. High values of the ratio at y < 0.05 mm are explained by dominant emission of molecular nitrogen ion in the vicinity of the dielectric surface. With the increase of the distance from the surface y = 0,
  drops down dramatically due to the predominant radiation of the second positive system. Starting from about y = 0.05 mm, the ratio of integrals reaches some asymptotic value
  . This means (see equation (7)) that at y > 0.05 mm the contribution of any emission bands to R391/337 is almost negligible.

Figure 12. Calculated ratio of emissions R391/3337, determined by equation (7).
Download figure:
Standard image High-resolution imageThe range of  variation with x along the discharge channel is limited (see figure 12) and is different for positive and negative electrode polarities, accordingly, the envelope over this range value can be used for comparison with experimentally obtained data.
The comparison for the positive and negative polarity of the applied pulse is given by figure 13. Two shaded rectangle areas correspond to the calculated  (∞) (as in figure 12) for all possible x and t except the discharge front. Two pairs of dashed horizontal lines select experimentally obtained ratios of emission. The ratio of emission can be related to the electric field, (E/N)eff plotted in figures 6–8, by the empirical curve (solid curve in figure 13) taken from [26] and described by equation (4).

Figure 13. Comparison of experimental and theoretical results for different polarities of applied pulses.
Download figure:
Standard image High-resolution image
It is clearly seen from figure 13, that for the negative polarity discharge numerical calculations and experimental results are in a good agreement: the calculated  (∞) values fit perfectly the domain of
  (∞) obtained in the experiments. For the positive polarity discharge no correlation between theoretical and experimental results is observed: experimentally measured ratios
  (∞) are much higher than the theoretical ones. The possible explanation for the considered disagreement is that a 2D model used for calculations is not accurate enough for streamer channel dynamics: a 3D process of streamer body decay described by Soloviev and Krivtsov [34] could be significant.
According to a suggested hypothesis [34], for a positive electrode polarity the streamer channel in a surface barrier discharge rapidly loses its conductivity (in a time of around 10 ns) because of 3D ion drift from the streamer body onto the dielectric surface. This process is accompanied by E-field increase inside a streamer channel. The results of the E/N(y), ne(y) and I337(y) calculation based on Soloviev and Krivtsov's model [34] accounting for the aforementioned 3D effect are shown in figure 10 by dashed lines. A significant increase of E/N in the gap between the streamer body and the dielectric surface is predicted. The reduced electric field E/N grows up inside a streamer body as well. For these data the ratio  (∞) increases on 10% and becomes closer to experimental data but still remains below the 'corridor' of experimental measurements. An insufficient increase of
  (∞) can be referred to a not exact calculation of the 3D problem: the 3D ion drift effect has been estimated by applying a modeling additional ion sink terms in 2D approach.
5. Conclusions
Time-resolved emission of the 1− and 2+ systems of molecular nitrogen was measured in a nanosecond SDBD in synthetic air. The measurements were performed in the pressure range 1–3 atm for the distances 0–6 mm from the HV electrode. The reduced electric field (E/N)eff, calculated assuming that the emission distribution of the two molecular bands is uniform in the considered volume, coincides with the data presented in the literature and with previous measurements. It was found that the measured ratio R391/337 is noticeably higher for a positive polarity of the discharge for all investigated ranges of parameters.
To analyze the spatial distribution of emission of  (B
(B → X
→ X and N2(C3Πu, v' = 0 → B3Πg, v = 0) transitions, numerical modeling of the SDBD discharge in air in 2D geometry has been used. The simulations predict an extremely sharp decrease in E/N from 2000 to 200 Td in a narrow zone above the dielectric, δ = 3 µm for a negative polarity pulse and δ = 10 µm for a positive polarity pulse. According to calculations, the main emission of
  (B
(B at 391.4 nm comes from this zone. Above, the electric field remains practically unchanged, 100–200 Td, for the distances l > δ. The main emission of N2(C3Πu) molecules at 337.1 nm comes from this zone. A negative polarity discharge in calculations has a diffuse structure, whereas for a positive polarity discharge this zone can be related to a streamer body. So, for surface discharge at atmospheric pressure the direct E/N measurements based on the ratio of emission from two molecular bands demand the emission to be recorded with the spatial resolution of at least 10 µm.
The experimental results, obtained with a resolution lower than the plasma non-uniformity scale, can nevertheless be used for validation of the numerical model. Comparison of the measured R391/337 ratio with the ratio of the intensities integrated in the direction perpendicular to the surface of the dielectric showed the following: for a negative polarity discharge the calculated ratio of intensities is within the limits of experimentally measured R391/337. For a positive polarity discharge, the discrepancy between theoretically predicted and measured R391/337 values is significantly higher than the experimental uncertainty. This correlates with the hypothesis [34] that a 2D approach is not accurate for streamer channel dynamics in a positive polarity discharge and that 3D effects can be significant. Preliminary numerical modeling taking into account the ion drift from the streamer channel to the dielectric surface results in better correlation with experimental data, but a full scale 3D numerical approach is necessary for robust comparison with experiments.
Acknowledgments
The authors are grateful to J Guillon for technical assistance and to Prof S Macheret for fruitful discussions. The work was partially supported by French National Agency, ANR (PLASMAFLAME Project, 2011 BS09 025 01), AOARD AFOSR, FA2386-13-1-4064 grant, LabEx Plas@Par, PUF (Partner University Foundation), by the RFBR project No. 14-08-00400 and by Russian Ministry of Education and Science under the program '5Top100'.