
ABSTRACT
We combine derived ion–electron pair formation rates with Cassini Radio Plasma Wave Science Langmuir Probe measurements of electron and positive ion number densities in Titan's sunlit ionosphere. We show that positive ion number densities in Titan's sunlit ionosphere can increase toward significantly lower altitudes than the peak of ion–electron pair formation despite that the effective ion–electron recombination coefficient increases. This is explained by the increased mixing ratios of negative ions, which are formed by electron attachment to neutrals. While such a process acts as a sink for free electrons, the positive ions become longer-lived as the rate coefficients for ion–anion neutralization reactions are smaller than those for ion–electron dissociative recombination reactions.
Export citation and abstract BibTeX RIS
1. INTRODUCTION
Titan, the largest moon of Saturn, hosts a dense and extended atmosphere dominated by N2 and CH4, and a chemically complex ionosphere as revealed in particular by the Cassini mission (e.g., Wahlund et al. 2005; Vuitton et al. 2007; Waite et al. 2007; Crary et al. 2009; Mandt et al. 2012). The electron number densities peak typically at values 2000–5000 cm−3 on the dayside and 500–1000 cm−3 on the nightside at altitudes between 1000 and 1200 km (e.g., Ågren et al. 2009; Kliore et al. 2011; Shebanits et al. 2013). On the dayside the location and magnitude of the electron number density (ne) peak displays a Chapman-like behavior, with a higher altitude and a lower magnitude of the ne-peak with increased solar zenith angle (Ågren et al. 2009). Solar photons, associated photoelectrons (and secondary electrons ejected from electron-impact ionization events), are the dominant ionization sources of Titan's dayside main ionosphere (e.g., Ajello et al. 2007; Ågren et al. 2009; Robertson et al. 2009; Galand et al. 2010). Non-solar ionization sources, such as electron precipitation from Saturn's magnetosphere, typically contribute only a few percent to the total ionization rates in Titan's main ionosphere on the dayside. Enhanced electron number densities have been occasionally observed, as reported by Kliore et al. (2011) and by Edberg et al. (2013). The latter linked the elevated dayside electron density during the T85 flyby to a coronal mass ejection causing an enhancement in particle precipitation at Titan and in the subsequent particle-impact ionization rates.
Vigren et al. (2013) showed that a solar-driven energy deposition model captures the shape of the observed electron number density profile in Titan's sunlit ionosphere but over-determines the magnitude by a factor of ∼2. They highlighted that their approach to calculate electron number density, which is based on Cassini Ion Neutral Mass Spectrometer (INMS) ion composition (<100 amu) and dissociative recombination as the only loss of thermal electrons, is no longer valid below ∼1050 km. In such a region the ion population becomes very complex and dominated by ions heavier than 100 amu (Crary et al. 2009; Wahlund et al. 2009). There is a limited knowledge on dissociative recombination rate coefficients for such complex ions and, in addition, another loss process for free electrons, attachment to neutrals, becomes increasingly important as attested by the presence of negative ions (anions) in the deep ionosphere.
Based on measurements by the Electron Spectrometer (ELS, a subsystem of the Cassini Plasma Spectrometer, CAPS), Coates et al. (2007) reported the first detections of negative ions in Titan's ionosphere. Based on CAPS/ELS data from 23 Titan flybys Coates et al. (2009) showed that high mass anions (with masses of several thousand atomic mass units) are seen preferentially near the solar terminator and revealed also that anion sizes overall increase with decreasing altitude. Only the low mass anions detected by the CAPS/ELS have so far been chemically identified, namely as CN−, C3N−/C4H− and C5N− (Vuitton et al. 2009). Ågren et al. (2012) analyzed Radio Plasma Wave Science Langmuir Probe (RPWS/LP) data from the deep T70 flyby (the flyby reaching the lowest altitude to date) and showed that negative ions were significantly more abundant than free electrons near 900 km. Shebanits et al. (2013) presented RPWS/LP derived total positive ion densities, nP, and electron number densities, ne, for 47 Titan flybys by the Cassini spacecraft, from which they inferred negative ion charge densities under the assumption of charge neutrality. A striking finding by the authors—for the deep dayside ionosphere flybys—is the observation of significant deviations between nP and ne toward lower altitudes sampled indicating increased negative ion charge densities; below ∼1100 km the ne/nP ratio decreases often rapidly from values close to 1 to values approaching 0.5 or less near 1000 km and below. A parallel study of CAPS/ELS measurements from 34 Titan flybys also shows the increase in anion number density with decreasing altitudes (Wellbrock et al. 2013). The aerosol growth model by Lavvas et al. (2013) captured this switch in negatively charged composition. In addition, Lavvas et al. (2013) predicted that positive ions increase in number density as a result of such a switch, as they react (and are lost) less efficiently in reactions with negative ions than in reactions with free electrons. The goal of the present work is to present observational support for this prediction.
In Section 2 we derive a steady-state equation relating ion–electron pair production rates to the number densities of electrons, positive ions and anions, and the effective rate coefficients for ion–anion and ion–electron reactions. In Section 3 we present the data set used in the study and in Section 4 we present and discuss the results. We highlight in particular that positive ion number densities are observed to increase well below the peak of ion–electron pair formation and argue that this cannot be due to changes in the effective electron recombination coefficient with decreasing altitude as this is expected to increase below the peak of ion–electron pair formation. Instead we explain the increasing positive ion number densities through a pronounced correlation with increasing volume-mixing ratios of anions.
2. IONOSPHERIC PARTICLE BALANCE
The continuity equation applied to the positive ion species i reads

where the second term on the left-hand side is the flux divergence with ui being the drift velocity, ni is the number density of i, Pi (cm−3 s−1) is the production rate of i and Li (s−1) is the chemical loss rate of i. We focus here only on altitudes below 1200 km and solar zenith angles below 60°. The time-dependent term of Equation (1) is negligible owing in particular to the long rotational period of Titan, corresponding to ∼16 Earth days (see further Vigren et al. 2013). Moreover transport effects are not expected important in the considered part of the ionosphere (Robertson et al. 2009; Cravens et al. 2010 and references therein). As a result, photochemical equilibrium can be assumed below 1200 km and the left-hand side of Equation (1) thus reduces to zero yielding

The production rate of the positive ion species i can be expressed as

where Pe is the total ion–electron pair formation rate (which we derive based on ionizations of the dominant neutral species N2 and CH4), gi is the fraction of these processes that produce the ion species i and IN(→i) is the production rate of i from ion–neutral reactions. Based on the works by, e.g., Lavvas et al. (2013) and Shebanits et al. (2013), we assume that the positive and negative ions are singly charged. There are three loss processes for i. In a reaction with a neutral the positive ion species i is lost but another positive ion species is formed. As i reacts with an anion j (with a rate coefficient of ki,j) or with a thermal electron (with a rate coefficient of αi) the products are exclusively neutrals. We may write
where IN(i→) is the loss rate (cm−3 s−1) of i from ion–neutral reactions and the sum is over all singly charged anion species j. Letting nN denote the total number density of anions we can write

where keff,i is the effective rate coefficient for reactions between i and anions. Combining Equations (2)–(5) gives

By summing over all positive ions i we get (since ion–neutral terms cancel out)

Letting nP denote the total number density of positive ions we get

where keff and αeff are the effective rate coefficients for ion–anion mutual neutralization and ion–electron dissociative recombination, respectively. Finally by introducing f as the ratio between negative and positive ion number densities (assuming charge neutrality and singly charged ions),

with the complementary

we can rewrite Equation (8) as
Equation (10) holds under photochemical equilibrium with charge neutrality and singly charged positive and negative ions. There are several relations equivalent to Equation (10) presented, e.g., in Larsen et al. (1972). It is a very useful equation for our purpose to illustrate how the positive ion number density correlates with the mixing ratio of negative ions with respect to positive ions (the f value) as keff is expected significantly smaller than αeff (see further Section 4). As a case study we focus on the near equator T40 flyby, which occurred on 2008 January 5. At the altitude of 1200 km during the ingress, at the closest approach of 1014 km, and at the altitude of 1200 km during the egress the solar zenith angles were ∼55°, ∼38°, and ∼22°, respectively (for further geometrical information, see Figure 2 of Vigren et al. 2013). The left-hand side of Equation (10) is calculated by using the Pe values from Vigren et al. (2013) and the nP values from RPWS/LP (Shebanits et al. 2013). The resulting Pe/nP2 profiles are then discussed in relation to the f values derived from Shebanits et al. (2013).
3. CASSINI DATA SET
The RPWS/LP measurements and the analysis to derive electron and total positive ion number densities are explained in Shebanits et al. (2013). The LP-derived ne and nP values are shown in Figure 1(a) versus altitude along the T40 Cassini trajectory. The random uncertainties in ne and nP due to instrumental noise are ∼10% (for further details, see Shebanits et al. 2013). Similar to Vigren et al. (2013) we derive ion–electron pair formation rates from the impinging solar spectrum and from the number densities of N2 and CH4 measured by INMS (Cui et al. 2012). We apply the Beer–Lambert Law to derive photoionization rates and generate photoelectron spectra at different locations along the Cassini trajectories, which are then used in an electron-energy degradation model (see Appendix of Vigren et al. 2013) to calculate electron-impact ionization rates. The derived total Pe for the T40 flyby is shown in Figure 1(b). The difference in magnitude and altitude of the Pe peaks for the inbound and the outbound parts reflect the solar zenith angle dependence. The contribution from electron-impact ionization to the total Pe ranges from ∼15%–20% near 1200 km to ∼30%–35% near the closest approach.

Figure 1. Shown against altitude along the T40 Cassini trajectory are (a) RPWS/LP derived electron number densities and positive ion number densities both associated with random errors of ∼10% (not shown) due to instrumental noise (from Shebanits et al. 2013) and (b) ion–electron pair production rates (from Vigren et al. 2013).
Download figure:
Standard image High-resolution image4. RESULTS AND DISCUSSION
The f values (= (nP – ne)/nP) are shown versus altitude for the T40 flyby in Figure 2(a) with error margins based only on the random uncertainties associated with the ne and nP measurements from Cassini RPWS/LP. A pronounced increasing trend in the mixing ratio of negative ions is seen to occur from ∼1100 km downward.
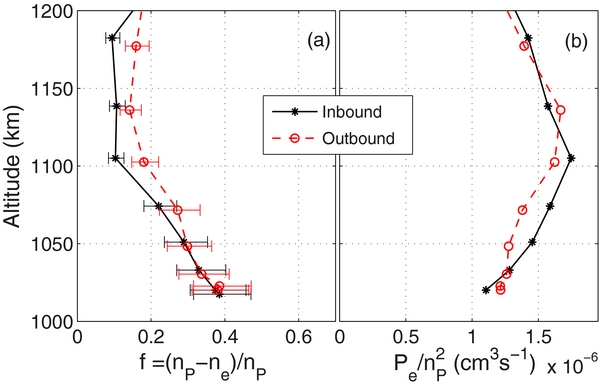
Figure 2. Shown against altitude along the T40 Cassini trajectory are (a) anion mixing ratios (f values) with random uncertainties and (b) Pe/nP2 ratios.
Download figure:
Standard image High-resolution imageThe profiles in altitude of the Pe/nP2 ratios—derived from the profiles in Figures 1(a) and (b)—are shown in Figure 2(b). The Pe/nP2 ratio exhibits a maximum near ∼1100 km. The maximum of Pe/nP2 occurs near the altitude at which the f values start increasing and the region above the peak is associated with small f values. The observed decrease of Pe/nP2 below ∼1100 km is therefore suggested to reflect the increasing mixing ratios of negative ions (i.e., increasing f values). This fits well with the expectation that keff is significantly smaller than αeff in Titan's deep ionosphere (e.g., Lavvas et al. 2013) implying that increasing f values leads to decreasing values of the right-hand side of Equation (10). An alternative explanation for decreasing Pe/nP2 below ∼1100 km would be decreasing αeff values, but this is improbable for two reasons. Firstly the rate coefficients for ion–electron recombination reactions increase with decreasing electron temperatures and for T40 the RPWS/LP derived electron temperature are somewhat lower near the closest approach than near 1100 km. Secondly, rate coefficients for ion–electron recombination reactions tend to increase with the complexity (number of atoms) of the molecular ion (Vigren et al. 2013) and the ion population is anticipated more chemically complex near the closest approach than near 1100 km (e.g., Cravens et al. 2006; Crary et al. 2009; Cui et al. 2009; Wahlund et al. 2009; Mandt et al. 2012).
Unfortunately there is a lack of experimental investigations into ion–anion reactions of direct relevance to Titan's deep ionosphere. The more recent experimental investigations into mutual neutralization reactions concern primarily systems with positive noble gas ions (e.g., Shuman et al. 2012; Miller et al. 2012). Though studies into more complex systems are needed to further confirm that keff ≪ αeff in Titan's deep ionosphere we note that the relation finds support already in existing experimental and theoretical results. Hickman (1979) derived an approximate scaling formula for ion–anion mutual neutralization reactions with the rate coefficient for the process being proportional to μ−0.5, T−0.5, and E.A−0.4 where μ is the reduced mass of the reactants, T is the temperature, and E.A is the electron affinity of the neutral X formed in the neutralization of X−. The model reasonably fitted the experimental data available at the time ranging to complex systems such as H3O+(H2O)3 + NO3− with a reduced mass of 33.5 amu and a measured 300 K rate coefficients of 5.5 × 10⁻⁸ cm3 s−1(Smith et al. 1978) corresponding to a 150 K rate coefficient of 7.8 × 10⁻⁸ cm3 s−1 assuming a T−0.5 dependence (the neutral temperature in the deep ionosphere of Titan is typically ∼150–180 K). Ion–anion reactions in Titan's deep ionosphere are likely associated with even lower rate coefficients as the reduced mass in the reactions on average are anticipated to be high (μ > 50 amu; see Crary et al. 2009, Wahlund et al. 2009, and Wellbrock et al. 2013 regarding masses of positive and negative ions in Titan's deep ionosphere). For comparison αeff is expected to exceed 5 × 10⁻⁷ cm3 s−1 at 1100 km in Titan's ionosphere and increase toward lower altitudes (Vigren et al. 2013).
The ion–ion interactions in Titan's ionosphere are, however, probably not best described as processes in the gas phase, but rather as heterogeneous interactions involving positive ion attachment to negatively charged grains (see further Lavvas et al. 2013). Assuming for simplicity conductive and spherical grains the rate coefficients of such processes can be estimated from the formalism of Draine & Sutin (1987). In brief, the rate coefficients tend to decrease with increased mass of the positive ion (the projectile ion), and to increase with increased size of the negatively charged grain (the target ion). The average mass of the negative ions observed by the CAPS/ELS near the closest approach of the T40 flyby (∼1015 km) was ∼500 amu, assuming singly charged ions (see Lavvas et al. 2013). This gives an average grain radius of ∼0.5–0.7 nm assuming the grain density to being the range ∼0.5–1.5 g cm−3 (similar as Titan aerosol analogs; see Hörst & Tolbert 2013 and references therein). Combined with a temperature of 150 K and a typical positive ion mass of 50 amu (low estimate near 1015 km in Titan's ionosphere) gives, when using the Draine & Sutin (1987) formalism, an estimated "average" ion–ion neutralization rate coefficient of ∼1.0–1.3 × 10⁻⁷ cm3 s−1. Though this is a crude estimate based on simplistic assumptions and the consideration of a single grain size rather than a size distribution, it is worthwhile to notice that the derived value is significantly lower (a factor of ∼4–5) than our low estimate of αeff below 1100 km. As such this adds some further support to our interpretation that keff < αeff.
Although we are able to explain the shape of the Pe/nP2 profile in light of the RPWS/LP-derived mixing ratios of negative ions we still face the problem of understanding the magnitude of the plasma densities in Titan's dayside ionosphere. The Pe/nP2 ratios seen in the altitude range 1100–1200 km (where anion number densities are low) are about a factor of 3–4 higher than αeff estimates derived from ion density measurements, laboratory derived rate coefficients and measured electron temperatures (see Vigren et al. 2013).
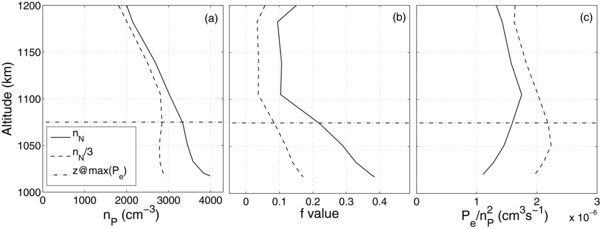
A detailed comparison between the RPWS/LP and CAPS/ELS derived negative ion densities in Titan's ionosphere is the subject of a separate study, but it is appointed that for the T40 flyby the negative ion number densities inferred from the CAPS/ELS measurements are roughly a factor of three lower than those inferred from RPWS/LP in the range 1020–1200 km (note that the CAPS/ELS derived anion number density uncertainty is approximately 50% due to uncertainties on the microchannel plate efficiency for negative ions; Wellbrock et al. 2013; A. Wellbrock 2013, private communication). It is relevant to address how the key results presented in this study are affected by the consideration of this discrepancy. In Figure 3 we show by dashed lines how the results for the ingress of T40 are affected by keeping the electron number densities fixed according to the RPWS/LP measurements but setting nP according to nP = ne + nN/3 where nN is the anion number density inferred from RPWS/LP (and where the division of nN by 3 accounts roughly for the CAPS/ELS measurements of anion number densities). Figure 3(a) shows that the "modified" positive ion number density remains roughly constant below the peak of electron–ion pair formation, and notably with nP at closest approach not being lower than at the peak of electron–ion pair formation. Figure 3(b) illustrates how the f value is changed. Figure 3(c) shows that a clear peak of Pe/nP2 still prevails in the case of nN/3, but with its altitude shifted downward. Conclusively the key points of the study, namely that the electron attachment to neutrals yields enhanced positive ion number densities, and that the number density of positive ions does not decrease—and even can increase—below the peak of ion–electron pair production, remains "observationally supported" even in the extreme case of reducing by a factor of three the negative ion number densities derived by the RPWS/LP.
Figure 3. Shown against altitude along the ingress of the T40 flyby are (a) nP, (b) f value, and (c) Pe/nP2 ratios. The solid lines are identical to results presented in Figures 1(a) and 2 and show results based on nP and ne measurements by the RPWS/LP. The dashed lines show results based on RPWS/LP derived ne but with nP set according to nP = ne+nN/3, where nN is the negative ion number density inferred from RPWS/LP and where the division of nN by a factor of three accounts roughly for the CAPS/ELS measurements of negative ion number densities (see text). The dashed-dotted line in each figure marks the altitude where the ion–electron pair production rate peaks based on Vigren et al. (2013).
Download figure:
Standard image High-resolution image
5. CONCLUSIONS
Based on their aerosol growth model Lavvas et al. (2013) predicted that electron attachment to heavy neutrals in Titan's ionosphere yields an increase in the positive ion number densities as the positive ions react much slower with heavy anions than with free electrons. Here we have verified this prediction by combining ion–electron pair formation rates derived from Cassini observations with RPWS/LP observations of electron and positive ion number densities. We have shown that the effect can be so pronounced that the positive ion number density displays an increasing trend well below the peak of ion–electron pair formation (see Figures 1(a) and (b)).
In the D-region of Earth's ionosphere negative ions are formed predominantly by third-body assisted electron attachment to O2, with the O2− ion initiating a chain of reactions involving minor neutrals that leads to other anions (e.g., Thomas & Bowman 1985 and references therein). The "replacement" of free electrons by negative ions has been shown to decrease the overall de-ionization (or neutralization) rate in that environment (see, e.g., Larsen et al. 1972; Smith et al. 1976). The work by Lavvas et al. (2013) and the present study address a similar scenario in Titan's main ionosphere where, however, in contrast to Earth's D-region, three-body processes are unimportant. Instead, electron attachment to macromolecules is a key process for the ionospheric particle balance at Titan that does not only affect significantly the electron number densities but also the positive ion number densities. The described chemical scenario may be of importance for several other ionospheres in the solar system (including perhaps the inner comae of active and dusty comets). It can for example be speculated that the low ne/nP ratio—below 0.1—observed by the RPWS/LP in the H2O dominated plume of the Saturnian satellite Enceladus (Morooka et al. 2011) is a result not only directly of the electron attachment to nanograins (Coates et al. 2010; Hill et al. 2012), which reduces ne, but also indirectly due to this process as the positive ions become longer-lived, which increases nP.
E.V. is grateful for funding from the Swedish Research Council (contract No. 2011-894). M. G. is partially funded by the Science and Technology Facilities Council (STFC) through the consolidated grant to Imperial College, London. O.S. and J.-E.W. are supported by the Swedish National Space Board (SNSB). R.V.Y. acknowledges support of NASA grant NNX09AB58G. This work was performed in the framework of the Marie Curie International Research Staff Exchange Scheme PIRSES-GA-2009-247509.