


ABSTRACT
Spectroscopic observations of Hα and Hβ emission lines of 128 star-forming galaxies in the redshift range 0.75 ⩽ z ⩽ 1.5 are presented. These data were taken with slitless spectroscopy using the G102 and G141 grisms of the Wide-Field-Camera 3 (WFC3) on board the Hubble Space Telescope as part of the WFC3 Infrared Spectroscopic Parallel survey. Interstellar dust extinction is measured from stacked spectra that cover the Balmer decrement (Hα/Hβ). We present dust extinction as a function of Hα luminosity (down to 3 × 1041 erg s−1), galaxy stellar mass (reaching 4 × 10⁸ M☉), and rest-frame Hα equivalent width. The faintest galaxies are two times fainter in Hα luminosity than galaxies previously studied at z ∼ 1.5. An evolution is observed where galaxies of the same Hα luminosity have lower extinction at higher redshifts, whereas no evolution is found within our error bars with stellar mass. The lower Hα luminosity galaxies in our sample are found to be consistent with no dust extinction. We find an anti-correlation of the [O iii] λ5007/Hα flux ratio as a function of luminosity where galaxies with LHα < 5 × 1041 erg s−1 are brighter in [O iii] λ5007 than Hα. This trend is evident even after extinction correction, suggesting that the increased [O iii] λ5007/Hα ratio in low-luminosity galaxies is likely due to lower metallicity and/or higher ionization parameters.
Export citation and abstract BibTeX RIS
1. INTRODUCTION
Star-forming galaxies are characterized by emission lines from gas heated by young stars in H ii regions. The luminosity of these nebular emission lines such as Hα or [O iii] provides reliable information concerning galaxy star formation rates (SFRs) and gas-phase metallicities. Yet the dust present in the interstellar medium strongly attenuates rest-frame ultraviolet and optical fluxes in a wavelength-dependent manner. Therefore, inferring physical properties (e.g., SFRs) from emission-line luminosities requires accurate dust corrections.
In practice, the most reliable technique to estimate interstellar extinction is to measure the flux ratio of two nebular Balmer emission lines such as  (i.e., the Balmer decrement). Since the value of the Balmer decrement is set by quantum physics, any deviation from this expected value may be attributed to dust extinction (for a fixed electron temperature). Other emission-line ratios such as Hβ/Hδ are useful as well, but are generally more difficult to measure because the higher order lines are weaker and more affected by stellar absorption.
The determination of dust extinction from the Balmer decrement has been shown to be a very successful technique in the local universe since the first statistical work by Kennicutt (1992). These results have been improved upon by the large amount of optical spectra provided by the Sloan Digital Sky Survey (SDSS), which were analyzed in this context by Brinchmann et al. (2004), Moustakas et al. (2006), and Garn & Best (2010). However, the simultaneous detection of Hα and Hβ in higher redshift galaxies, which are shifted to the near-infrared (IR), is a difficult task with current instrumentation on ground-based telescopes. Indeed, Balmer decrements in high-redshift galaxies have been spectroscopically measured only in a few individual cases (e.g., Teplitz et al. 2000; Hainline et al. 2009).
Other recent, although less robust, estimates of the Balmer decrement are available at z ∼ 0.5 for larger galaxy samples based on a combination of spectroscopy and photometry (Ly et al. 2012). There are other dust-extinction estimates at z ∼ 1.47 from narrowband photometry of the Hα and [O ii] emission lines (Sobral et al. 2012), but these measurements are affected by the unknown metallicities of the galaxies. At high redshifts (z > 2) the ultraviolet (UV) slope is typically used to determine dust extinction (e.g., Stanway et al. 2005; Hathi et al. 2008; Reddy et al. 2010; Wilkins et al. 2011; Finkelstein et al. 2012; Bouwens et al. 2012; Hathi et al. 2012), where access to the Balmer lines is difficult. The relationship between UV slope and dust reddening depends on both the dust properties and distribution of the dust with respect to the stars. While the local correlation between UV slope and dust attenuation appears to hold for typical star-forming galaxies up to z ∼ 2 (e.g., Reddy et al. 2010, 2012), the Balmer decrement offers a complementary method of deducing dust attenuation, and can illuminate any differences in the nebular versus stellar extinction in galaxies (Calzetti et al. 1994, 2000).
Previous works on dust extinction have focused on a relatively narrow dynamical range of Hα luminosity (e.g., Sobral et al. 2012). Furthermore, these works have been generally sensitive to the brightest star-forming galaxies, which tend to have larger reddening than fainter galaxies. As a result, the common procedure to correct for dust extinction in high-redshift galaxies is to assume an extinction of one magnitude at the wavelength of Hα for all galaxy luminosities. This assumption is based on the mean extinction of local galaxies (Kennicutt 1992). However, this local average has a significant scatter, which may potentially affect results derived from the dust correction. An additional issue is that dust extinction as a function of bolometric luminosity is observed to evolve with redshift such that galaxies of the same luminosity are more extinguished at lower redshift, due mainly to the metal enrichment of the interstellar medium (e.g., Reddy et al. 2006, 2010; Buat et al. 2007, 2011; Burgarella et al. 2007; Bouwens et al. 2009, 2012).
The Wide-Field-Camera 3 (WFC3) of the Hubble Space Telescope (HST) has now made it possible to carry out a statistically significant analysis of the Balmer decrement in high-redshift galaxies. The grism spectroscopy mode of the WFC3 instrument offers several advantages over ground-based spectroscopy. First, grism spectroscopy is slitless, so there are no concerns of variable slit losses at Hα and Hβ due to varying seeing, alignment errors, and atmospheric refraction. Second, the WFC3 grisms provide a continuous wavelength coverage over 0.85 ⩽ λ ⩽ 1.65 μm, which is unaffected by hydroxyl (OH) airglow emission and the high opacity of the atmosphere at certain wavelengths (i.e., line measurements are obtained regardless of whether they lie within atmospheric windows or between sky lines). Third, the flux calibration with WFC3 is more accurate than ground-based instruments, as it is unaffected by variable telluric absorption from Earth's atmosphere. Lastly, the WFC3 grisms obtain unbiased samples, whereas ground-based spectroscopy typically requires a preselection in order to assign slits. Furthermore, longslit followup at higher redshifts has mostly focused on brighter galaxies.
In this paper, interstellar dust-extinction of star-forming galaxies is statistically investigated in the redshift range 0.75 ⩽ z ⩽ 1.5 over two orders of magnitude in Hα luminosities. Balmer decrements are measured using spectroscopy and analyzed down to an Hα flux limit of approximately 5 × 10⁻¹⁷ erg s−1 cm−2. These are galaxies a factor of approximately two fainter than galaxies previously studied at z ∼ 1.5 (Sobral et al. 2012).
The paper is organized as follows. In Section 2, we present our galaxy sample and the emission-line extraction technique. Section 3 explains the necessary framework of dust extinction used in this analysis. The results are shown in Section 4. Section 5 provides a discussion of our results, their robustness, and a comparison with previous works. Finally, we summarize the main findings from our analysis in Section 6.
Throughout this paper, a standard cold dark matter cosmology is assumed, with matter density Ωm = 0.3, vacuum energy density ΩΛ = 0.7, and Hubble constant H0 = 70 km s−1 Mpc−1.
2. GALAXY DATA SET
2.1. Observations and Data Reduction
The data set used in this work is part of the WFC3 Infrared Spectroscopic Parallel (WISP) survey. The WISP survey offers an opportunity to study the spectral properties of galaxies in a way that is unbiased by target selection. It also has unprecedented sensitivity to galaxies on the faint-end slope of the galaxy luminosity function at redshifts where the peak of the star formation in the universe occurs (e.g., Reddy et al. 2008).
A detailed description of the WISP program including technical details can be found in Atek et al. (2010, 2011). Briefly, the WISP program is obtaining slitless and low-resolution near-IR grism spectroscopy of more than 200 independent and high-latitude fields by observing in the pure parallel mode of the HST.9 The data are taken with the infrared channel of the WFC3 in a total of ∼730 orbits using two grisms: G102 (0.80 ⩽ λ ⩽ 1.17 μm, R ∼ 210) and G141 (1.11 ⩽ λ ⩽ 1.67 μm, R ∼ 130).
The WISP data also include direct-imaging photometry with WFC3/IR and UVIS channels in the F475X, F600LP, F110W, and F160W filters. IRAC 3.6 μm photometry from the Spitzer Space Telescope is available for a subset (∼47%) of the initial galaxy sample described in Section 2.2.
The optical and near-IR photometry is obtained in matched isophotal apertures defined by the F110W imaging. The galaxies are first detected with SExtractor (Bertin & Arnouts 1996) in the F110W band, computing the position in the sky and the aperture parameters (i.e., semi-major axis and positional angle of the ellipse). These parameters are used for our own routine to extract the fluxes as follows. All four HST bands are extracted in the same elliptical apertures defined in the F110W images. The local background for each aperture is calculated within a square annulus using a mean with 3σ clipping to determine the representative background per pixel. Then, the total background-subtracted flux is computed within the aperture by adding all the aperture pixels. The flux uncertainties are computed using Monte Carlo simulations. First, for each aperture pixel we randomly vary the flux according to a normal distribution with a width provided by an error map. Second, we repeat this process 1000 times, extracting the randomized flux in each realization. Finally, from the simulated flux distribution, the 1σ uncertainty is calculated as the width of a Gaussian fit. Further details on the photometric analysis will be found in A. G. Bedregal et al. (in preparation).
The Spitzer IRAC 3.6 μm photometry is extracted in fixed apertures of 2.8 arcsec in radius. Then, this photometry is corrected to total fluxes assuming that the galaxies are point sources.10 This is a fair assumption as the Spitzer point-spread function is significantly larger than the typical WISP aperture defined in F110W. The relatively small IRAC aperture was chosen in order to minimize any strong contamination from brighter neighbors.
The direct imaging is corrected for Galactic dust extinction given the color excess from Schlegel et al. (1998) and assuming the extinction curve of Cardelli et al. (1989).
2.2. Galaxy Sample
Our initial sample contains 312 star-forming galaxies in 17 different fields in the redshift range 0.75 ⩽ z ⩽ 1.5, where both Hα and Hβ fall simultaneously in the WISP spectral coverage. In the overall spectrum, our line finder flags potential emission lines as significant peaks above the continuum. The emission lines are identified and validated by eye by two astronomers, and then the redshift is assigned based on the centroid of the most significant line, which is usually Hα (J. W. Colbert et al., in preparation). We include in the final sample only galaxies with no external contamination (i.e., galaxies with no overlapping spectra). This condition removes 49% of the galaxies in our initial sample. This method assures that we accurately measure both continuum and emission-line fluxes that are not affected by contamination. We also make sure that only galaxies with secure redshifts are included in the final sample (that is galaxies where it is clear that the selected emission line in the spectrum is Hα and not [O iii]). This contamination is avoided by looking at other emission lines at their expected wavelength. This extra condition removes another 5% of galaxies in our initial sample. Our final sample contains 128 galaxies (with 60% of these galaxies detected by IRAC 3.6 μm).
The WISP 5σ line sensitivity (Atek et al. 2010) recast in luminosity is shown in Figure 1 as a function of redshift. This sensitivity corresponds to a line covering an area of 15 pixels on the detector. The integration time shown in Figure 1 is 6400 s for the G102 grism and 2700 s for the G141 grism. These exposure times are typical for the observations used in this study. The red-solid line is the line sensitivity for Hα, which for our redshift range is always detected in the G141 grism. However, Hβ is observed either by the G102 grism (for lower redshift galaxies) or by the G141 grism (for higher redshift galaxies). These Hβ-line sensitivities are shown in Figure 1 with a blue-dashed line for the G102 grism and with a red-dashed line for the G141 grism. The Hβ line appears in both grisms at z ∼ 1.3. At this redshift, and given the typical relative exposure times in each grism, the G141 is approximately a factor of 2.5 less sensitive than G102 in detecting Hβ.

Figure 1. 5σ line sensitivity shown in Atek et al. (2010) is recast here as Hβ luminosity (dashed lines) and Hα luminosity (solid line) as a function of redshift. This sensitivity corresponds to a line covering an area of 15 pixels. The blue-dashed line corresponds to the Hβ line when it is detected by the G102 grism and the red-dashed line when Hβ is detected by the G141 grism. The integration time is 6400 s for the G102 grism and 2700 s for the G141 grism. These exposure times are typical for the observations used in this study. The discontinuity in the Hβ luminosity reflects the fact that Hβ falls either in the G102 grism or in the G141 grism depending of the galaxy redshift. See Section 2.2 for details.
Download figure:
Standard image High-resolution image2.3. Emission-line Extraction
A non-parametric method is developed to subtract the continuum independently from each grism. Because we know the exact wavelength of the emission line (from the automatic line detection code), we interpolate over the lines (5 pixels on either side). Then, a median filter is run with a 40 pixel window over the spectrum. This is the model of the continuum. These model continua are subtracted from the spectra.
Each spectrum is later divided into different regions in order to extract the emission-line parameters such as fluxes and equivalent widths (EWs): a bluer part containing Hβ and the [O iii] doublet, and a redder part containing Hα and the [S ii] doublet. In the bluer region, a function consisting of three Gaussians (one for every line in the region) plus a straight line (modeling the small residual continuum) is fit using a χ2 minimization. In the redder region, since our resolution is not high enough to resolve the two [S ii] emission lines, only two Gaussians (one for Hα and another one for the [S ii] doublet) plus a straight line are fit. The [N ii] doublet cannot be resolved from Hα at our resolution. The [N ii] contribution to the Hα fluxes will be discussed in Section 2.6. We impose multiple constraints to the line fitting. Specifically, the FWHM of the Gaussians is constrained to a maximum expected size of 10 pixels (∼1.3 arcsec). The wavelength solution has an uncertainty of ±30 Å. Therefore, in the fitting procedure the centers of the emission lines are allowed to vary within that wavelength range. The ratio between the fluxes of the two [O iii] lines is set to 3.2 (Osterbrock 1989). We note that in order to avoid obtaining local minima in our fits, we use a grid of initial conditions to find the global minimum.
Finally, Balmer decrements are computed as the ratio of the Hα and Hβ line fluxes. The uncertainties in the Balmer decrements are then calculated by propagating the uncertainties of each of the individual line fluxes, which are obtained from the χ2 fits.
2.4. Stacking of the Galaxy Spectra
The individual measurements are not always good enough to detect the Balmer decrements. The Hα emission line is detected in all galaxies by construction, while Hβ is detected at more than 3σ in 26 galaxies (this is 20% of the final sample). Therefore, to improve the statistics, we next stack all the continuum-subtracted spectra. To stack these galaxy spectra, we first shift each spectrum to the rest-frame, interpolating the values to a finer, common wavelength grid. Different stacked spectra are built selecting the galaxies according to their Hα luminosity, stellar mass, and Hα EW (see Figure 2).

Figure 2. Composite spectra in the redshift range 0.75 ⩽ z ⩽ 1.5. The top panels show the stacked spectra for three bins in Hα luminosity; the middle panels show the stacked spectra for three bins in stellar mass; and the bottom panels show the stacked spectra for three bins of rest-frame Hα EW. The number of stacked galaxies is 43, 43, and 42 in the low, middle, and high tertiles (left, center, and right columns). The emission lines that are fit in these stacked spectra are Hβ, the [O iii] doublet, Hα, and the [S ii] doublet. The wavelengths of these emission lines are marked with dashed lines.
Download figure:
Standard image High-resolution imageThe number of data points in the re-sampled spectra needs to be considered in order to correctly estimate the uncertainties in the subsequent fits. Therefore, when fitting the emission lines, the interpolated uncertainties must be corrected by a factor  , with R representing the ratio of the length of the bin in the original spectrum and the length of the bin in the interpolated spectrum. Later, every galaxy is normalized by its Hα flux. This step is done to avoid having the stacks be dominated by the few brightest galaxies. The emission lines are closer to the edges of the stacked spectra. Thus, different lengths are fit to the left and to the right of the emission lines (300 and 600 Å) in order to account correctly for the small residual continuum. An example of the stacked emission-line fits is shown in Figure 3. Emission-line fluxes are then extracted from these composite spectra (following the emission-line extraction procedure described in Section 2.3), which will represent statistical properties of the galaxies in every Hα luminosity, stellar mass, and Hα EW bin. All the uncertainties are given by the python version of the mpfit fitting code (Markwardt 2009) but we checked that those uncertainty values are compatible with uncertainties derived from a Monte Carlo simulation.

Figure 3. Example of the fits to the stacked spectra. The emission-line fits are plotted with red lines. The wavelengths of the emission lines are marked with dashed lines and the observed LHα bin is annotated in a box.
Download figure:
Standard image High-resolution imageThere is the concern that the Balmer decrement determined from stacked spectra may not give the average extinction in that luminosity bin. The stacked result is dependent upon the intrinsic distribution of individual Balmer decrements, whether it is flat, Gaussian or, more likely, Gaussian with a tail to higher extinction. To test this potential bias, we ran a Monte Carlo simulation to make stacks from individual SDSS galaxies culled from the larger Balmer decrement distribution (in a given luminosity bin). We then measured the Balmer decrement in the stack and used the inferred extinction to determine the total intrinsic Hα luminosity density from all of the galaxies used in the stack. The total Hα flux was compared to the total flux when summing the Hα fluxes corrected for extinction based on individual Balmer decrement measurements for each galaxy. The results indicate that these two methods agree within ±20%, despite the fact that the distribution of Balmer decrements changes significantly from low to high LHα in SDSS. These uncertainties are within the uncertainties of the Balmer decrement analyzed in the present work, so we do not consider them a significant bias.
2.5. Galaxy Stellar Mass from Population Synthesis Models
Galaxy stellar mass is the most robust physical parameter derived from spectral-energy-distribution (SED) fitting. This technique has been widely used in the literature (e.g., Sawicki & Yee 1998; Papovich et al. 2001; Shapley et al. 2001; Bundy et al. 2006; Barro et al. 2011). In this section, we calculate stellar masses for all galaxies in our sample fitting multiwavelength photometry (F475X, F600LP, F110W, F160W, and IRAC 3.6 μm; see Section 2) to a grid of Bruzual & Charlot (2003) stellar population synthesis models assuming a Chabrier (2003) initial mass function. The FAST code (Kriek et al. 2009) is used to derive these stellar masses. The stellar optical extinction AstellarV is set to the range 0–4 mag in steps of 0.1 mag. The metallicity by mass fraction is fixed to 0.008 (solar metallicity is 0.02 in these units). This choice is supported by the young star-forming nature of our galaxies, which is described in Section 2.6.3. Our stellar masses and absorption lines corrections (see Section 2.6.1) do not change significantly if a wider range of metallicities is allowed. The age of the galaxies is constrained in the range between 107–1010 yr and the star formation history is modeled as an exponentially declining tau model exp (− t/τ) with log10(τ/yr) = 7–10 in steps of 0.1. The contribution of the emission lines to the broadband fluxes is removed before the SED fitting (as we suggested in Atek et al. 2011). The Hα luminosity (uncorrected for dust absorption) versus stellar mass for galaxies in our sample is shown in Figure 4, where more luminous Hα emission is seen in more massive galaxies. Figure 4 is related to the star formation main sequence (e.g., Noeske et al. 2007; A. Domínguez et al., in preparation).

Figure 4. Observed Hα luminosity vs. stellar mass of our galaxy sample.
Download figure:
Standard image High-resolution image2.6. Contamination of Balmer Line Measurements
Our measurement of the Balmer emission-line fluxes may be significantly affected by strong stellar absorption lines, unresolved emission lines near the Balmer lines, and contributions from active galactic nuclei (AGNs). Below we estimate the magnitude of each of these effects.
2.6.1. Stellar Absorption Lines
Absorption lines from stars in the galaxy may affect the emission-line measurements. We estimate the Hα and Hβ absorption lines from the best stellar population model from the SED fitting described above (Section 2.5). The Hα and Hβ EW distributions are shown in Figure 5 for the three galaxy mass bins that were shown in the middle panel of Figure 2. From the lowest to the highest mass bin, the median and standard deviation of the Hα EWs in absorption distributions are (2.42 ± 0.51) Å, (2.72 ± 0.52) Å, (3.05 ± 0.67) Å. The corresponding values of Hβ EWs in absorption are (3.22 ± 0.82) Å, (3.60 ± 0.87) Å, (4.09 ± 1.15) Å. We compute the median of the distribution of the individual Hα and Hβ EWs in emission that contribute to each stack. Then, the ratios between these medians and the EWs in absorption corrections are estimated. Since the fluxes are proportionally related with the EWs, we use these ratios to convert to flux corrections independently both for Hα and Hβ. The uncertainties in the absorption corrections are propagated throughout our analysis.

Figure 5. Hα and Hβ absorption-line distributions of the galaxies in our sample estimated in three bins of stellar mass as described in the text.
Download figure:
Standard image High-resolution image2.6.2. The [N ii] Contribution to Hα
The resolution of the WISP spectra is not high enough to resolve the [N ii] λ6548, 6583 doublet from the Hα line. This may bias our estimate of the Hα flux toward higher values, which may lead to systematically high Balmer decrements. Of particular concern is that the [N ii] contribution to Hα is expected to increase with stellar mass (e.g., Erb et al. 2006). Furthermore, the Hα/[N ii] ratio at a given mass evolves with redshift (Erb et al. 2006; Sobral et al. 2012).
In order to correct for this effect, we use the average of the expected Hα/[N ii] observed locally (Sobral et al. 2012) and at z ∼ 2 (Erb et al. 2006). First, we estimate the [N ii] to Hα contribution at z ∼ 2–3 by interpolating between the Hα/[N ii] ratios for different stellar masses provided in Table 2 of Erb et al. (2006). These fluxes were derived for star-forming galaxies with similar physical properties as our galaxies. Erb et al. (2006) found that the [N ii] contribution relative to Hα increases with stellar masses. For each of our stacks, the geometric mean of the stellar masses of the stacked galaxies is calculated. Then, from the previous interpolation a correction for our observed Hα fluxes is derived. The Erb et al. (2006) ratios consider only the [N ii] λ6583 line. We add an extra correction to also account for the fainter (by a factor of three) [N ii] λ6548 line. The second step is to estimate the higher [N ii] to Hα contribution from the relation provided by Sobral et al. (2012) calibrated with local star-forming galaxies. This relation estimates Hα/[N ii] as a function of Hα EW. We proceed with estimating the geometric mean of Hα EW in our stacked spectra and apply the local correction. Finally, the total correction that we apply for the [N ii] contamination of Hα is calculated as the average of these two corrections, that is from the Erb et al. (2006; approximately 0%, 8%, and 19% for each stellar mass bin from the least to the most massive bin) and Sobral et al. (2012; 9%, 17%, and 20%). For instance, for the stacks binned in stellar masses these corrections are 4%, 12%, and 19% from the least to the most massive bin, respectively. The combined [N ii] correction has little effect on the ultimate trends of the Balmer decrement with Hα luminosity (see Section 4). Furthermore, the uncertainty in the [N ii] correction is significantly lower than the uncertainties in our Balmer decrements.
2.6.3. Active Galactic Nuclei Contamination
We investigate whether a significant contribution from AGNs may bias our Balmer decrement calculations. Figure 6 shows [O iii]/Hβ versus [S ii]/Hα for our stacked spectra. This figure is the Baldwin, Phillips, & Terlevich (BPT) diagram (Baldwin et al. 1981). The black line separates the star-forming and AGN region as modeled by Kewley et al. (2001). We see in Figure 6 that our stacks are compatible with the low-metallicity tail of the star-forming region rather than the AGN region from data in the local universe from the SDSS DR811 (Eisenstein et al. 2011). Figure 6 also shows for comparison the data from two lensed star-forming galaxies located at z ∼ 2 (Hainline et al. 2009). In support of these results, the analysis by Sobral et al. (2012) shows around 8% of the AGN contamination in Hα -selected samples and higher in more luminous galaxies. Since the galaxies presented in the present work are typically fainter, the AGN contamination is probably even smaller. These results indicate that the AGN contamination will not significantly affect the results of our analysis. The emission-line ratios shown in Figure 6 are listed in Table 1.

Figure 6. BPT diagram that distinguishes between star-forming galaxies and galaxies with AGNs. The black line separates the star-forming and AGN regions (Kewley et al. 2001). Our nine stacks are shown with crosses. The cross size is correlated with the bin of Hα luminosity, stellar mass, and Hα equivalent width (the larger the marker the larger the binning quantity). For comparison, two confirmed lensed star-forming galaxies detected at z ∼ 2 by Hainline et al. (2009) are shown with a cyan square and a magenta circle. The contours are from SDSS data.
Download figure:
Standard image High-resolution imageTable 1. Emission-line Ratios of Stacked Spectra in 0.75 ⩽ z ⩽ 1.5
| 〈log10X〉 | ([S ii] λ6717 + λ6732)/Hα λ6563 | [O iii] λ5007/Hβ λ4861 |
|---|---|---|
| Stacks binned in Hα luminosity, X = LHα/erg s−1 | ||
| 41.57+0.48−0.23 | 0.14 ± 0.04 | 4.65 ± 1.10 |
| 41.91+0.11−0.13 | 0.14 ± 0.03 | 2.55 ± 0.66 |
| 42.33+0.29−1.05 | 0.23 ± 0.02 | 3.37 ± 1.18 |
| Stacks binned in galaxy stellar mass, X = M*/M☉ | ||
| 8.56+1.38−0.58 | 0.08 ± 0.03 | 5.58 ± 1.32 |
| 9.51+0.35−0.34 | 0.28 ± 0.03 | 1.95 ± 0.44 |
| 10.46+0.61−1.40 | 0.21 ± 0.03 | 2.15 ± 0.92 |
Stacks binned in Hα equivalent width,  | ||
| 1.73+0.51−0.22 | 0.24 ± 0.03 | 2.58 ± 0.84 |
| 2.07+0.11−0.11 | 0.26 ± 0.03 | 2.91 ± 0.69 |
| 2.47+0.28−0.86 | 0.04 ± 0.03 | 5.89 ± 1.63 |
Note. These are the values for plotting the BPT diagram shown in Figure 6.
Download table as: ASCIITypeset image
3. THEORETICAL BACKGROUND
The theoretical framework utilized in the subsequent sections is described here. Following the empirical extinction relation found in Calzetti et al. (1994;12 all quantities in what follows correspond to nebular emission lines, not continuum) the intrinsic luminosities, Lint, are given by


where Lobs are the observed (extinguished) luminosities, Aλ is the extinction at the wavelength λ, and k(λ) is the reddening curve. In what follows, we will use the reddening curve k(λ) found in Calzetti et al. (2000) for our analysis. The color excess E(B − V) is defined by

which is the change in the (B − V) color due to dust attenuation (that is, the difference between observed and expected color in the absence of dust). The nebular color excess is related to the stellar color excess as discussed in, e.g., Calzetti et al. (2000, hereafter C00).
We are ultimately interested in deriving dust extinctions from Balmer decrements. The relationship between the nebular emission-line color excess and the Balmer decrement is given by (see, e.g., the Appendix in Momcheva et al. 2012 for details)


where k(λHβ) and k(λHα) are the reddening curves evaluated at Hβ and Hα wavelengths, respectively. The factor E(Hβ − Hα) is analogous to the color excess, but defined for Hβ and Hα instead of the B and V bands. Then, (Hα/Hβ)obs is the observed Balmer decrement and (Hα/Hβ)int is the intrinsic or unreddened Balmer decrement, which is calculated theoretically. The intrinsic Balmer decrement remains roughly constant for typical gas conditions in star-forming galaxies (see Osterbrock 1989). In our analysis, we assume the value of (Hα/Hβ)int = 2.86, corresponding to a temperature T = 104 K and an electron density ne = 102 cm−3 for Case B recombination (Osterbrock 1989). This choice is standard for star-forming galaxies in the literature. Thus, the nebular color excess is given by the following equation:

Coming back to Equation (1), Aλ is the extinction in magnitudes at the wavelength λ,

In particular, selecting the C00 reddening curve, Equation (5) turns into


which are the Hα extinction and the optical extinction, respectively. The parameters E(B − V), AHα, and AV will be given in Table 2 for our stacked spectra. Any potential effect coming from galaxy inclinations should be alleviated from our stacking methodology since we are averaging a statistical sample of galaxies with independent inclinations.
Table 2. Dust Properties for WISP Galaxies
| Na | 〈log10(X)〉 | Hα/Hβb | Hα/Hβc | Hα/Hβd | E(B − V)e | AHαe | AVe |
|---|---|---|---|---|---|---|---|
| (mag) | (mag) | (mag) | |||||
| Galaxy spectra stacked in Hα luminosity, X ≡ LHα/erg s−1 | |||||||
| 43 | 41.57+0.23−0.48 | 3.99 ± 0.95 | 3.51 ± 0.85 | 3.29 ± 0.82 | 0.12 ± 0.21 | 0.40 ± 0.71 | 0.48 ± 0.86 |
| 43 | 41.91+0.13−0.11 | 4.14 ± 1.03 | 3.59 ± 0.91 | 3.08 ± 0.79 | 0.06 ± 0.22 | 0.21 ± 0.73 | 0.25 ± 0.89 |
| 42 | 42.33+1.05−0.29 | 8.84 ± 2.66 | 5.84 ± 1.86 | 5.01 ± 1.60 | 0.48 ± 0.27 | 1.59 ± 0.98 | 1.94 ± 1.17 |
| Galaxy spectra stacked in stellar mass, X ≡ M*/M☉ | |||||||
| 43 | 8.56+0.58−1.38 | 3.92 ± 0.93 | 3.66 ± 0.87 | 3.49 ± 0.85 | 0.17 ± 0.21 | 0.57 ± 0.71 | 0.69 ± 0.85 |
| 43 | 9.51+0.34−0.35 | 5.16 ± 1.10 | 3.99 ± 0.88 | 3.50 ± 0.78 | 0.17 ± 0.19 | 0.57 ± 0.65 | 0.70 ± 0.78 |
| 42 | 10.46+1.40−0.61 | 6.80 ± 2.79 | 5.52 ± 2.29 | 4.46 ± 1.86 | 0.38 ± 0.36 | 1.26 ± 1.22 | 1.54 ± 1.47 |
Galaxy spectra stacked in rest-frame Hα equivalent width,  | |||||||
| 43 | 1.73+0.22−0.51 | 6.93 ± 2.16 | 3.86 ± 1.36 | 3.18 ± 1.13 | 0.09 ± 0.30 | 0.30 ± 1.01 | 0.36 ± 1.23 |
| 43 | 2.07+0.11−0.11 | 3.96 ± 0.90 | 3.46 ± 0.80 | 3.05 ± 0.72 | 0.06 ± 0.20 | 0.19 ± 0.67 | 0.23 ± 0.81 |
| 42 | 2.47+0.86−0.28 | 5.69 ± 1.58 | 4.88 ± 1.37 | 4.72 ± 1.35 | 0.43 ± 0.24 | 1.42 ± 0.88 | 1.73 ± 1.05 |
Notes. All observables are given for nebular properties. aN is the number of stacked galaxy spectra in the bin. bNo correction applied. cCorrected only for Hα and Hβ absorption lines (see Section 2.6). dCorrected for Hα and Hβ absorption lines and [N ii] contamination (see Section 2.6). eCalculated from the absorption line and [N ii] corrected Balmer decrements.
Download table as: ASCIITypeset image
4. RESULTS
4.1. Balmer Decrements from Hα Luminosity Stacks
Balmer decrements as a function of Hα luminosities (LHα) are analyzed in this section. The stacked spectra in three different observed LHα bins are shown in the top panel of Figure 2. The total number of stacked galaxies is 128. The size of bins is chosen to have the same number of galaxies.
Figure 7 (left panel) shows the Balmer decrement as a function of observed Hα luminosity. As discussed in Section 2.6, the absorption-line corrections were applied to the Hα and Hβ fluxes and also a correction to account for the contribution of the [N ii] doublet to Hα. These corrected Balmer decrements are shown with filled red stars. The open triangles show the Balmer decrements before applying any of these corrections and the open squares show the Balmer decrements after applying only the absorption-line corrections. The uncertainties are omitted in these open symbols for clarity. The intrinsic Balmer decrement considered in this work of 2.86 (dust-free galaxies) is shown with a dotted line. For comparison, star-forming galaxies in the local universe from the SDSS are shown with contours (galaxies with AGNs were not removed from this sample). The relation between Balmer decrements and observed LHα for these galaxies from the analysis presented in Hopkins et al. (2001) is shown with a dashed-magenta line. The SDSS contours do not exactly match the Hopkins et al. (2001) results because the samples are not exactly the same. The results by Ly et al. (2012) at z ∼ 0.5 are not explicitly shown in Figure 7 (left panel) since they do not provide any parameterization. At any rate, the results by Ly et al. (2012) are compatible within uncertainties with the results presented in Hopkins et al. (2001). The green circles in Figure 7 are the results found in Sobral et al. (2012) at z ∼ 1.5. Table 2 lists the main dust properties of the stacked spectra.

Figure 7. Balmer decrements vs. observed Hα luminosity (left panel), galaxy stellar mass (middle panel), and rest-frame Hα equivalent width (right panel). In all the panels, the open red triangles show the stacked spectra from the whole redshift range without correcting for Hα and Hβ line absorption or [N ii] contamination. The open red squares are the Balmer decrements that include the absorption-line corrections (the uncertainties of the open symbols are omitted for clarity). The filled red stars show the stacked spectra from the whole redshift range 0.75 ⩽ z ⩽ 1.5, which are corrected for both Hα and Hβ absorption lines and the [N ii] doublet contamination (see Section 2.6 for details). All the values represented in this figure are listed in Table 2. The dashed-magenta line in the left panel shows the results by Hopkins et al. (2001). A dashed-blue line in the middle panel shows the relationship provided by Garn & Best (2010) for local galaxies. The results at z ∼ 1.5 presented by Sobral et al. (2012) are shown with green circles in the left and middle panels. The contours show star-forming and AGN SDSS galaxies for comparison. The dotted-black line shows the intrinsic Balmer decrement assumed in our analysis of 2.86.
Download figure:
Standard image High-resolution imageFigure 8 shows the distribution of the individual galaxies in  versus Hα luminosity. The black crosses show galaxies with
  detected at more than 3σ, whereas the gray arrows represent 3σ lower limits. There is a broad scatter in this graph for a given observed Hα luminosity that suggests that our extinction results can only be applied to statistical galaxy samples.

Figure 8. Balmer decrement vs. Hα luminosity for individual spectra. The black crosses represent galaxies with  detected at more than 3σ (11 galaxies). The gray arrows show 3σ lower limits. The other symbols are the same as in the left panel of Figure 7.
Download figure:
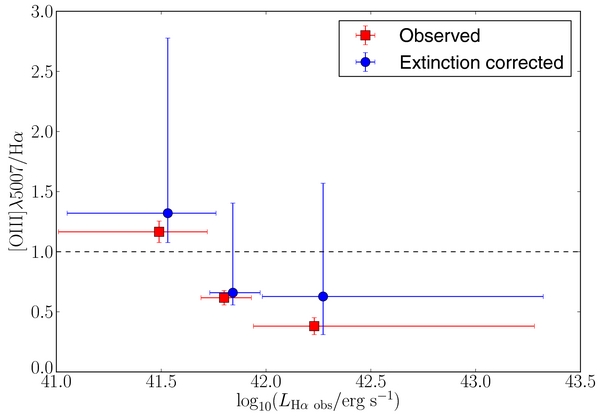
Standard image High-resolution imageFor the faintest star-forming galaxies [O iii] λ5007 is brighter than Hα. This fact is seen clearly in Figure 9, where we show the [O iii] λ5007/Hα ratio as a function of Hα luminosity. The red squares show the observed [O iii] λ5007/Hα. The blue circles show the [O iii] λ5007/Hα after correcting for dust extinction using the Balmer decrements at every observed Hα luminosity bin. The trend of increasing [O iii] λ5007/Hα ratio cannot be explained by dust extinction since the relative corrections between the two wavelengths are generally small. After correcting for dust extinction, the faintest luminosity bin has higher [O iii] λ5007/Hα > 1, significantly higher than in the higher luminosity bins. The relative increase in the [O iii] λ5007 flux is likely due to decreasing metallicity and/or ionization parameter (e.g., Kewley & Dopita 2002).
Figure 9. [O iii]/Hα ratio vs. Hα luminosity. The dust-corrected data have been slightly shifted in the x-axis for clarity. The dashed line represents the constant value of unity.
Download figure:
Standard image High-resolution image
4.2. Balmer Decrements from Galaxy Stellar Mass Stacks
We also analyze the Balmer decrement from the stacked spectra versus galaxy stellar mass. Figure 7 (middle panel) shows the Balmer decrements calculated for the full galaxy sample. (The three composite spectra are shown in the middle panel of Figure 2 as well.) The symbols are the same as in the left panel of Figure 7. We also show star-forming galaxies in the local universe from the SDSS with contours (as in the previous section, galaxies with AGNs were not removed). The dashed-blue line shows the relationship between the Balmer decrement and galaxy stellar mass calculated from the analysis of a different SDSS sample by Garn & Best (2010). The green circles are the results found in Sobral et al. (2012) at z ∼ 1.5. Table 2 lists the dust properties of the galaxy spectra stacked in stellar masses.
4.3. Balmer Decrements from Hα Equivalent Width Stacks
The EW of the Hα emission line (EWHα) is a proxy for the specific SFR of a galaxy. This quantity is defined as the width of the integrated continuum underneath the line that matches the flux of the line. The rest-frame Hα EW is used in this section, which is the observed Hα EW divided by (1 + z). We also study the Balmer decrement as a function of EWHα. The stacked spectra for the overall sample, binned in EWHα, are shown in the bottom panel of Figure 2. The right panel of Figure 7 shows the Balmer decrement calculated from the WISP stacked spectra as a function of Hα EW. All colors and symbols are the same as in the other panels of Figure 7. The main properties of the Hα EW-based stacks are listed in Table 2.
5. DISCUSSION
5.1. Balmer Decrements at 0.75 ⩽ z ⩽ 1.5
We find from Figure 7 (left panel) that the Balmer decrement, and therefore dust extinction, increases with observed LHα in the luminosity range of our analysis. The increase of the Balmer decrement with observed LHα had already been established at lower redshifts by Brinchmann et al. (2004), Garn & Best (2010), and Ly et al. (2012). This trend was also found recently by Sobral et al. (2012) at z ∼ 1.5 using less robust dust indicators than the Balmer decrement. Sobral et al. (2012) used the ratio Hα/[O ii] (taken with narrowband photometry), which is dependent on the unknown galaxy metallicity. We also note that the high star-forming galaxies represented in our sample are found rarely in the local universe. On the other hand, galaxies with the lowest observed LHα (1041 erg s−1 ≲ LHα ≲ 1042 erg s−1) were found in Section 4 to have Balmer decrements compatible with dust-free galaxies.
Our data are not enough to characterize the dependence of the Balmer decrement with galaxy stellar mass but it is consistent with no evolution of the local relation (Figure 7, middle panel). A trend of the Balmer decrement with EWHα (which traces specific star formation) is also not evident from the right panel of Figure 7.
5.2. Evolution of the Balmer Decrement with Redshift
There is a redshift evolution in dust properties as a function of observed LHα from the local universe to higher redshifts. This result remains valid even without applying the [N ii] corrections. Our results are compatible with the claims by Sobral et al. (2012) that an L* galaxy13 at z ∼ 1 (between 1042.25 and 1042.50 erg s−1; Sobral et al. 2012) has the same dust extinction as an L* galaxy today (approximately 1041.20 erg s−1; Ly et al. 2007). This result comes from the fact that the evolution in the dust-extinction dependence with LHα is similar to the evolution from the local universe to z ∼ 1 of L* in the luminosity function. On the other hand, looking at the middle panel of Figure 7, we see that our galaxies span the same stellar mass range as the galaxies studied in the local universe by the SDSS. The dependence of the Balmer decrement with stellar masses does not seem to evolve with time, which is in agreement with results by Sobral et al. (2012) utilizing photometry and a different tracer of extinction.
These results are consistent with the following picture of galaxy evolution. Young star-forming galaxies have typically low content of dust and metals. Significantly older galaxies that built many stars in the past will be dustier and metal-rich. When observing younger galaxies at earlier cosmic times, we see less dust in the interstellar medium even at fixed SFR (see, e.g., Reddy et al. 2006, 2010). Nevertheless, the galaxy stellar mass is correlated with the production of dust and metals in such a way that the same amount of dust is produced per unit of formed stellar mass regardless of which redshift it was formed. Typically the dust is mainly produced by asymptotic giant branch (AGB) stars, which are formed when the galaxy is several 100 Myr old. Therefore, we expect that the correlation of dust extinction with stellar mass will be similar at any epoch except at higher redshifts, when most stars have not had time to enter the AGB phase. Not surprisingly, we find that this issue is not significant at the epoch around z ∼ 1, when the universe was nearly half its present age. However, there is one caveat (which is still controversial) that we do not consider in this picture: dust may be destroyed and/or expelled from the galaxy by outflows.
A possible redshift evolution in the Balmer decrements within our sample is investigated by means of binning in two different redshift ranges but no conclusion can be drawn from our sample due to large uncertainties.
We note that estimating dust extinction from the Balmer decrement is based on the assumption that the Hα extinction is constant across all Hα emitting region. As with any measure of extinction derived from unextinguished light, the Balmer decrement cannot account for optically thick regions of the galaxies. This may result in an underestimate of the total extinction (e.g., Meurer et al. 2002). However, because the extinction is higher in the ultraviolet and because the intrinsic ratios are known, we believe that our Balmer line-derived estimates of the extinction are more robust than those derived with ultraviolet colors. Also, when comparing to other epochs to determine an evolution in extinction, we use the same extinction metrics for consistency (the Balmer decrement). Ideally, we would like to also measure the infrared luminosities of these galaxies to fully account for obscured star formation, but that is not possible given the resolution and confusion limits of existing infrared telescopes.
6. SUMMARY
Statistical interstellar-dust properties of star-forming galaxies were analyzed in this work as a function of LHα, galaxy stellar mass, and rest-frame Hα EW. These properties were derived by stacking the spectroscopic observations of Balmer decrements of 128 star-forming galaxies from the WISP survey.
Evolution in dust-extinction properties from the local universe up to z = 1.5 as a function of LHα is found as already suggested by other more model-dependent (e.g., Buat et al. 2007; Burgarella et al. 2007) or less robust dust-extinction indicators (e.g., Sobral et al. 2012). Our data suggest that galaxies of the same luminosity are more attenuated in the local universe than at z ∼ 1 by a factor that is dependent on luminosity. However, the Balmer decrement as a function of galaxy stellar mass does not seem to evolve with redshift (as suggested by Sobral et al. 2012).
We show that the fainter star-forming galaxies have brighter [O iii] than Hα emission lines. Future galaxy surveys of faint star-forming galaxies may take advantage of the fact that [O iii] is typically brighter than Hα at LHα < 5 × 1041 erg s−1 as it will allow for detection of fainter galaxies and/or higher redshifts than Hα-targeted surveys.
The number of sources in the WISP catalog will increase considerably before its completion and will benefit from ongoing ground-based observations. Our dust extinction results will be updated when these observations are available. The WISP team will soon present further results on the Hα luminosity function (J. W. Colbert et al., in preparation), massive galaxies (A. G. Bedregal et al., in preparation), mass-metallicity relation (A. L. Henry et al., in preparation), and star-forming main sequence (A. Domínguez et al., in preparation). These results will allow us to present a comprehensive picture of the universe at z ∼ 1 and beyond.
The authors thank Naveen Reddy for reading and improving the paper and David Sobral for fruitful discussions. We also thank the anonymous referee for helpful suggestions. This work is based on observations made with the NASA/ESA Hubble Space Telescope, which is operated by the Association of Universities for Research in Astronomy, Inc., under NASA contract NAS 5-26555. These observations are associated with programs 11696, 12283, and 12568.
Footnotes
- 9
In the pure parallel mode, one or more instruments sample the HST focal plane while the prime program observes its planned target according to its desired visit schedule.
- 10
- 11
- 12
- 13
According to a Schechter (1976) parameterization.