


ABSTRACT
We report a multiple spacecraft observation of the 2012 May 17 GLE event. Using the coronagraph observations by SOHO/LASCO, STEREO-A/COR1, and STEREO-B/COR1, we identify two eruptions resulting in two coronal mass ejections (CMEs) that occurred in the same active region and close in time (∼2 minutes) in the 2012 May 17 GLE event. Both CMEs were fast. Complicated radio emissions, with multiple type II episodes, were observed from ground-based stations: Learmonth and BIRS, as well as the WAVES instrument on board the Wind spacecraft. High time-resolution SDO/AIA imaging data and SDO/HMI vector magnetic field data were also examined. A complicated pre-eruption magnetic field configuration, consisting of twisted flux-tube structure, is reconstructed. Solar energetic particles (SEPs) up to several hundred MeV nucleon−1 were detected in this event. Although the eruption source region was near the west limb, the event led to ground-level enhancement. The existence of two fast CMEs and the observation of high-energy particles with ground-level enhancement agrees well with a recently proposed "twin CME" scenario.
Export citation and abstract BibTeX RIS
1. INTRODUCTION
Ground-level enhancement (GLE) events are one type of large gradual solar energetic particle (SEP) event. These events can be observed by ionization chambers and neutron monitors on the ground, hence the name GLE. In these events, protons and ions are accelerated to very high energies (beyond ∼500 MeV amu−1) with intensities often 10–100 times larger than normal gradual SEP events. GLEs are rare. In solar cycle 23, there were only 16 GLEs and the last one occurred on 2006 December 13. While the number of GLE events is small, the observed particle time intensity profiles and spectra of GLEs are similar (although stronger and extended to higher energies) to those of normal gradual SEP events. This suggests that the underlying acceleration of GLE events is the same as that operating in normal gradual SEP events—the diffusive shock acceleration. One intriguing question is then: why do GLEs have larger intensity and higher energies, and what differentiates GLEs from normal gradual SEPs?
Upon examining all GLEs in solar cycle 23, Li et al. (2012) proposed a "twin-Coronal Mass Ejection (CME)" scenario for GLE events and large SEP events. In this scenario, two CMEs go off closely in time from the same active region (AR). The first CME drives a shock which generates a very turbulent downstream. The first shock can also pre-accelerate particles, although not necessarily to very high energies. As the second CME plunges into the strong turbulent region downstream of the first shock with the pre-accelerated population, it will accelerate them to very high energies. Depending on whether there is reconnection (and if yes, how much) between field lines that drape the second CME and that enclose the first CME, the material inside the first CME's driver can be processed by the second CME, leading to an enhancement of heavy ions that are compositionally ICME-like or flare-like. Li et al. (2012) found that all 16 GLEs in solar cycle 23 agree with the "twin CME" scenario.
The "twin CME" scenario, while focusing on the presence of two CME-driven shocks, resembles that of sympathetic eruptions. Sympathetic eruptions are multiple eruptions within a relatively short period of time. They may occur across different source regions, sometimes covering a full hemisphere (Zhukov & Veselovsky 2007; Ding et al. 2006), or in a single but complex source region (Liu et al. 2009; Chen et al. 2011). If two sympathetic eruptions from the same AR occur close in time and both drive shocks, then they are in agreement with the "twin CME" scenario and therefore can be candidate sites for efficient particle accelerations.
Because the "twin CME" scenario suggests that efficient acceleration occurs at the shock driven by the second CME, it implies that single fast CMEs may not lead to large SEP events. Ding et al. (2013) tested the "twin CME" scenario against all large SEP events and western CMEs with speed >900 km s−1 in solar cycle 23 and found that (1) most of the large SEP events agree with the "twin CME" scenario and (2) many single fast CMEs do not lead to large SEP events. As we entered into solar cycle 24 and the solar activity began to increase, one would expect there to be more large SEP events and GLEs events which can provide further test to the "twin CME" scenario.
On 2012 May 17, the first GLE of solar cycle 24 occurred. NOAA reported a long-duration M5.1 X-ray flare of 01:25–02:14 UT. The source AR is 11476 and it is located at (N11, W86). At the level of M5.1, the flare was not particularly large. However, all three energy channels of the GOES spacecraft showed prompt rises, signaling a very efficient particle acceleration process.
Were there two CMEs in this event?
In this paper, using multiple spacecraft observations, including coronagraph observations from SOHO/LASCO (Brueckner et al. 1995), STEREO-A, and STEREO-B (Howard et al. 2008); radio observations from ground-based stations: Learmonth, the Bruny Island Radio Spectrometer (BIRS; Erickson 1997), and the WAVES instrument on board the Wind spacecraft (Bougeret et al. 1995); and high time-resolution SDO/AIA imaging (Lemen et al. 2011) and SDO/HMI vector magnetic field (Schou et al. 2012), we suggest that there were two eruptions and two CMEs in the 2012 May 17 event. Both CMEs were fast and were clearly seen from STEREO-B coronagraph observation. Multiple episodes of type II radio bursts were also observed confirming the existence of CME-driven shocks. The observed ground-level enhancement of energetic particles in the 2012 May 17 GLE event and the fact that there were two fast CMEs in the event supports the recently proposed "twin CME" scenario for GLE events.
2. OBSERVATIONS
2.1. Coronagraph Observations from SOHO-LASCO, STEREO-A, and STEREO-B
Figure 1 shows the relative configuration of the three spacecraft. The angular separation between the Earth and STEREO-A is 114 7; the angular separation between the Earth and STEREO-B is 118°. Since the AR is located at W88 from the Earth, the event was a backside event for STEREO-B and an eastern event from STEREO-A. The propagation directions of the two CMEs are also shown (see below).

Figure 1. Relative configuration of the SOHO, STEREO-A, and STEREO-B spacecraft.
Download figure:
Standard image High-resolution imageCoronagraph observations made by SOHO/LASCO, STEREO-A/COR1, and STEREO-B/COR1 are shown in Figure 2. Figure 2(a1) is the running difference of the STEREO-B COR1 image (02:00–01:55 UT). Figure 2(b1) is the LASCO C2 image at 02:00 UT. The envelopes of the two CMEs can be clearly seen from both panels. In panel (a1), CME1 is seen as a Halo CME, and CME2 is seen to propagate to the left. In panel (b1), both CMEs are to the right of the image. Figure 2(c1) is the running difference (02:00–01:55 UT, same as STEREO-B) of the STEREO-A COR1 image. While the two CMEs were clearly seen from STEREO-B and SOHO, they overlapped and appeared to be propagating together and were hardly distinguishable from the STEREO-A observations.
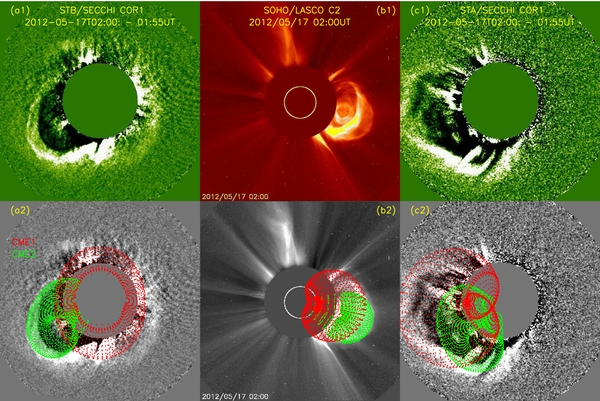
Figure 2. Construction of the two CMEs using the GCS model. The upper panel shows the observations by STEREO-B, SOHO, and STEREO-A. The lower panel shows the constructed two-CME flux ropes using the GCS model.
Download figure:
Standard image High-resolution imageTo better examine the two CMEs, we also use the Graduated Cylindrical Shell (GCS) model to study how CME1 and CME2 propagated. The GCS model is an empirical model to represent the flux-rope-like structures of certain CMEs. It is based on a forward-modeling technique (Thernisien et al. 2006, 2009). The model contains six free parameters to determine the CME's shape in three-dimensional space. These parameters are the longitude ϕ, latitude θ, height h (the height of the legs, or hf, the height of the leading edge), aspect ratio κ, tilt angle γ with respect to the equator, and half angular width δ between the two flux rope legs.
Using the GCS model, Thernisien et al. (2009) have studied 26 CME events. For eight non-halo events, they compared the CME propagation direction obtained from the GCS model with a different approach (Colaninno & Vourlidas 2009) and found a good agreement, ∼10°, between the two models. To systematically quantify how good GCS model is in modeling specific events can be involved and subtle. Thernisien et al. (2009) also developed a sensitive test procedure which can be used to provide an estimate of the uncertainties to the derived model parameters. The procedure involves choosing a user-defined merit function and varying one parameter at a time to maximize the merit function. For the 26 events they studied, Thernisien et al. (2009) obtained an estimate of the uncertainties for all the six parameters. To perform such an analysis, it requires clear measurements of the two CMEs from both STEREO-A and STEREO-B. In our case, the two CMEs were heavily overlapped in STA observation, so we could not perform a similar sensitivity analysis. Instead, we approximate the uncertainties of the CME height for this event by the mean uncertainty given in Thernisien et al. (2009; see their Table 2).
In the lower panels of Figure 2, we overlap the flux ropes as modeled by the GCS model at the time of 02:00 UT. The fitted parameters for CME1 are ϕ = 63°, θ = 0°, γ = 90°, h = 4.5 Rs, κ = 0.69, and δ = 2240; for CME2, ϕ = 94°, θ = −11°, γ = −69°, h = 4.82 Rs, κ = 0.25, and δ = 1761.
The green curves represent the flux rope of CME1 and the red curves represents the flux rope of CME2. As seen from the figure, the GCS model provides a reasonable description of CME1. For CME2, the GCS model yields a less satisfactory result (the modeled angular extension is somewhat smaller than that from the observation). This could happen if the propagation direction of CME2 is non-radial, which can be seen from the SDO observations (shown below). The differences of Δθ and Δϕ between the two CMEs are 11° and 31°. The mean (max) uncertainties for θ and ϕ of the 26 events studied in Thernisien et al. (2009) are 18 (37) and 43 (166). These numbers suggest that there were two distinct CMEs in this event and they have different but close propagation directions.
The height of the two CMEs at different times are shown in Figure 3. We use an uncertainty of 0.48 Rs for the heights (Thernisien et al. 2009). From the height plot, we obtain the speeds of the two CMEs, which are 1258 ± 352 km s−1 and 1539 ± 352 km s−1 for CME1 and CME2, respectively. CME2 seemed to be slightly faster. However, note that there were no data beyond 1:55 UT for CME1. The propagation directions as determined from the GCS model are shown in Figure 1, with the black arrow denoting CME1 and the blue arrow denoting CME2.

Figure 3. GCS model fitted heights of the two CMEs as a function of time.
Download figure:
Standard image High-resolution image2.2. Radio Observations
We now discuss the associated type II radio bursts of the 2012 May 17 event. Figure 4 shows radio observations in the frequency range of 1–180 MHz. These radio data are from the Learmonth (40–180 MHz) and the BIRS ground stations (13.8–40 MHz), as well as the WAVES (<13.8 MHz) instrument on board the Wind spacecraft.
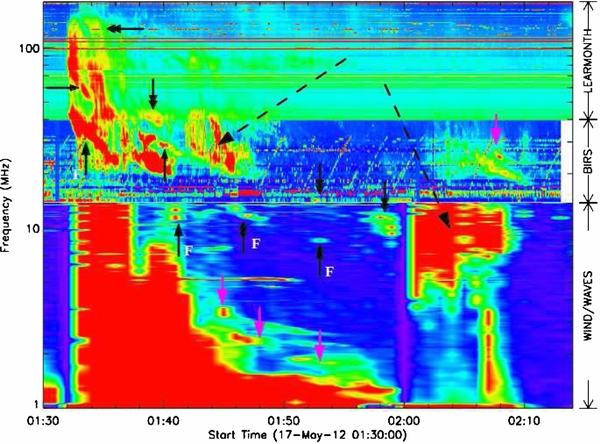
Figure 4. Observed radio bursts of the 2012 May 17 event. Data are from the Learmonth and BIRS ground stations and the WAVES instrument on board the Wind spacecraft. Multiple episodes of type II radio bursts are indicated by the arrows. Two broad emission episodes are also indicated by dashed lines with arrowhead. See the text for details.
Download figure:
Standard image High-resolution imageMultiple episodes of type II radio bursts can be seen from the radio dynamic spectrum. These episodes are indicated by various arrows. Often both plasma emissions at the fundamental and the second harmonic frequencies can be observed. We believe that this is also the case in this event. Since the radio spectrum is not continuous, associating them with the shocks driven by the two CMEs is difficult.
Assuming a two-fold Newkirk (1961) density model, and using a shock speed similar to the obtained CME speeds from the white light imaging, one can estimate how the type II bursts look like for these two shocks. The two single black arrows, if connected, are consistent with a shock of speed 1500 km. The four double black arrows, if connected, are consistent with a shock of speed 1700 km. Comparing to the CME speeds obtained from the white light imaging, it is possible that the two single black arrows are Harmonic type II branches associated with the first CME and the four double black arrows are Harmonic type II branches associated with the second CME. Below these episodes, there are also two single-arrow episodes with label "F" and two double-arrow episodes with label "F." These could be the fundamental branches of the two type II bursts.
There are also other type II radio burst episodes. These are indicated by the pink arrows. These episodes occur either at much lower frequencies or occur at a later time. Therefore, we do not consider them in our study.
When two CMEs occur close in time, they may interact. In particular, if the shock driven by the second CME goes through the dense core of the first CME, intense continuum-like radio emissions can result, as suggested by Gopalswamy et al. (2001, 2003) and Reiner et al. (2003).
In our event, there were two episodes of enhanced radio emissions. These are indicated by the two dashed lines with arrow. The first was between 1:42 and 1:48 (BIRS); and the second was between 2:00 and 2:08 (Wind/WAVES). The shape of the first one resembles that studied in Gopalswamy et al. (2001; see their Figure 1) and could be due to the interaction between the shock driven by CME2 and the core of CME1.
The second episode was between 2:00 and 2:08 (Wind/WAVES). At about 2:07 UT, there were type III radio bursts which extend to <1 MHz. In contrast to the first episode, the envelope of this radio signal does not show a frequency shift. Perhaps this broad emission was caused by the interaction of the two shocks driven by CME1 and CME2. Note that there was another type II radio burst between 2:06 and 2:10 recorded by the BIRS station. This broad radio emission may be related to this type II radio burst.
In any case, the radio observations show clear episodes of type II radio bursts. However, the spectra are not continuous and associating them with the shocks driven by CME1 and CME2 is subject to large uncertainties. Nevertheless, they are consistent with two fast propagating CMEs as shown by the white light observations from SOHO/LASCO, STEREO-A/COR1, and STEREO-B/COR1.
2.3. SDO Observations and Pre-event Magnetic Fields
To examine the eruption process and the pre-event magnetic field, we use the high time-resolution SDO/AIA (Lemen et al. 2011) and SDO/HMI (Schou et al. 2012) observations.
In Figure 5, we plot the SDO/AIA images for the composite channels of 131 Å and 171 Å before and during the eruption. The red color is the 171 Å channel and the blue color is the 131 Å channel. Panel (a) corresponds to a time near 00:26 UT. At the center of the image, a few downward highly inclined loops (indicated by the yellow arrow) can be seen in the 171 Å channel. The plane of the loops and the plane of the paper have a non-zero angle, i.e., the plane of the loop is neither parallel nor perpendicular to the plane of paper. We estimate the angle to be ∼45°. Some distances above these highly inclined loops, other loops, perpendicular to the plane of the paper, can also be seen. These upper loops are not parallel to the lower inclined loops. As we discuss below, such a configuration suggested a bent neutral inversion line (NIL) and may be important in understanding the eruption in this event. Panel (b) corresponds to a time near 00:38 UT. Comparing to panel (a), we see that between the two set of loops, some complicated structures (indicated by the yellow arrow), which can be seen in the 131 Å channel, started to develop. This structure is in the shape of "3" and seems to have two segments, with the one closer to us tilting to the north and the other pointing away from us. This structure further evolved and became twisted and brighter in panel (c), which was taken near 00:50 UT. Since the event was a west limb event, the morphology of the structure is not clear. The structure further evolved and expanded, as can be seen in panel (d), which was taken near 01:13 UT. By then, near the top of these structures, a single rounded loop-like structure (indicated by the yellow arrow) can be seen.
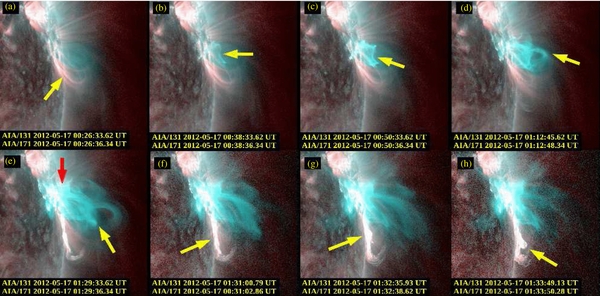
Figure 5. SDO/AIA observations of the composite 137 and 171 Å channels before and during the eruption. Times are shown at the bottom of each panel. The yellow arrow in panel (a) indicates a tilted loop structure, best seen in the 171 (red) Å channel. In panels (b), (c), and (d), one can see a structure (shown by the yellow arrow) in the 131 Å channel that develops and evolves. The loops further expanded in panel (e). In panel (f), one can see that the very top loop bursted and disappeared and the "core" of the first CME moved out of the view. The first CME lifted out at this time. The brightening at the foot points of the tilted loops intensified. The brightening of the foot points continued in panel (g) and a bump, indicated by the yellow arrow, developed. In panel (h), a second "core" was ejected out from the bumpy place identified in panel (g).
Download figure:
Standard image High-resolution imageWe interpret these slow evolving bright structures as due to reconnections of sheared arcades across the NIL. A slow expansion of these brightening structure is consistent with a flux cancellation process (van Ballegooijen & Martens 1989) or a tether-cutting process (Moore et al. 2001) occurring in the lower atmosphere. During this slow reconnection, sheared arcades across the NIL reconnect, enhancing the magnetic energy and helicity of a pre-existing flux rope. The rounded loop in panel (d) could be a natural result of the reconnection of the overlaying arcade (consider for example in two dimensions that an arcade field is stretched outward by an up-moving flux rope from underneath, then as it reconnects onto itself, a rounded loop that is entangled with the flux rope will be generated). Note, while we invoke various reconnection process in describing the 2012 May 17 event, we point out that reconnections need not to occur in a flare/CME eruption. For example, Veselovsky & Panasenco (2006) have discussed scenarios where the eruptions can proceed without large-scale topological changes of coronal magnetic fields. These authors also presented cases where "magnetic reconnection" were indeed spurious cusps and the seemingly reconnection is in fact due to projection effect. Our description of the eruption process for this event therefore should not be taken as the only feasible scenario.
As this slow reconnection continues, the energy in the flux rope will exceed a certain threshold, after which MHD instability sets in, leading to an eruption, which then triggers a fast reconnection (see the sequence of numerical simulations of Hu et al. (2003) and Chen et al. (2007)). In our event, the eruption of the first CME is shown in panel (e), taken at 01:29:33 UT. An ejecta is seen to propagate out at this time. The yellow arrow indicates the ejecta. We interpret this as the "core" of CME1. The red arrow indicates the post-flare loop which is the result of the fast reconnection. The front of CME1 is perhaps already out of view in panel (e). The ejecta moved up rapidly and cannot be seen in panel (f), which was taken near 01:31:00 UT. The loop on the top, which was tangled with the flux rope, also burst and cannot be seen in panel (f).
From panels (a) to (e), the eruption sequence of CME1 agrees with the typical two-stage reconnection process (e.g., Wang 2006). This is in stark contrast with the second CME. Note, until 01:12, i.e., until panel (d), the highly inclined loops, indicated by the yellow arrow in panel (a), remained almost intact by the slow reconnection process of CME1. In panel (e), when the first CME erupted, the highly inclined loops also disappeared and there was a strong brightening at the footpoints of these loops. We interpret these brightenings as due to the induced reconnection (caused by the expansion of CME1) of these highly inclined loops. Panel (g) was taken near 01:32:35 UT, 1.5 minutes after panel (f). The brightening of the footpoints continued in panel (f). A bump, indicated by the yellow arrow, seems to develop. After another 70 s, in panel (h), which was taken near 01:33:49 UT, a second "core" was ejected out from the bumpy place identified in panel (g). We interpret this as the core of the second CME. The timespan from panels (f) to (h) is <3 minutes. The induced reconnection (responsible for CME2) in these 3 minutes is much faster than the earlier slow reconnection process (the first stage of CME1), which lasted ∼50 minutes. The exact lift-off time of CME2 is hard to determine. However, since the bumpy core can be seen in panel (g), one can estimate the lift-off time to be between 01:31 and 01:32. After 01:34, a global wave-like feature propagating outward from the AR can be identified from various AIA channels (e.g., the 193 Å channel).
Liu et al. (2009) have suggested that sympathetic eruptions can occur in a single complex AR. In our event, the two eruptions were from the same AR and could be sympathetic in nature. Note however, they occur very close in time and there were no two episodes of footpoint brightening. Perhaps one may regard the eruption as a single complex eruption with twin ejecta. In the following, however, since two ejecta are clearly seen, we based our discussion of the eruption process as two closely occurring sympathetic eruptions.
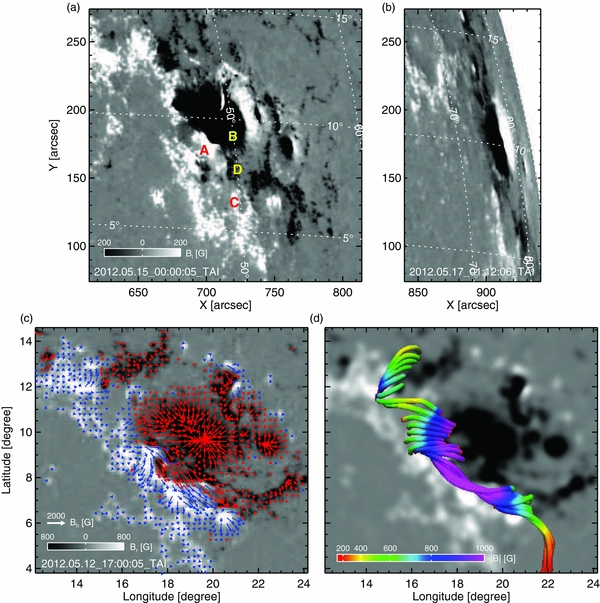
To better understand the eruption process, we have also used SDO/HMI (Schou et al. 2012) to examine the pre-event magnetic field configuration of the AR 11476 several days before the eruption. Figure 6 shows the pre-event line-of-sight (LOS) and horizontal magnetic field measurement of AR 11476, as well as a coronal field reconstruction. Panel (a) is the HMI LOS magnetogram of the AR taken at 00:00 on May 15 and panel (b) taken at 01:12 UT on May 17. Comparing panel (a) and panel (b), the main structure of the AR did not change significantly, although due to the projection effect, not much details can be seen from panel (b). Panel (c) is the HMI vector magnetic field observation. It has the same viewsize as panel (a). The HMI vector magnetogram was taken on May 12 17:00 UT when the AR was near the central meridian. The horizontal field (shown as the arrows) is superimposed on a background of the radial field which is scaled between 800 G. The length of the arrow represents the strength. The color of the arrow (blue/red) indicates the sign (positive/negative) of the radial field. Following Wiegelmann (2004), we also reconstruct the coronal field using a nonlinear force-free (NLFF) model. The reconstructed field resembles a flux rope as shown in panel (d).
Figure 6. (a) HMI line-of-sight (LOS) magnetogram of AR 11476 taken at 00:00 on May 15, about two days before the event. The sunspot with negative polarity is near the image center. (b) HMI LOS magnetogram taken at 01:12 UT on May 17. Both images are scaled between 250 G. (c) HMI vector magnetogram (shown in plate-Carrée projection) of AR 11476 at 17:00 on May 12 when the AR was near the disk center. The horizontal field (shown as the arrows) is superimposed on a background of radial field which is scaled between 800 G. The length of the arrow represents the strength. The color of the arrow (blue/red) indicates the sign (positive/negative) of the radial field. (d) Reconstructed coronal field using a nonlinear force-free (NLFF) model.
Download figure:
Standard image High-resolution image
The field before the eruption was clearly non-bipolar. Furthermore, the neutral line seems to be curved and composed of two segments. As shown in Figure 6(a), points A and B reside on one segment and points C and D reside on the second segment. The fact that there were two set of loops in Figure 5(a) may be related to the two-segment morphology of the NIL shown in Figure 6(b). Indeed, consider two imaginary loops in Figure 6: one connecting A and B and the other connecting C and D. The one connecting A and B resembles the upper loops in Figure 5(a) and that connecting C and D resembles the lower loops in Figure 5(a). Clearly these two loops are not parallel. Such a non-parallel configuration between these loops may be helpful in producing the reconnection of the second set of loops.
The extrapolation of the vector field shown in Figure 6(d) suggested that a flux rope already formed several days before the eruption. This could be the flux rope for the first CME. Again, we note that there need not to be a pre-existing flux rope for the second CME. Reconnection of the strongly sheared arcades can form a flux rope.
3. DISCUSSION AND CONCLUSIONS
From the point of view of particle acceleration, the identification of twin CME-driven shocks is the most important, whereas the detailed eruption process is of less interest. However, understanding the eruption process and in particular understanding under what circumstances and configurations can we expect a twin CME to more likely occur, as well as what the major features/signatures of twin CMEs are, can be helpful to forecast and/or predict a large SEP event.
The eruptions in our event occurred very close in time (within 2 minutes) and close in location (within the same AR, along a single-curved NIL). Since eruptions occurring from the same location, in a similar manner, but at different times, are referred to as homologous eruptions, the 2012 May 17 event resembles both sympathetic and homologous eruptions. What kind of field configuration is favorable for such eruptions?
It is now widely accepted that in CMEs the pre-eruption magnetic configurations consist of two magnetic regimes: one is the core field close to the neutral line, and the other is the large-scale overlying field. While the core field contains most of the free energy of the eruption, the large-scale background coronal field also plays an important role in deciding the eruption sequence. Indeed, in the twisted flux rope model of Torok & Kliem (2005), depending on how fast the overlying field decreases with height, one may get either a confined event or a CME. Performing a statistical study of over 100 X-class flares between 1996 and 2004, Wang & Zhang (2007) noted that confined events tend to occur near the center of ARs and CMEs tend to occur near the boundary of ARs. This is in agreement with Torok & Kliem (2005), since the overlying field is the strongest near the center of an AR and the weakest near the boundary.
For sympathetic eruptions, both CMEs need to overcome the constraints of some overlying fields. In earlier numerical simulations of Hu et al. (2003) and Chen et al. (2007) where only a simple bipole-like coronal field is assumed, no sympathetic eruptions occur. Stimulated by the 2000 July 14 (the Bastille Day) event, where a very sophisticated octupole-like background coronal field existed, Ding et al. (2006) examined the catastrophic behavior of a system consisting of three coronal flux ropes residing in multiple ARs using a 2.5D time-dependent MHD model. The study of Ding et al. (2006) showed that if the magnetic free energy of one of these ropes exceeds a certain threshold, that rope will break away and leave behind a current sheet where significant magnetic reconnection occurs. This reconnection changes the background field around the remaining two flux ropes and substantially reduces the threshold of the free magnetic field energy for these ropes to erupt, leading to their eruptions. An important result of Ding et al. is that a topologically complicated (e.g., an octupole) field seems to be preferentially favorable for sympathetic eruptions.
More recently Schrijver & Title (2011) performed a detailed analysis of the 2010 August 1 event. The 2010 August 1 event was a global sympathetic event. Schrijver & Title (2011) showed that there were connections (see their Figure 1 and Table 1) among all source regions that cover a large portion of the solar surface. Stimulated by this study, Torok et al. (2011) performed a model calculation for the 2010 August 1 event. A configuration consisting of two coronal flux ropes located within a pseudo-streamer and one rope next to it was considered.
In the simulation of Torok et al. (2011), the eruption of the first flux rope is triggered by converging flows from the base and the eruptions of the second (and the third) flux ropes are triggered by the removal of a sufficient amount of stabilizing flux above the flux ropes through reconnection (see their Figure 3).
In the 2012 May 17 event, the eruption was rather confined and occurred within a single but complex source region, AR 11476. However, the general sequence discussed in Torok et al. (2011) is still of relevance: the first eruption causes reconnections of some nearby highly inclined arcade fields that are above some other core fields and triggered the second eruption. It is not clear whether the eruption of the second CME agrees with either the sheared arcade scenario or the flux rope instability scenario. Nevertheless, the SDO observations show clearly that a fast exhaust (with or without a flux rope) was ejected out as a product of the induced reconnection.
The eruption of the 2012 May 17 events seems to have the following features:
- 1.a complicated non-bipolar background coronal field;
- 2.a curved NIL that seems to have two segments;
- 3.two sets of flux loops in non-parallel configuration residing above the two segments of NILs;
- 4.a pre-existing flux rope at the first segment prior to the eruption.
Of course, not all above features are necessary for a sympathetic eruption. However, they may be of help to us to investigate future similar events and, in particular, those events that lead to SEPs.
To summarize, we have examined the 2012 May 17 event using multiple spacecraft observations. Using the coronagraph observations by SOHO/LASCO, STEREO-A/COR1, STEREO-B/COR1, as well as radio observations from ground-based stations Learmonth and BIRS, and the WAVE instrument on board the Wind spacecraft, we show that there were two corona mass ejections in this event. These two CMEs are best seen from STEREO-B coronagraph observation and can be also discerned from SOHO/LASCO. Using SDO/AIA, we identified the two eruptions in this event which occurred from a very complicated active source region. Both CMEs were fast and both drove shocks, with the second shock being faster. Between 1:42 UT and 1:48 UT and 1:57 UT and 2:00 UT, there were enhanced radio emissions in broad frequency ranges that we interpret as due to shock–CME interaction and shock–shock interaction. In an earlier study, Li et al. (2012) found that all GLE events in solar cycle 23 were caused by two or more CME eruptions within a 9 hr window. Li et al. (2012) proposed a "twin CME" scenario for the generation of energetic particles in GLE events. The 2012 May 17 GLE event agrees with the "twin CME" scenario. It is slightly different from the scenario proposed in Li et al. (2012) in that the two CMEs occurred much closer than any other pair in other GLE events. Consequently, besides the effect of a small diffusion coefficient at the second shock, which is advocated as the major reason for an efficient acceleration by Li et al. (2012), particles may also be accelerated as they bounce between the two shocks. Such an effect is only important when the two shocks are very close, which is true in the 2012 May 17 event.
We are grateful to the STEREO/SECCHI, SOHO/LASCO, and Learmonth teams for making their data available online. The SDO data are courtesy of NASA and the HMI and AIA science teams, and the magnetic field extrapolation code is provided by Dr. Wiegelmann. We thank Dr. Stephen White and Dr. Bill Erickson for providing the BIRS data. This work is supported at UAH by NSF grants ATM-0847719, AGS-0962658 and AGS-1135432; NASA grants NNX11AO64G and NNX09AP74A; at SDWH by NNSFC grants 41028004, 40825014, and 40890162; at USTC by 973 key project 2011CB811403, NSFC 41131065, 40904046, 40874075, and 41121003 and the CAS Key Research Program KZZD-EW-01-4. X.D.S. is supported by NASA contract NAS5-02139 (HMI) to Stanford University.