


ABSTRACT
Using the volume-limited Main galaxy sample of the Sloan Digital Sky Survey Data Release 6, we have explored the dependence of clustering properties of galaxies on the star formation activity. It is found that star-forming galaxies preferentially form isolated, close double and multiple systems, while passive galaxies preferentially inhabit the dense groups and clusters. We also construct the two samples with the same galaxy number and number density, and reach the same conclusion, which shows that our statistical conclusion is robust.
Export citation and abstract BibTeX RIS
1. INTRODUCTION
The clustering properties of galaxies not only describe inhomogeneities of the universe but also provide clues to understanding of galaxy formation theories. Many studies showed that galaxies with different physical properties cluster differently (Brown et al. 2000; Carlberg et al. 2001; Norberg et al. 2001, 2002; Zehavi et al. 2002, 2005; Budavári et al. 2003; Madgwick et al. 2003; Hogg et al. 2003; Deng et al. 2008b, 2008c, 2009b, 2009c). The correlation function was the most popular method for investigating this issue. Brown et al. (2000) found that the galaxy correlation function depends strongly on color, with red galaxies more strongly clustered than blue galaxies by a factor of ⩾5 at small scales. Norberg et al. (2001) measured the projected two-point correlation function of galaxies in a series of volume-limited samples drawn from the Two-Degree Field Galaxy Redshift Survey (2dFGRS), and showed that the clustering amplitude increases slowly with absolute magnitude for faint galaxies, but rises more strongly at higher luminosities. Using Sloan Digital Sky Survey (SDSS) data, Zehavi et al. (2005) also found strong luminosity and color dependence of the galaxy two-point correlation function. The dependence of clustering properties of galaxies on morphologies is that late-type galaxies have considerably weaker clustering than early-type galaxies (Davis & Geller 1976; Loveday et al. 1995). To disentangle the dependence of morphology and color on the environment, Skibba et al. (2009) analyzed the environmental dependence of galaxy color at fixed morphology and the environmental dependence of galaxy morphology at fixed color. It was found that at fixed morphology, galaxy color is strongly correlated with the environment, but morphology-made correlation functions are relatively weak at fixed color.
But the correlation function cannot clearly describe the geometry of the distribution of galaxies. Cluster analysis (Einasto et al. 1984) is a method which is sensitive to the geometry of the distribution of galaxies. By this method, the galaxy sample can be separated into isolated galaxies, close double and multiple galaxies, galaxy groups, or clusters and even superclusters which consist of clusters and strings of galaxies. Galaxy strings form bridges between superclusters and join all superclusters to a single infinite network. Using the volume-limited Main galaxy sample (Strauss et al. 2002) of the SDSS Data Release 6 (SDSS DR6; Adelman-McCarthy et al. 2008), Deng et al. (2008c) constructed an early-type sample and a late-type sample, and performed comparative studies of clustering properties between two samples. It was found that the distribution of late-type galaxies is more filamentary, which is in good agreement with the conclusion obtained by Pandey & Bharadwaj (2006). In addition, in the late-type sample, the fractions of single, close double and multiple galaxies are higher than the ones of the early-type sample, but the fraction of grouped galaxies is lower. Deng et al. (2009b) also investigated clustering properties for Main galaxy samples with different g − r color, and found that the redder galaxies preferentially inhabit the dense groups and clusters. The results of Deng et al. (2008c, 2009b) are consistent with a widely accepted conclusion: luminous, red, and early-type galaxies exist preferentially in the densest regions of the universe (e.g., Deng et al. 2008a). In this study, we use cluster analysis and perform comparative studies of clustering properties between star-forming galaxies and passive ones. Our paper is organized as follows. In Section 2, we describe the data used. The cluster analysis is discussed in Section 3. In Section 4, we perform comparative studies of clustering properties between star-forming galaxies and passive ones. Our main results and conclusions are summarized in Section 5.
2. DATA
Many of survey properties of the SDSS were discussed in detail in the Early Data Release paper (Stoughton et al. 2002). Galaxy spectroscopic targets were selected by two algorithms. The Main galaxy sample (Strauss et al. 2002) comprises galaxies brighter than rpetro < 17.77 (r-band apparent Petrosian magnitude). This sample has a median redshift of 0.10 and few galaxies beyond z = 0.25, in which most galaxies are within the redshift interval 0.02 ⩽ z ⩽ 0.2. The luminous red galaxy (LRG) algorithm (Eisenstein et al. 2001) selects galaxies to rpetro < 19.5 that are likely to be luminous early types, based on the observed colors. In our work, the data are downloaded from the Catalog Archive Server of SDSS DR6 (Adelman-McCarthy et al. 2008) by the SDSS SQL Search (with SDSS flag: bestPrimtarget& 64 > 0) with high-confidence redshifts (Zwarning ≠ 16 and Zstatus ≠ 0, 1 and redshift confidence level: Zconf > 0.95) (http://www.sdss.org/dr6/). From this sample, we select 469,199 Main galaxies in the redshift interval 0.02 ⩽ z ⩽ 0.2. We use the volume-limited Main galaxy sample constructed by Deng et al. (2007), which contains 112,889 galaxies, extends to Zmax = 0.089, and is limited to the absolute magnitude interval  . The absolute magnitude Mr is calculated from the r-band apparent Petrosian magnitude, using a polynomial fit formula (Park et al. 2005) for the K-correction within 0 < z < 0.3:

Previous studies showed that colors (e.g., Larson & Tinsley 1978), Hα equivalent width (e.g., Keel et al. 1985; Bushouse 1986; Kennicutt et al. 1987) and far-infrared luminosities (e.g., Bushouse et al. 1988) can be used as indicators of star formation. Balogh et al. (2004a) found that emission-line (W0(Hα) > 4 Å) and passive (W0(Hα) < 4 Å) galaxies form two distinct populations, as characterized by their Hα equivalent width, W0(Hα). In this study, we also use Hα equivalent width as indicators of star formation, take the same threshold as Balogh et al. (2004a) (W0(Hα) = 4), and divide the volume-limited Main galaxy sample of the SDSS DR6 into two classes: 64,815 passive galaxies (the passive sample) and 48,073 emission-line galaxies. We note that in the volume-limited Main galaxy sample, there is a galaxy without equivalent width.
It is noteworthy that the galaxy sample selected by W0(Hα) > 4 Å includes active galactic nuclei (AGNs) as well as star-forming galaxies. By considering the classical diagnostic ratios of two pairs of relatively strong emission lines, Baldwin et al. (1981, hereafter BPT) demonstrated that it is possible to distinguish AGNs from normal star-forming galaxies. To separate star-forming galaxies from AGNs, in this study, we use the empirical demarcation line developed by Kauffmann et al. (2003):
We download the flux and error in the flux of four lines from http://www.mpa-garching.mpg.de/SDSS/DR7/. Kauffmann et al. (2003) imposed a lower limit of 3 in signal-to-noise ratio (S/N) on the four lines in the BPT diagram. Among 48,073 emission-line galaxies, 42,194 galaxies have S/N > 3 on the four lines. Figure 1 shows the ratio [O iii]λ5007/Hβ versus the ratio [N ii]λ6584/Hα for 42194 emission-line galaxies with four lines S/N > 3. By the criteria of Kauffmann et al. (2003), we select 30,926 normal star-forming galaxies and construct our star-forming sample.
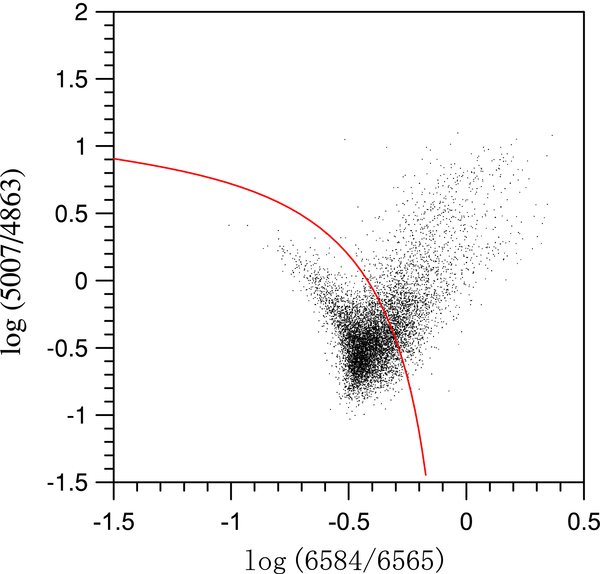
Figure 1. BPT diagram which shows the emission-line ratio [O iii]/Hβ vs. [N ii]/Hα for 42194 emission-line galaxies with four lines S/N > 3. The red curve shows the demarcation developed by Kauffmann et al. (2003). The symbol frequency is 5 (only plot one point in each five points).
Download figure:
Standard image High-resolution imageIn calculating the distance, we used a cosmological model with a matter density Ω0 = 0.3, cosmological constant ΩA = 0.7, and Hubble constant H0 = 100 h km s−1 Mpc−1 with h = 0.7.
3. CLUSTER ANALYSIS
Cluster analysis (Einasto et al. 1984) used here is actually the friends-of-friends algorithm by which the galaxy sample can be separated into individual systems at a given neighborhood radius R. Starting from one galaxy of the sample, we search all galaxies within a sphere of radius R around it, and call these close galaxies "friends." These "friends" and the starting galaxy are considered belonging to the same system. Around new neighbors, we continue the above procedure using the rule "any friend of my friend is my friend." When no more new neighbors or "friends" can be added, then the procedure stops and a system is identified. Apparently, at small radii, most systems are some isolated single galaxies, the rest being close double and multiple galaxies. At larger radii groups and clusters of galaxies and even superclusters will be formed. Superclusters are the largest non-percolating galaxy systems which contain clusters and groups of galaxies with their surrounding galaxy filaments (Einasto et al. 2001, 2006, 2007a, 2007b). By selecting different neighborhood radii, we can probe the structures at different scales.
The mean density of galaxies is  N/V (N is the number of galaxies contained in the volume V). The Poisson radius (radius of the sphere with unit population) is
  . In this paper, we express all distances in dimensionless radii r = R/R0. Poisson radii (comoving distance) are 5.09 Mpc for the passive sample and 6.52 Mpc for the star-forming sample.
4. COMPARATIVE STUDIES OF CLUSTERING PROPERTIES BETWEEN THE PASSIVE SAMPLE AND THE STAR-FORMING SAMPLE
According to the analysis of Einasto et al. (1984), maximum lengths of the systems can be calculated by three different methods. In this study, the maximal length of a system is defined as the maximum distance between members of this system. For small radii, the galaxy systems by cluster analysis consist mostly of isolated galaxies, close double and multiple galaxies. A few systems form groups and conventional clusters of galaxies. At dimensionless radius r = 0.5, the richest system only contains: 27 galaxies in the star-forming sample and 167 galaxies in the passive sample; the maximal length of the largest system is 17.83 Mpc in the star-forming sample and 36.82 Mpc in the passive sample. These richest and largest systems actually are groups or clusters of galaxies. Undoubtedly, at such a dimensionless radius, we can explore clustering on small scales. At radius r = 1.2, the richest system contains 2679 galaxies in the star-forming sample and 5727 galaxies in the passive sample; the maximal length of the largest system is 337.76 Mpc in the star-forming sample and 431.96 Mpc in the passive sample, which are even comparable with the Sloan Great Wall (Deng et al. 2006; Gott et al. 2005). Deng et al. (2008b) defined L0 = V1/3 (the edge length of the cube) as the rough estimate of the edge length of the sample volume V, and express the maximal length of the largest system as dimensionless length dmax = Dmax /L0. The edge length L0 of the volume-limited Main galaxy sample is 329.68 Mpc. At radius r = 1.2, the maximal dimensionless length of the largest system is dmax = 1.02 in the star-forming sample and dmax = 1.31 in the passive sample, which shows that the largest string system already reaches opposite sidewalls of the sample. Actually, at radius r = 1.2, systems begin to merge into filamentary superclusters and finally into the entire interconnected supercluster network or the 'cosmic Web.' Thus, in this study, we analyze clustering properties of two samples from dimensionless radii r = 0.5 to r = 1.3, which can explore clustering properties at all scales.
In order to describe the distribution of systems having different sizes, we analyze the multiplicity functions: the fraction of galaxies in systems of membership from n to n+dn, which depend on the dimensionless radii r. We divide the interval from 1 to N (the total number of galaxies) into seven subintervals: n = 1; 2 ≤ n < 5; 5 ≤ n < 20; 20 ≤ n < 50; 50 ≤ n < 100; 100 ≤ n < 200; n ≥ 200, and then construct histograms of the multiplicity functions from dimensionless radii r = 0.5 to r = 1.3. In each histogram, systems which contain one galaxy are in the first bin, systems which contain from two to four galaxies are in the second bin, systems with five to 19 galaxies in the third bin, and so on.
In Figure 2, the multiplicity functions are shown for the passive sample and the star-forming one. The (1σ) error bars are Poissonian errors. Deng et al. (2008c) showed that the fraction of grouped galaxies in the early-type sample is higher than the one in the late-type sample. Deng et al. (2009b) found that the redder galaxies preferentially inhabit the dense groups and clusters. As seen from Figure 2, star-forming galaxies preferentially form isolated, close double and multiple systems, while passive galaxies preferentially inhabit the dense groups and clusters. Such a behavior is consistent with star formation activity being correlated with morphological type and color. It is widely accepted that the majority of the red population corresponds to objects with little or no current star formation, and that the majority of the blue population corresponds to star-forming galaxies. With consideration of the bimodality of the u − r color distribution (e.g., Strateva et al. 2001), we classify galaxies above and below the divider (the observed u − r color = 2.22) as "red" and "blue," respectively. It is found that about 83.46% red galaxies are passive ones, and 63.37% blue galaxies are star-forming ones. Deng et al. (2009a) indicated that there is a fairly high proportion (about 45.73%) of red galaxies which are classified as late types, but the majority of the blue population (about 93.34%) still corresponds to late types. Like Deng et al. (2009a) did, we also use the concentration index ci = R90/R50 to separate early-type (ci ⩾ 2.86) galaxies from late-type (ci < 2.86) galaxies (Shimasaku et al. 2001, Nakamura et al. 2003). R50 and R90 are the radii enclosing 50% and 90% of the Petrosian flux, respectively. It turns out that about 56.31% passive galaxies are early types, and 93.68% star-forming galaxies are late types. Like red galaxies do, the passive population contains a substantial fraction of late-type objects (43.69%). Due to tight correlations between physical parameters of galaxies (e.g., Bower et al. 1992; Strateva et al. 2001; Blanton et al. 2003; Baldry et al. 2004; Balogh et al. 2004b; Kelm et al. 2005), the dependence of clustering properties of galaxies on physical parameters becomes fairly complicated. The dependence of clustering properties on some parameters will result in the one on other parameters. Maybe, we should investigate which parameter is fundamental.
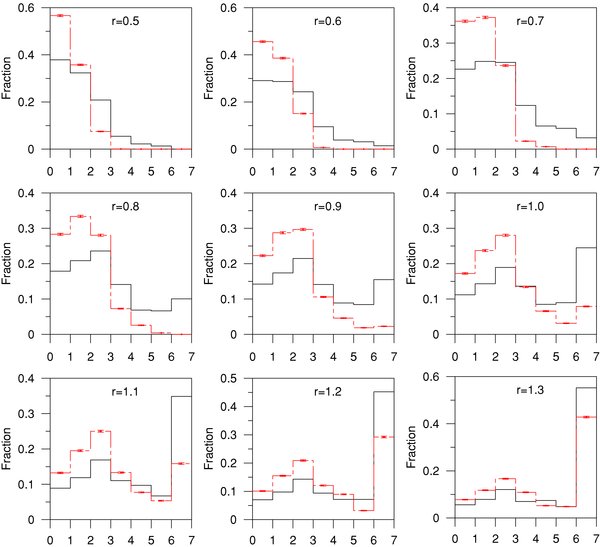
Figure 2. Histograms of multiplicity functions for the passive sample (black solid line) and the star-forming sample (red dashed line) from dimensionless radii r = 0.5 to r = 1.3. The error bars for the red dashed line are 1σ Poissonian errors. The error bars for the black solid line are omitted for clarity.
Download figure:
Standard image High-resolution imageCompact groups of galaxies (CGs) are small and dense systems of several galaxies in the universe, and often are located at the centers of concentration in groups or clusters. In contrast, isolated galaxies reside in the most underdense regions. Member galaxies of CGs and isolated galaxies are located at both extremes of density. Like Deng et al. (2008a) did, we use the catalog of CGs (containing 6202 member galaxies) constructed by Deng et al. (2008d) and the isolated galaxy sample (containing 4343 isolated galaxies) extracted by Deng et al. (2007), and compute the fraction of passive galaxies for the two samples at both extremes of density: 72.06% in CGs and 43.66% in isolated galaxies. In the volume-limited Main galaxy sample, this fraction is 57.42%, which further shows that passive galaxies preferentially inhabit the dense groups and clusters.
Deng et al. (2009a) computed the local three-dimensional galaxy density in a comoving sphere around each galaxy whose radius is the distance to the fifth nearest galaxy, and constructed two samples at both extremes of density containing 5% of the galaxies in the volume-limited Main galaxy sample. We compute the fraction of passive galaxies in such two samples at both extremes of the three-dimensional density: 75.71% in the sample at high density, 44.53% in the sample at low density. Because the three-dimensional density estimator is severely biased by galaxy peculiar velocities, especially in the dense region, Deng et al. (2009a) also measured the projected local density  which is computed from the distance to the fifth nearest neighbor within a redshift slice ±1000 km s−1 of each galaxy (e.g., Goto et al. 2003; Balogh et al. 2004a, 2004b), to see if it changes the results greatly or at all. The fraction of passive galaxies in the two samples at both extremes of the projected density is 67.89% in the sample at high density and 45.07% in the sample at low density. These results again show that passive galaxies exist preferentially in the densest regions of the universe.
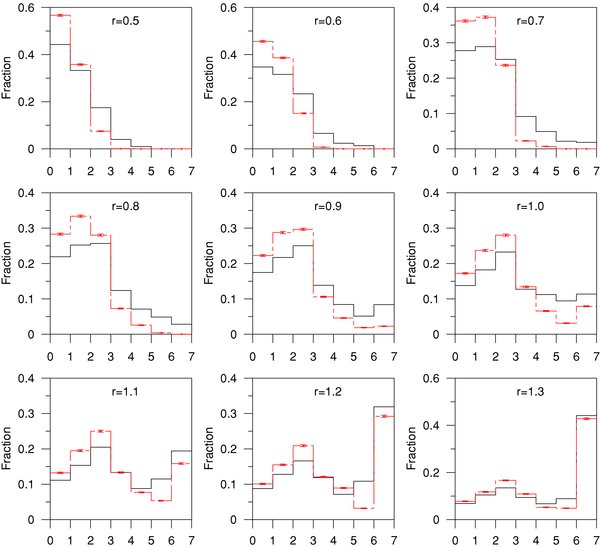
The passive sample and the star-forming one have different number density. Apparently, in a sample with larger number density, richer and larger systems can be more easily found. Deng et al. (2008c, 2009b) showed that although dimensionless radii are used to express distances, this replacement cannot completely correct above bias. Like Deng et al. (2008c), we randomly extract a subsample from the passive sample, which has the same galaxy number and number density as the star-forming sample, and again perform above analyses. As seen from Figures 2 and 3, the random passive sample has a higher proportion of small and poor systems and a lower proportion of large and rich systems than the passive sample. This is due to the difference of number density between galaxy samples, which again shows that the use of dimensionless radii cannot completely correct such a bias. It is noteworthy that in Figure 3, we still observe the significant trend: star-forming galaxies preferentially form isolated, close double and multiple systems, while passive galaxies preferentially inhabit the dense groups and clusters. These results show that our statistical conclusion is robust.
Figure 3. Histograms of multiplicity functions for the random passive sample (black solid line) and the star-forming sample (red dashed line) from dimensionless radii r = 0.5 to r = 1.3. The error bars for the red dashed line are 1σ Poissonian errors. The error bars for the black solid line are omitted for clarity.
Download figure:
Standard image High-resolution image
5. SUMMARY
Using the Hα equivalent width and BPT diagram, we divide the volume-limited Main galaxy sample of the SDSS DR6 into two samples: the passive sample (containing 64,815 galaxies) and the star-forming sample (containing 30,926 galaxies), to explore the dependence of clustering properties of galaxies on the star formation activity. Because the two samples have different number density, we randomly extract a subsample from the passive sample, which has the same galaxy number and number density as the star-forming sample, and again perform the same analyses. It is found that star-forming galaxies preferentially form isolated, close double and multiple systems, while passive galaxies preferentially inhabit the dense groups and clusters. Our study also shows that this statistical conclusion is robust.
We thank the anonymous referee for many useful comments and suggestions, and also Professor Jarle Brinchmann for answering many questions from http://www.mpa-garching.mpg.de/SDSS/DR7/. Our study was supported by the National Natural Science Foundation of China (NSFC, Grant 10863002) and also supported by the Program for Innovative Research Team of Nanchang University. Funding for the SDSS and SDSS-II has been provided by the Alfred P. Sloan Foundation, the Participating Institutions, the National Science Foundation, the US Department of Energy, the National Aeronautics and Space Administration, the Japanese Monbukagakusho, the Max Planck Society, and the Higher Education Funding Council for England. The SDSS Web site is http://www.sdss.org.
The SDSS is managed by the Astrophysical Research Consortium for the Participating Institutions. The Participating Institutions are the American Museum of Natural History, Astrophysical Institute Potsdam, University of Basel, University of Cambridge, Case Western Reserve University, University of Chicago, Drexel University, Fermilab, the Institute for Advanced Study, the Japan Participation Group, Johns Hopkins University, the Joint Institute for Nuclear Astrophysics, the Kavli Institute for Particle Astrophysics and Cosmology, the Korean Scientist Group, the Chinese Academy of Sciences (LAMOST), Los Alamos National Laboratory, the Max Planck Institute for Astronomy (MPIA), the Max Planck Institute for Astrophysics (MPA), New Mexico State University, Ohio State University, University of Pittsburgh, University of Portsmouth, Princeton University, the US Naval Observatory, and the University of Washington.