


ABSTRACT
We have determined projected rotational velocities, v sin i, from Magellan/MIKE echelle spectra for a sample of 136 early B-type stars having large Galactocentric distances. The target selection was done independently of their possible membership in clusters, associations or field stars. We subsequently examined the literature and assigned each star as Field, Association, or Cluster. Our v sin i results are consistent with a difference in aggregate v sin i with stellar density. We fit bimodal Maxwellian distributions to the Field, Association, and Cluster subsamples representing sharp-lined and broad-lined components. The first two distributions, in particular, for the Field and Association are consistent with strong bimodality in v sin i. Radial velocities are also presented, which are useful for further studies of binarity in B-type stars, and we also identify a sample of possible new double-lined spectroscopic binaries. In addition, we find 18 candidate Be stars showing emission at Hα.
Export citation and abstract BibTeX RIS
1. INTRODUCTION
Massive O- and B-type stars have some of the largest average projected rotational velocities among main-sequence stars, and stellar rotation appears to be a fundamental parameter in their evolution. Some studies have concluded that the rotational velocity distribution of massive stars depends on their environment. Early work by Guthrie (1982), and more recent studies by Wolff et al. (2007), explored this by examining stars formed in low-density regions destined to become unbound stellar associations and comparing them with regions that will survive as rich, bound, stellar associations. They demonstrate a clear difference between these physical groups, which show higher values of mean v sin i as compared with the field stars, whose v sin i distribution peaks at much lower values. Wolff et al. (2007) suggest that it results from the actual star formation conditions; they suggest that stars in rich clusters form in high-density, strongly turbulent conditions, which results in higher net v sin i on the stellar products.
Other studies have considered the evolutionary age of the stars, with more evolved stars showing slower rotation as their stellar radius increases (e.g., Huang & Gies 2006; Huang et al. 2010). Since field stars can be expected, on average, to be somewhat older objects, most likely originating from associations that have since dispersed, their observed lower v sin i may simply be due to this evolutionary spin-down effect.
An important consideration is that field massive stars may have two different origins. The existence of isolated, OB runaway stars ejected from clusters and associations is well established (e.g., Blaauw 1961; Gies 1987; Hoogerwerf et al. 2000). Most recently, Oey & Lamb et al. (2012) have also argued that a significant component of the field massive star population forms in situ: they were not born in clusters. They stress the existence of individual field O stars that appear to have formed in isolation or near isolation (e.g., Lamb et al. 2010; Selier et al. 2011; Oey et al. 2013; Oskinova et al. 2013). They also present other arguments for in situ formation of field OB stars based on the form of the massive star clustering relation (Oey et al. 2004) and the observed steep initial mass function of field stars (e.g., Massey 2002; Lamb et al. 2012). They also suggest that the bimodal distribution of v sin i in field OB stars seen in the work by Wolff et al. (2007) is important evidence to support this scenario.
Another parameter that has been discussed as having an influence on stellar rotation is stellar metallicity: low-metallicity stars have reduced winds and thus retain their angular momentum. This is consistent with the observed higher frequencies of Oe and Be stars in the metal-poor, Small Magellanic Cloud (Martayan et al. 2007; Golden-Marx et al. 2014), assuming that their Balmer emission is due to decretion disks.
We present herein spectroscopic observations of 136 early B-type stars, selected within a narrow spectral-type range, and without bias concerning membership in clusters, OB associations, or the general field. They were observed as part of a larger study of the metallicity variations as a function of galactocentric distance (G. A. Bragança et al. 2015, in preparation). Bragança et al. (2012 hereafter GB2012) discusses v sin i distributions of a sample of 350 O- and B-type stars in the nearby galactic disk. The present study represents a sample from the galactic outer disk. As a first exploration, we have measured v sin i values, and discuss the dependence of rotational velocity on environment by trying to evaluate the difficult question of membership in clusters and associations. The v sin i distributions are fit with two component models, considering bimodality as a possible signature of the two different mechanisms for producing field B-type stars, in situ formation versus runaway ejection. Section 2 describes the sample selection and observations. Section 3 discusses these results.
2. SAMPLE SELECTION AND OBSERVATIONS
Our sample of early B-type stars is designed to select targets with the greatest possible galactocentric distances. We used the compilation by Reed (1998, 2003) of the Case–Hamburg survey. Reed collected all of the published photometry and spectral types for the stars included in Stephenson & Sanduleak (1971) "Luminous Stars in the Southern Milky Way," as well as stars listed in the "Northern Milky Way Luminous Star Catalogs" (Stock et al. 1960; Nassau & Stephenson 1963; Hardorp et al. 1964; Nassau et al. 1965). These catalogs, totaling over 12,000 objects, are based on objective-prism surveys and provide the most extensive available listing of intrinsically luminous stars within approximately 10° of the galactic plane. The objective-prism plates covered the plane of the Milky Way to a limiting photographic magnitude of approximately 13.5. The majority of stars classified are O- and early B-type stars.
We selected stars in the Reed catalog between galactic longitudes of 180°–250°. We employed the reddening free photometric index  , valid for main-sequence stars earlier than A0 (Johnson & Morgan 1953), and selected stars with a Q index between −0.98 and −0.60, corresponding to spectral types B2 and earlier according the calibration presented by Fitzgerald (1970). Stars brighter than V = 10 were not observed, nor were stars whose published spectral types indicated emission.
The spectral types in Reed's compilation come from a variety of sources, some from over 30 years ago, some much more recent. There are often multiple spectral types published for the same star. We have generally adopted the most recent spectral classification. In our sample, 86% are of the luminosity classes IV–V; the remaining are either luminosity III or without a luminosity classification. Thus, we can tentatively claim these to be largely a sample of unevolved stars.
The targets are further selected based on their photometric distances, with the goal of observing a large sample of B-type stars at the largest possible galactocentric distances. The distances for our targets were computed making use of the reddening free index Q. The relation between Q and  is single-valued throughout the O- and B-type star range. Using the intrinsic colors given by Mermilliod (1981) for luminosity class V stars, the calibration between absolute magnitude and spectral type from Vacca et al. (1996), and the distance modulus equation, we derive the following expression for absolute magnitude.

The heliocentric distances of the target stars computed in this way versus their distribution in galactic longitude are shown in Figure 1(a); their distribution in galactic l and b are shown in Figure 1(b).
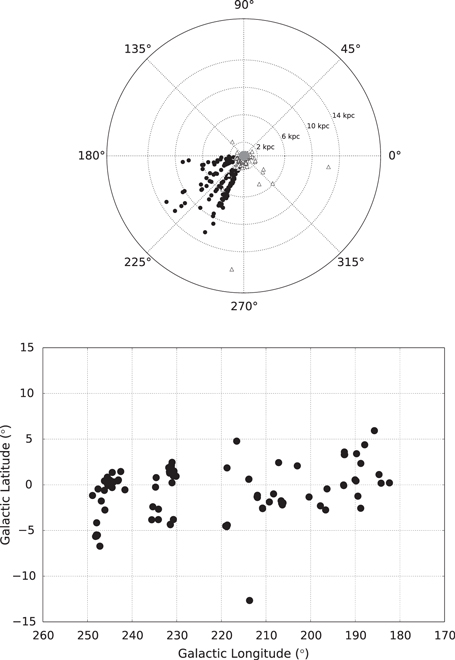
Figure 1. (a) Top: the distribution in galactic longitude and photometric heliocentric distance for the stars in this study. For comparison, the stars from GB2012 are also indicated by triangles. (b) Bottom: the distribution of the stars in this study in galactic longitude and latitude.
Download figure:
Standard image High-resolution imageHigh-resolution spectra were obtained over six beautiful nights (2007 December 29–2008 January 3) with the MIKE spectrograph at the Magellan Clay 6.5 m telescope at Las Campanas Observatory in Chile. MIKE (Bernstein et al. 2003) is a double echelle spectrograph that simultaneously records red (4900–9500 Å) and blue (3350–5000 Å) spectra. Using a 0.7 arcsec slit, we obtained a spectral resolution in the blue of about 53,000, calculated from measurements of the Th-Ar calibration images, which indicated 1.9 pixels as the best FWHM along the dispersion direction with 0.041 Å pixel−1. Our exposure times were based on a desired SNR of 100. The MIKE data were reduced with the Carnegie python pipeline software.
2.1. Derivation of v sin i Values
We measured the FWHM for the He i lines at 4026, 4388, and 4471 Å. The blue wings for some of the He iline profiles are affected by secondary components such as 4023.98 and 4026.2 of He i and 4387.00 and 4469.96 of [He i]. These are distinguishable from the main profile at very low v sin i, but are blended at higher rotation rates. The regions containing the He ilines at 4026, 4388, and 4471 Å were manually normalized to a unit continuum using the splot task in IRAF. The "h," then "b" splot commands measure the right half of the line profile and display the FWHM.
The intrinsic line widths (about 1 Å) are considerably broader than the instrumental resolution (0.08 Å), thus no adjustment was made for the latter. No special treatment was considered for determining the v sin i of the very-broad-lined stars. It should be noted, however, that for those stars with rotational velocities approaching the critical limit, the effect of gravity darkening can lead to systematic underestimation of the projected rotational velocities (see e.g., Townsend et al. 2004; Frémat et al. 2005). Macroturbulence may also contribute to the line widths (see Simon-Diaz & Herrero 2014), although this would affect mostly stars with lower surface gravities, which we ignore in our subsequent analysis. Figure 2 shows examples of both a low (ALS14013) and high (ALS19267) v sin i star for the three helium lines analyzed here.
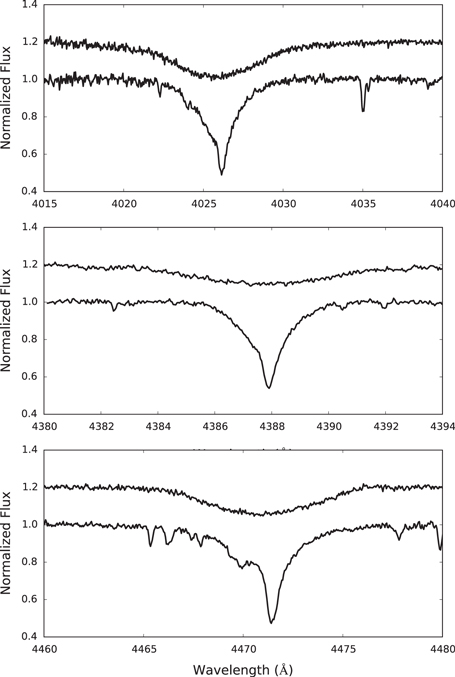
Figure 2. Examples of He iline spectra for the lines at 4026, 4387, and 4471 Å. Each panel shows ALS19267, a broad-lined star, (top), and ALS14013, a narrow-lined star, (bottom).
Download figure:
Standard image High-resolution imageAs in Paper I, we have used the calibrations in Daflon et al. (2007) to determine v sin i for this sample. We used the same grid of synthetic spectra of B-type stars computed by Daflon et al. (2007) and measured the FWHM for each of the three He i lines: 4026, 4388, and 4471 Å (as in Paper I) . We derived analytical expressions between v sin i and FWHM for each of the three He i lines, for three temperatures: 20,000, 25,000, and 30,000 K. We adopted the conversion formulae appropriate for the temperature nearest to that estimated for each star to represent each He iline. A reasonable estimate of each star's temperature was derived from the parameter Q, listed in Table 1, and the analytical relationship derived between Q and temperature given in Massey et al. (1989). While log g also affects the FWHM, all of the stars used in our statistical analysis are of the luminosity classes IV–V. We will address the effect of surface gravity further in a later analysis (Bragança et al. 2015, in preparation). Our analytical relations follow, in which FWHM is in Å and v sin i is expressed in km s−1: these were used to convert the measured FWHM values for each corresponding line in the program stars given in Table 1.
Table 1. Observed and Derived Data
| (1) | (2) | (3) | (4) | (5) | (6) | (7) | (8) | (9) | (10) | (11) | (12) | (13) | (14) | (15) | (16) | (17) |
|---|---|---|---|---|---|---|---|---|---|---|---|---|---|---|---|---|
| FWHM (Å) | ||||||||||||||||
| ALS | V | λ 4026 | λ 4388 | λ 4471 |

|
σvsi | RV | σRV |

|
Q |

|

|
dKpc | SpType | CAF | Rem |
| 7 | 10.91 | 0.98 | 0.89 | 0.81 | 0 | 0 | 23.6 | 1.7 | 10 | −0.8 | 0.61 | −3.7 | 3.4 | B1 IV | F | ... |
| 18 | 10.74 | 1.59 | 1.52 | 1.58 | 26 | 11 | 67.3 | 2.3 | 10 | −0.79 | 0.85 | −3.6 | 2.2 | B0 V | A | ... |
| 19 | 11.66 | 1.43 | 1.62 | 1.37 | 27 | 15 | 10.4 | 4.2 | 9 | −0.84 | 1.18 | −5.0 | 3.9 | B0 III neb | A | Sh2–255 |
| 45 | 12.59 | 1.48 | 1.11 | 1.17 | 11 | 2 | 37.8 | 2.8 | 10 | −0.71 | 0.49 | −2.9 | 6.2 | B1.5 V | A | D07, Bochum 1 |
| 48 | 12.58 | 2.71 | 2.25 | 2.95 | 81 | 7 | 40.3 | 4.8 | 10 | −0.73 | 0.57 | −3.1 | 6.0 | B2 V | A | Bochum 1 |
| 53 | 12.04 | 1.73 | 1.63 | 1.66 | 38 | 6 | ... | ... | ... | −0.82 | 0.57 | −3.9 | 6.8 | B1 V | A | SB2?, Bochum 1 |
| 54 | 12.50 | 3.66 | 3.92 | 3.41 | 126 | 27 | 38.5 | 7.3 | 8 | −0.64 | 0.51 | −2.3 | 4.5 | B2 V | A | Bochum 1 |
| 86 | 11.35 | 1.10 | 0.96 | 0.95 | 4 | 4 | ... | ... | ... | −0.88 | 0.50 | −4.4 | 7.0 | B0.5 V | A | Sh2–289 |
| 208 | 11.56 | 1.45 | 1.18 | 1.23 | 12 | 5 | 74.8 | 3.6 | 10 | −0.78 | 0.48 | −4.5 | 8.1 | B1 III | A | Sh2–301 |
| 212 | 12.08 | 4.66 | 5.70 | 5.24 | 208 | 32 | 82.8 | 10.6 | 8 | −0.71 | 0.50 | −2.9 | 4.8 | B1 V | A | D07, Sh2–301 |
Only a portion of this table is shown here to demonstrate its form and content. Machine-readable and Virtual Observatory (VOT) versions of the full table are available.
Download table as: Machine-readable (MRT)Virtual Observatory (VOT)Typeset image
He i 4026:
He i 4388:
He i 4471:
All of the star designations, observed parameters, and derived quantities are listed in Table 1: column 1, their number in the ALS catalog (Reed 2003); column 2, their apparent V magnitude; columns 3–5, the measured line FWHMs discussed above; columns 6 and 7, the average v sin i and error; columns 8–10, the radial velocity, error, and number of lines measured; column 11, the reddening free quantity Q; column 12, the color excess  ; column 13, the absolute V magnitude used to compute the photometric distance in column 14; column 15, the spectral type found in the literature; and column 16, the classification as Cluster (C), Association (A), or Field (F), as described in Section 3.1. Remarks about Hα emission, suspected binary stars, and membership in an association or cluster are found in column 17.
A subset of eight stars included in this study were previously observed in a study of v sin i by Daflon et al. (2007): they are indicated in Table 1, column 17 as D07. Additionally, six of our stars were observed by Huang & Gies (2006), who derived v sin i values: they are indicated as HG06. A comparison of our results with these published values is shown in Figure 3. It is worth remarking that the largest outlier from the one-to-one relationship in Figure 3, ALS 15340 with v sin i of 102 km s−1, was noted by HG06 to be a SB1. Both HG06 and this work note Hα emission. None of the other stars shown in Figure 3 are suspected of being binary systems in the literature.
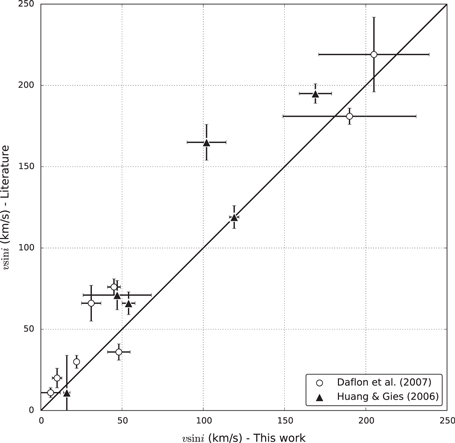
Figure 3. Comparison of v sin i from the literature with our values. The solid line shows the one-to-one relationship.
Download figure:
Standard image High-resolution image2.2. Spectroscopic Binaries, Radial Velocities, and Emission Line Stars
As would be expected, some stars show evidence of double lines or line profiles that suggest the star is a binary. For completeness, these stars are listed in Table 1 with a notation in column 17, though no values for v sin i are given. Sample spectra of the stars with clear double lines are shown in Figure 4.
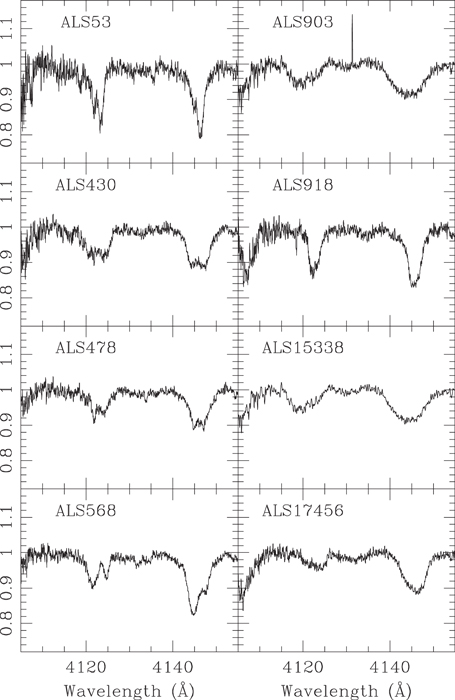
Figure 4. Stars with apparently double lines.
Download figure:
Standard image High-resolution imageAlthough spectra were only taken at a single epoch, the measured heliocentric radial velocities of the apparently single stars may be useful in future dynamical studies or to establish binarity.
There are also 18 stars that show noticable Hα emission, indicated with a remark in column 18. Hα line profiles for these candidate Be stars show a range of morphology, as shown in Figure 5.
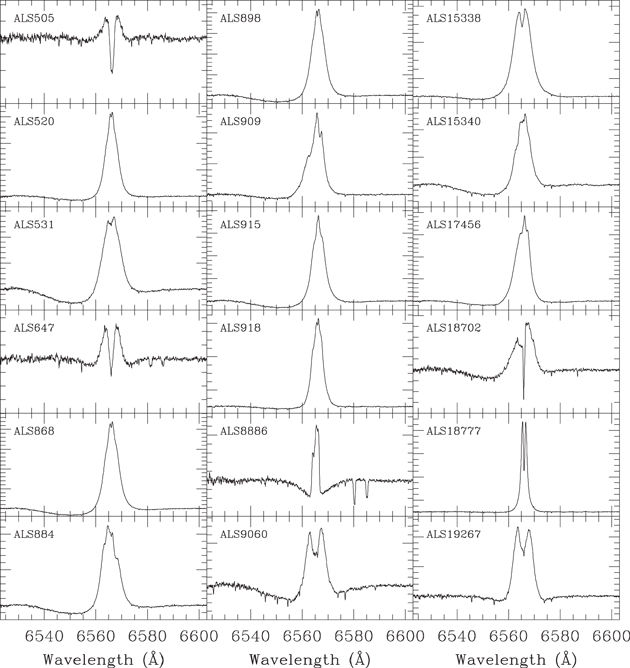
Figure 5. Spectra at Hα for candidate Be stars. Vertical scales are adjusted to show the peak to minimum.
Download figure:
Standard image High-resolution image3. ANALYSIS AND DISCUSSION
3.1. Stellar Environment
Previous work has shown that v sin i appears to depend on the stellar environment, and, in particular, that on average v sin i is lower for field stars as compared with stars in clusters or associations (Wolff et al. 2007). With no new kinematic data available to address this, we have searched the literature to find the classification arrived at by previous authors. Classifying a particular star as a cluster or association member within the Milky Way Galaxy is non-trivial. In many cases in the literature stars have been assigned membership in open clusters or associations based solely on photometry, much of which was done many decades ago. While the existence of the entire cluster is clear, the membership of any particular star can be much less certain.
We performed a literature search using SIMBAD for each star and then checked the references to determine what was known about the association or cluster membership. This was straightforward for stars for which the literature search indicated cluster membership. However, associations and field stars are more difficult. For example, we observed 13 stars that had been observed by Fitzgerald & Moffat (1980) in the vicinity of the putative open cluster NGC 2414, and which they identified as a new association, "association NGC 2414" at a distance of 4.2 kpc. Their color–magnitude diagram for the proposed association members is poorly defined. Our photometric distances for these 13 stars average 5.0 kpc, but the individual distance estimates range from 3.5 to 6.6 kpc. We have listed these stars as field stars. Twenty-three of the stars we observed are located in H ii regions first discussed by Sharpless (1959): in most of these examples the distance of the H ii region is based on the spectroscopic distance of just a few stars presumed to be exciting the H ii region. We have classified these Sharpless region stars as association members unless there existed later studies of the star in question.
3.2.
 Distributions

An early study by Deutsch (1970) demonstrated that, for a limited sample of field B-stars, Maxwellian distributions can reasonably represent the observed projected rotational velocities. Subsequent work by a variety of researchers indicates that other statistical distributions could fit the data better if the sample sizes are large enough, but there is no a priori knowledge of the true shape of the underlying distribution function. Given the limited sample size in our study, Maxwellian distributions are adequate for making qualitative comparisons, especially when the data are divided into small subsamples. In the discussion that follows, the distributions of the subsamples were each fit with two Maxwellian functions representing sharp-lined and broad-lined components. The bi-modal Maxwellian distributions are defined by the two values of the mode parameter and the relative fraction of the two data sets being modeled. Artificial histograms were generated having the same total number of objects as the observed data, and the modes and relative frequencies of the two functions were varied to minimize the differences between the artificial and the observed distributions in the least-squares sense. The choice of histogram bin sizes is limited by the relatively small size of the subsamples: after some experimentation, 50 km s−1seemed like the most reasonable choice.
Figure 6 shows comparisons of the distributions of the combined data of "Field" B0-B2-type stars with luminosity classes V–IV from this work plus GB2012 to the distribution for B0-B2-type stars in the Bright Star Catalog observed by Abt et al. (2002, hereinafter ALG02) plus Levato & Grosso (2013, hereinafter LG13). The fitted bimodal Maxwellian distributions are nearly identical, each showing a significant fraction of slow rotators. This gives added support to the idea that there are multiple mechanisms producing Field B-type stars. Note that a large number of evolved and binary stars in GB2012 were excluded from the analysis. Although we excluded from the analysis objects with luminosities of class III or higher, little is known about binarity for our targets and its impact on the distributions. ALG02 argued that the inclusion of close binaries would have little effect on the distributions; however, Langer (2012) argues that there are theoretical considerations that predict that the projected rotational velocities of massive main-sequence stars can be strongly affected by the presence of a close companion. The same is true for stars with strong magnetic fields (e.g., Stepién 2002). Because the fraction of massive close binaries is large (e.g., Sana et al. 2012) and because magnetic fields seem to be ubiquitous among B-type stars (Langer 2012), binarity and magnetic fields could, in principle, affect the distributions derived here.
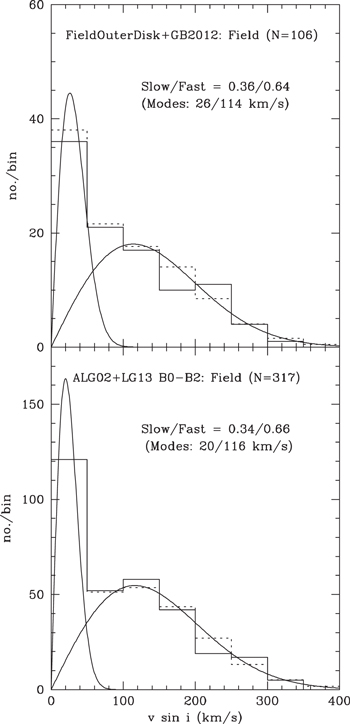
Figure 6. Comparison of distributions for B0–B2, class V and IV stars combined from this paper and GB2012 in the appropriate range of Q and classified as Field stars, compared to the v sin i distributions for Field B0–B2 stars from ALG02 plus LG13. The Maxwellian bimodal fits have modes of 26 and 114 km s−1for the former objects and 20 and 116 km s−1 for the latter.
Download figure:
Standard image High-resolution imageFigure 7 shows the plots of the v sin i distributions for our three groupings ("Cluster," "Association," and "Field," as defined above) of stars having luminosities of class IV or V described in the preceding section, along with the bimodal Maxwellian fits to each. Since Figure 6 shows that the distributions for the Field star subgroup is very similar to the distributions of objects from ALG02 and LG13, we adopted the averages of the modes shown in Figures 6, 23, and 116 km s−1, to fit the three subgroup distributions. Only the relative fraction of the two Maxwellian distributions was varied to best fit the data. The relative fractions of the low v sin i component, 32%, 44%, and 18% for the Field, Association, and Cluster subsets, respectively, are consistent with earlier studies of early B-type stars that found large fractions of slow rotators in the Field and large fractions of rapid rotators in Clusters.

Figure 7. Bimodal Maxwellian v sin i distribution fits to the Cluster, Association, and Field subsets for only main-sequence (luminosity class IV and V) stars from this study using fixed modes of 23 and 116 km s−1. Only the relative fractions of the two distributions were varied to fit the histograms. Solid lines: histograms of the observed v sin i's. Dashed lines: histograms of the computed bi-modal distributions. The underlying continuous Maxwellian distributions are also shown.
Download figure:
Standard image High-resolution image
Independent of the Maxwellian fits, a relative comparison of the observed distributions using a Kolmogoroff–Smirnoff test give probabilities of 0.34 and 0.25 that the "Cluster" v sin i's come from the same population as the "Field" and "Association" objects, respectively. The same comparison gives a probability of 0.87 that the "Field" and "Association" stars come from the same population. Note that neglecting gravity darkening would underestimate the values of the largest v sin i 's (see Frémat et al. 2005) but would not explain the large fraction of slow rotators.
4. CONCLUSIONS
We have determined values of v sin i from echelle spectra of 136 early B-type stars in the outer disk of the Milky Way. Based on a literature search, we separated these stars into Field, Association, or Cluster and find a correlation consistent with low v sin i for field stars compared with cluster stars. Fits with two-component Maxwellian velocity distributions yield slow-rotator contributions of 32%, 44%, and 18% for in the Field, Association, and Cluster subsets, respectively. It remains unclear whether this trend is due to the stellar natal environment or evolutionary effects. A number of possible double-lined binaries and candidate Be stars, as well as the measured radial velocities, are presented, which might be of interest for additional work.
This paper includes data gathered with the 6.5 m Magellan Telescopes located at the Las Campanas Observatory, Chile. M.S.O. and T.B. acknowledge financial support from the National Science Foundation (AST-0448900) and M.S.O. thanks NOAO for support and hospitality during an extended visit. G.A.B. acknowledges Coordenação de Aperfeiçoamento de Pessoal de Nível Superior (CAPES—Brazil) for his fellowship. C.D.G. and J.W.G. are thankful that this is finished, and that our marriage is still intact. This research has made use of the SIMBAD database, operated at CDS, Strasbourg, France. Extensive use was also made of IRAF routines (http://iraf.noao.edu). We sincerely thank the anonymous referee for thoughtful and very helpful comments that improved the paper greatly.
Facility: Magellan: Clay -