

ABSTRACT
Dome C, Antarctica, (75° south, 123° east, 3250 m) is one of the coldest and driest locations on Earth, with exceptionally low winds throughout the atmosphere. It therefore has the potential to be an ideal site for astronomical observations. It is also an excellent site for the validation of satellite instruments. A Fourier transform infrared interferometer was deployed at Dome C during two austral summer seasons (2003 January and 2003 December/2004 January) for the purpose of acquiring satellite validation data. However, these data are also useful for understanding the infrared characteristics of the atmosphere for future astronomical experiments at Dome C. The Polar Atmospheric Emitted Radiance Interferometer measured the downwelling infrared radiance from the atmosphere (sky brightness) from 3 to 20 μm. Over 100 radiosondes were also launched during this time period. Typical measured values of the sky brightness in the clearest portions of the M, N, and Q bands are 0.9, 43, and 310 Jy arcsec−2, respectively. The lowest measured values of sky brightness within these bands are 0.4, 34, and 200 Jy arcsec−2. The spectral region of the Q band from about 18.7 to 19 μm is expected to be an excellent window for observations made from the Antarctic Plateau. The sky brightness has been measured between 10.60 and 11.30 μm in the N band for comparisons to earlier studies at South Pole Station; the values in this band are similar to those in the 8.20–8.40 μm band. For the period of time covered by our observations, the sky brightness in the dark portions of the N band was less than about 50–60 Jy arcsec−2 for about 10% of the time, and less than about 75 Jy arcsec−2 for about 50% of the time. During a 5 day period of clear skies, the mean sky brightness was 47.7 Jy arcsec−2, with a variation about this mean of 4.4 Jy arcsec−2 (1 σ). Calculations of the summertime atmospheric transmission under clear skies over Dome C show that portions of the M, N, and Q bands have transmission greater than 95%, with some spectral regions greater than 99%.
Export citation and abstract BibTeX RIS
1. INTRODUCTION
The Antarctic Plateau has previously been shown to be one of the best locations on Earth for making astronomical measurements. Most astronomical research on the plateau is currently being carried out at Amundsen‐Scott South Pole Station (90° south, 2835 m). Previous site‐testing experiments have documented the clarity and stability of atmospheric conditions for optical and infrared astronomy at South Pole (e.g., Ashley et al. 1996; Nguyen et al. 1996; Smith & Harper 1998; Fowler et al. 1998; Phillips et al. 1999; Chamberlain et al. 2000; Travouillon et al. 2003). Lawrence (2004) has also reported results of theoretical modeling of the sky brightness and atmospheric transmission at high‐altitude Antarctic sites.1
Dome C (75° south, 123° east, 3250 m) is the site of a relatively new station, Concordia Station, that is being constructed by the French (Institut Paul Emile Victor [IPEV]) and Italian (Programma Nazionale di Richerche in Antartide [PNRA]) Antarctic programs. It has the potential to offer some advantages over South Pole Station for certain types of observations, because it is located at higher elevation and sits on a topographic dome, which reduces the magnitude of gravity‐driven inversion winds. Among the most important atmospheric parameters for astronomy are the temperature structure, water vapor content, stability of the sky emission, and the optical thickness of near‐surface ice crystals (sometimes called radiative fog [Chamberlain et al. 2000], aerosols, ice fog, or diamond‐dust ice crystals [Walden et al. 2003]). Atmospheric stability increases as the wind speed decreases, so it is advantageous to construct observatories in areas with minimal wind. Recent measurements of wind speeds over Dome C (Aristidi et al. 2005) indicate that more favorable wind conditions exist at Dome C than at South Pole. A high‐latitude site is also desirable to minimize atmospheric absorption and thermal emission. Schwerdtfeger (1984) has shown that altitude correlates negatively with surface temperature over the East Antarctic Plateau. Thus, because Dome C is located higher on the Antarctic Plateau, the mean near‐surface atmospheric temperature is lower than at South Pole. One potential disadvantage of Dome C is the diurnal cycle (absent at South Pole), which during the summer can cause the creation of hydrometeors (in this case, supercooled water droplets and/or ice crystals) in the near‐surface air layer in the "late evening." As the solar zenith angle reaches its maximum value each day, the surface temperature decreases rapidly, causing a strong near‐surface temperature inversion to form. This then can result in saturated conditions with respect to water and ice and possibly lead to hydrometeor formation. The presence of hydrometeors near the surface degrades astronomical observations.
During two austral summers (2003 January and 2003 December/2004 January), the University of Idaho performed field work at Dome C for the validation of the Atmospheric Infrared Sounder aboard NASA's Earth Observing System "Aqua" satellite. Dome C is an ideal site for satellite validation, because the large continental ice sheet is one of the most homogeneous land surfaces on Earth in terms of surface temperature and infrared emissivity. Surface‐based measurements between 8 and 12 μm of upwelling infrared radiation from the snow are very nearly equal to those measured by satellite instruments, because of minimal atmospheric absorption and emission. Therefore, accurate measurements of spectral infrared radiance made at the surface can provide valuable validation data at the top of the atmosphere for satellite instruments. For this same reason, Dome C is also an excellent site for astronomical experiments.
This paper describes spectral infrared measurements of sky brightness obtained during the austral summer at Dome C. The measurements reveal the usual atmospheric windows that are relatively free from water vapor emission lines. The values of sky brightness in these bands are presented for comparison to other ground‐based astronomical sites, in particular South Pole Station. The percentage of clear‐sky conditions is determined using different thresholds. In addition, the stability of the sky is determined by examining the variation of sky brightness over a 5 day period of clear conditions. Radiative transfer calculations of atmospheric transmission at fine spectral resolution are given for Dome C in summer to illustrate portions of the infrared spectrum that are useful for infrared astronomy.
2. INSTRUMENTATION AND MODELS
2.1. Polar Atmospheric Emitted Radiance Interferometer (PAERI)
The PAERI was used in this study to measure downwelling radiance from the atmosphere. The Polar AERI is a member of a group of AERI instruments developed by the Space Science and g Center at the University of Wisconsin‐Madison for the US Department of Energy's Atmospheric Radiation Measurement program (Knuteson et al. 2004a, 2004b).
The PAERI was operated at Dome C from 2003 January 13 to 29 and again from 2003 December 21 to 2004 January 25. The 17 days in 2003 January were unusually cloudy, with only about 4 or 5 days of clear‐sky conditions. The second field season had a higher percentage of clear skies, with about 14 to 15 days of clear‐sky conditions out of the 36 days of PAERI observations. The PAERI was operated on a tower and was 6 m above the snow surface in 2003 January and 24 m above the surface in 2003 December/2004 January.
The PAERI measures infrared radiance from 3 to 20 μm at a resolution of 1 cm−1. All the PAERI observations used in this study are from the zenith direction, directly above the instrument. Various viewing schedules were used throughout both field seasons, but the PAERI typically viewed at zenith about every 10 to 12 minutes. (The frequency of zenith measurements depends on how many different angles the PAERI is viewing during a sequence and how long the instrument views each angle.) The PAERI field of view (full width at half‐angle) is 2  6 (Knuteson et al. 2004a).
The PAERI measures infrared radiance in two bands: a shortwave band from 3 to 5.5 μm and a longwave band from 5.5 to 20 μm. The instrument uses a "sandwich" indium antimonide (shortwave) and mercury cadmium telluride (longwave) detector that is cooled to either 68 or 78 K by a Stirling‐cycle cooler; a detector temperature of 78 K was used during the first field season, while 68 K was used during the second. The PAERI interferometer has a fine spectral resolution, with a resolving power between about 500 at 20 μm and 3000 at 3 μm.
Figure 1 shows examples of PAERI measurements of the spectral sky brightness under clear and cloudy sky conditions. The upper solid line shows the sky brightness under a thick cloud, which results in a radiation curve similar to a Planck function at the temperature of the cloud. The lower solid line shows the sky brightness under clear skies. The spectral regions that are most useful for astronomical observations have low radiance values and represent the portions of the atmosphere with the least emission. The long‐ and shortwave channels of the PAERI are both shown, separated by the vertical dashed line. The radiance values are extremely low, around 4.6, 8.3, 10.5, and 19 μm in the clear‐sky spectrum. These portions of the infrared sky brightness represent some of the clearest spectral regions for astronomical observations. The traditional spectral ranges of the M, N, and Q bands are shown along the top of Figure 1. The extremely cold and dry atmosphere over the Antarctic Plateau has semitransparent spectral regions in the Q band, which are clearly visible at wavelengths greater than 17 μm. Figure 1 shows that the PAERI bandwidth includes the clearest portions of the Q band; the sky brightness increases as the wavelength increases beyond about 19 μm, because of the increasing contribution from the water vapor rotational band, which becomes fairly opaque between 30 and 50 μm.
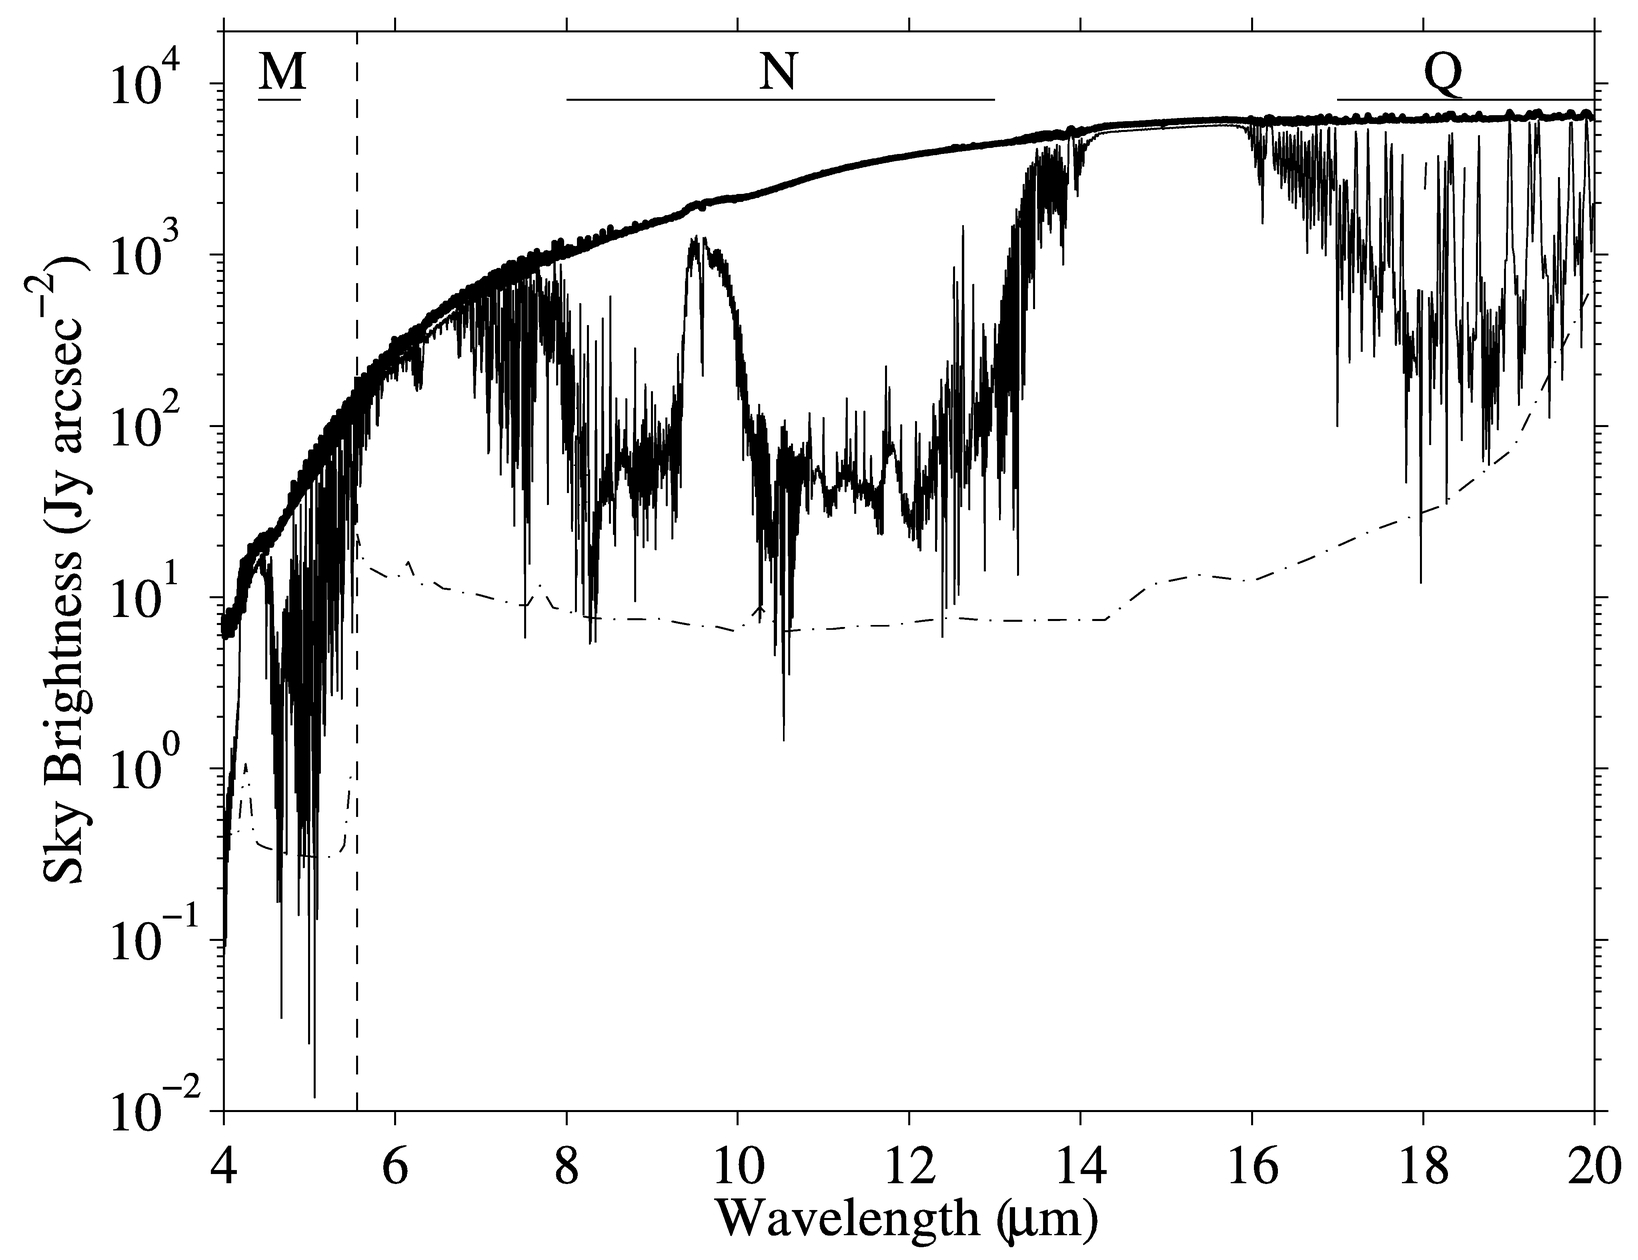
Fig. 1.— Downwelling infrared sky brightness measured by the PAERI at Dome C, Antarctica. The upper solid line was measured under a thick cloud cover on 2004 January 2. The lower solid line was measured under clear‐sky conditions on 2004 January 15 and is an average of 53 measurements over a period of about 10 hr. The dash‐dotted line shows the NESR for the clear‐sky spectrum; the NESR for the cloudy case is similar.
Also shown in Figure 1 are estimates of the noise equivalent spectral radiance (NESR; dash‐dotted line) for both detector channels. The NESR is discussed in detail by Knuteson et al. (2004b) and is based on 2 minute observations of a stable, hot calibration source. Figure 1 shows that the NESR is about 0.3–0.4 Jy arcsec−2 in the shortwave channel. In the longwave channel, the NESR is about 8–10 Jy arcsec−2 throughout the N band and increases to about 30–100 Jy arcsec−2 in the clearest portions of the Q band. The shape of the NESR in both channels is determined by the spectral characteristics of the detectors and the interferometer's optics. The noise is much lower in the shortwave channel than in the longwave, because the InSb detector is much more sensitive than the MCT detector. However, in both channels, the NESR is well below the measured signal of the sky brightness. The overall accuracy of the PAERI data is approximately twice that of the NESR when uncertainties in the temperature and emissivity of the calibration sources are accounted for (see Knuteson et al. 2004b for estimates of these uncertainties).
2.2. PAERI Calibration
When measuring the infrared sky brightness over Antarctica, it is important to use an instrument that is calibrated accurately, because of the extremely low radiance values in the atmospheric window regions. The overall accuracy of AERI instruments, such as the PAERI, is discussed in detail by Knuteson et al. (2004b) and is stated as 1% (3 σ) of ambient radiance. The PAERI uses measurements of two infrared sources (one hot and one ambient) to calibrate a third measurement. The emissivity of the infrared sources is greater than 0.990, and the temperature of each source is controlled to better than ±0.03 K (Knuteson et al. 2004b). The temperature of each source is characterized by three thermistors that are traceable to temperature standards at the National Institute of Standards and Technology.
Two calibration checks were performed at Dome C during each field season. Each of these checks was performed with three calibration sources, and two of the calibration sources (hot and ambient) were used to calibrate a third source at an intermediate temperature. The calibrated radiance of the intermediate source is compared with the expected theoretical radiance, which is calculated using the measured temperature and emissivity of the intermediate source. One test was performed inside our research building, with the intermediate calibration source at 317 K, while the other test was performed outside, with the source at 253 K. The difference between the actual calibrated radiance and the expected theoretical radiance is less than 1% in all cases, as expected from Knuteson et al. (2004b).
2.3. Radiosondes
In addition to the PAERI operations, over 100 Vaisala radiosondes (RS80‐15 GH and RS90) were launched in collaboration with the astrophysics group at the University of Nice. About 30 of these sondes were launched under clear‐sky conditions. Radiosondes measure profiles of temperature and relative humidity, in addition to wind speed and direction, as a function of atmospheric pressure. The sonde data are used to construct model atmospheres for use in radiative transfer modeling (discussed below). Vaisala reports that the temperatures are accurate to 0.1–0.2 K and that the relative humidity values with respect to water (RHw) are accurate to ±3%. The RHw values are somewhat uncertain, because of the long response times (minutes) of radiosonde humidity sensors at low temperatures. However, Hudson et al. (2004) have recently shown that Vaisala RS80 radiosondes can measure temperature, pressure, and humidity accurately in Antarctica if the sensors are properly equilibrated to ambient conditions before launch. (Vaisala RS‐80 GH and RS90 sondes use the same humidity sensor. However, the RS90 sondes use two sensors that are successively heated to prevent the accretion of frost.) Therefore, the sondes launched in 2003 January were equilibrated for at least 10 minutes outside in ambient conditions before being launched. In addition, the sondes were prepared in a tent structure that was near freezing and was, therefore, only 20–25 K above the ambient outside temperature; the absolute humidity inside the tent was probably quite similar to the humidity outside. The RS90 sondes launched during the second field season were stored and prepared for launch outside, at ambient temperatures.
2.4. Visual Observations
Visual observations were made multiple times each day and when the sky conditions were changing. Clear‐sky ice crystal precipitation (diamond dust, ice haze) was only visually observed a few times during both field seasons. There were occasional observations of radiation fog just above the surface, forming in the late evening and early morning hours. These fogs were always composed of supercooled water droplets, as evidenced by riming on the tower (S. R. Hudson 2004, private communication). During the two field seasons, the radiation fog was only observed in January, not December, probably because of the lower surface temperatures in January. The percentage of time that radiation fog occurred in January is estimated to be about 8%; it occurred on eight occasions for about 6–8 hr each time. Aerosols from station pollution were not present over the field site where the infrared measurements were made, because the site was located about 1 km from the main station and was not downwind of the station's power generator.
2.5. Radiative Transfer Modeling
The transmission calculations presented below were generated using the line‐by‐line radiative transfer model (LBLRTM) described by Clough & Iacono (1995). The input to this model is similar to the more widely used model MODTRAN. A model atmosphere is constructed, consisting of temperature and gaseous constituent profiles. The gases included here are carbon dioxide, water vapor, ozone, carbon monoxide, nitrous oxide, and chlorofluorocarbons (CFCs; CFC11 and CFC12). The surface values of carbon dioxide, carbon monoxide, nitrous oxide, and the CFCs come from measurements made by NOAA's Climate Monitoring and Diagnostics Laboratory at South Pole Station. The profiles of these gases are similar to those described by Walden et al. (1998).
3. OBSERVATIONAL RESULTS
3.1. Sky Brightness
Four spectral bands are defined in Table 1 that will be used in this paper. Each of these bands is considered a "dark band," because they encompass spectral regions that are relatively free of gaseous emission and absorption. The M'', N'', and Q'' bands were chosen because they have the lowest values of sky brightness in the wider M, N, and Q bands traditionally used by astronomers. The N' and N'' bands are used here because these particular bands have been used in other studies of Antarctic sky brightness (Chamberlain et al. 2000). Table 1 also shows how many PAERI wavelengths are averaged within each of these bands.
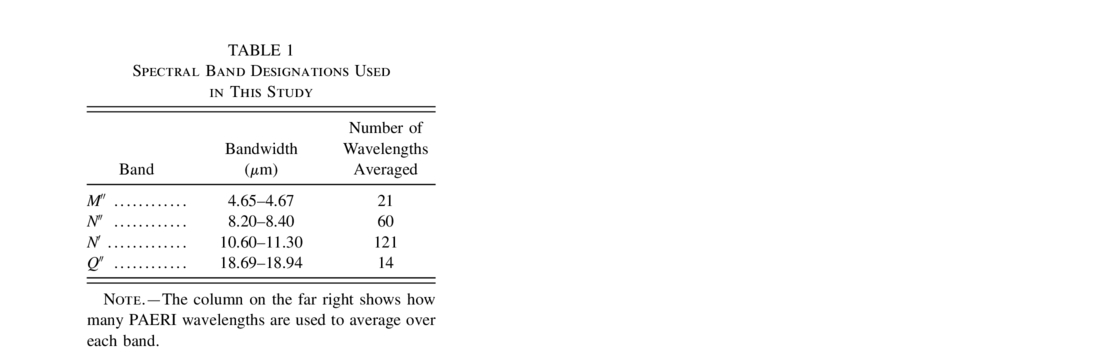 |
Figure 2 shows time series of the sky brightness in the N' band throughout the two field seasons in 2003 January and 2003 December/2004 January. Higher values of sky brightness are indicative of cloud cover, while the lowest values denote clear skies (see Fig. 1). Figure 2 shows that the second half of 2003 January was quite cloudy, with few time periods of completely clear skies, while 2003 December and 2004 January had significant periods of clear‐sky conditions. Figure 3 shows the time period between 2004 January 12 and 17 in more detail. The values of sky brightness for this band are between about 40 and 60 Jy arcsec−2 under clear‐sky conditions. In addition, a diurnal cycle is present, with peak values of sky brightness occurring around noon (local time). This spectral band (N') contains several strong water vapor emission lines (visible in the fine‐resolution PAERI spectra), the strength of which are modulated by fluctuations in the near‐surface temperature and humidity. The temperature structure near the surface changes significantly throughout the day as the zenith angle of the Sun changes. The solar zenith angle during this time period varied from about 53° at noon to 84° at midnight (local time), with corresponding changes in the surface temperatures (under clear skies) of roughly −20°C to −40°C. It is much more difficult to measure changes in the actual humidity of the near‐surface air, but the existence of radiation fog at times indicates that the relative humidity increases when the solar zenith angle is large. It is possible that water vapor is sublimated from the surface to the atmosphere during the part of the day when the solar zenith angle is near its minimum.
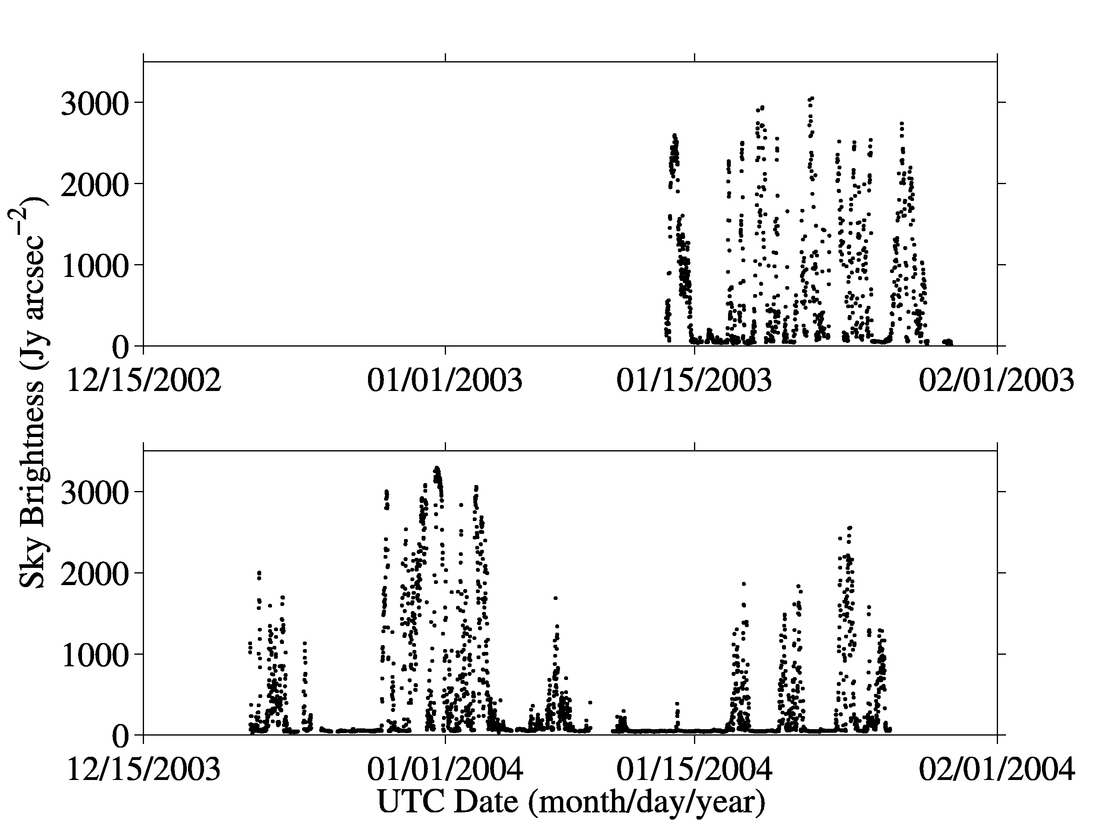
Fig. 2.— Time series of sky brightness in the N' band (10.6–11.3 μm) for the duration of the two field seasons at Dome C, Antarctica.
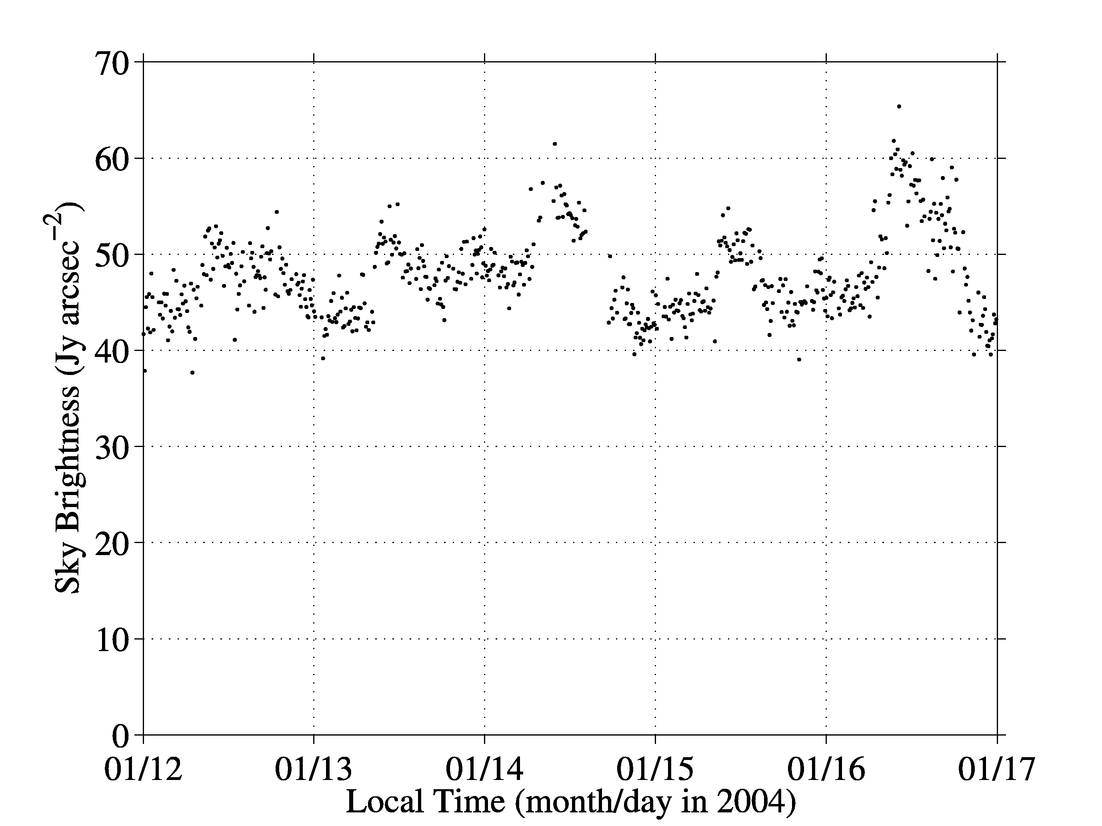
Fig. 3.— Time series of sky brightness in the N' band (10.6 to 11.3 μm) during a multiday period of clear‐sky conditions, showing a diurnal cycle. The tick marks represent the beginning of each day.
Figure 4 shows histograms of the sky brightness in each of the four spectral bands. Each histogram has a single peak at low values of sky brightness, with a long tail toward higher brightness values. These distributions from Dome C are not bimodal, as are those reported by Chamberlain et al. (2000) for the South Pole. This indicates that during the summer at Dome C, a wide range of cloud optical depths can exist, and a continuum of atmospheric opacities can occur, from very clear skies to thick, overcast conditions.
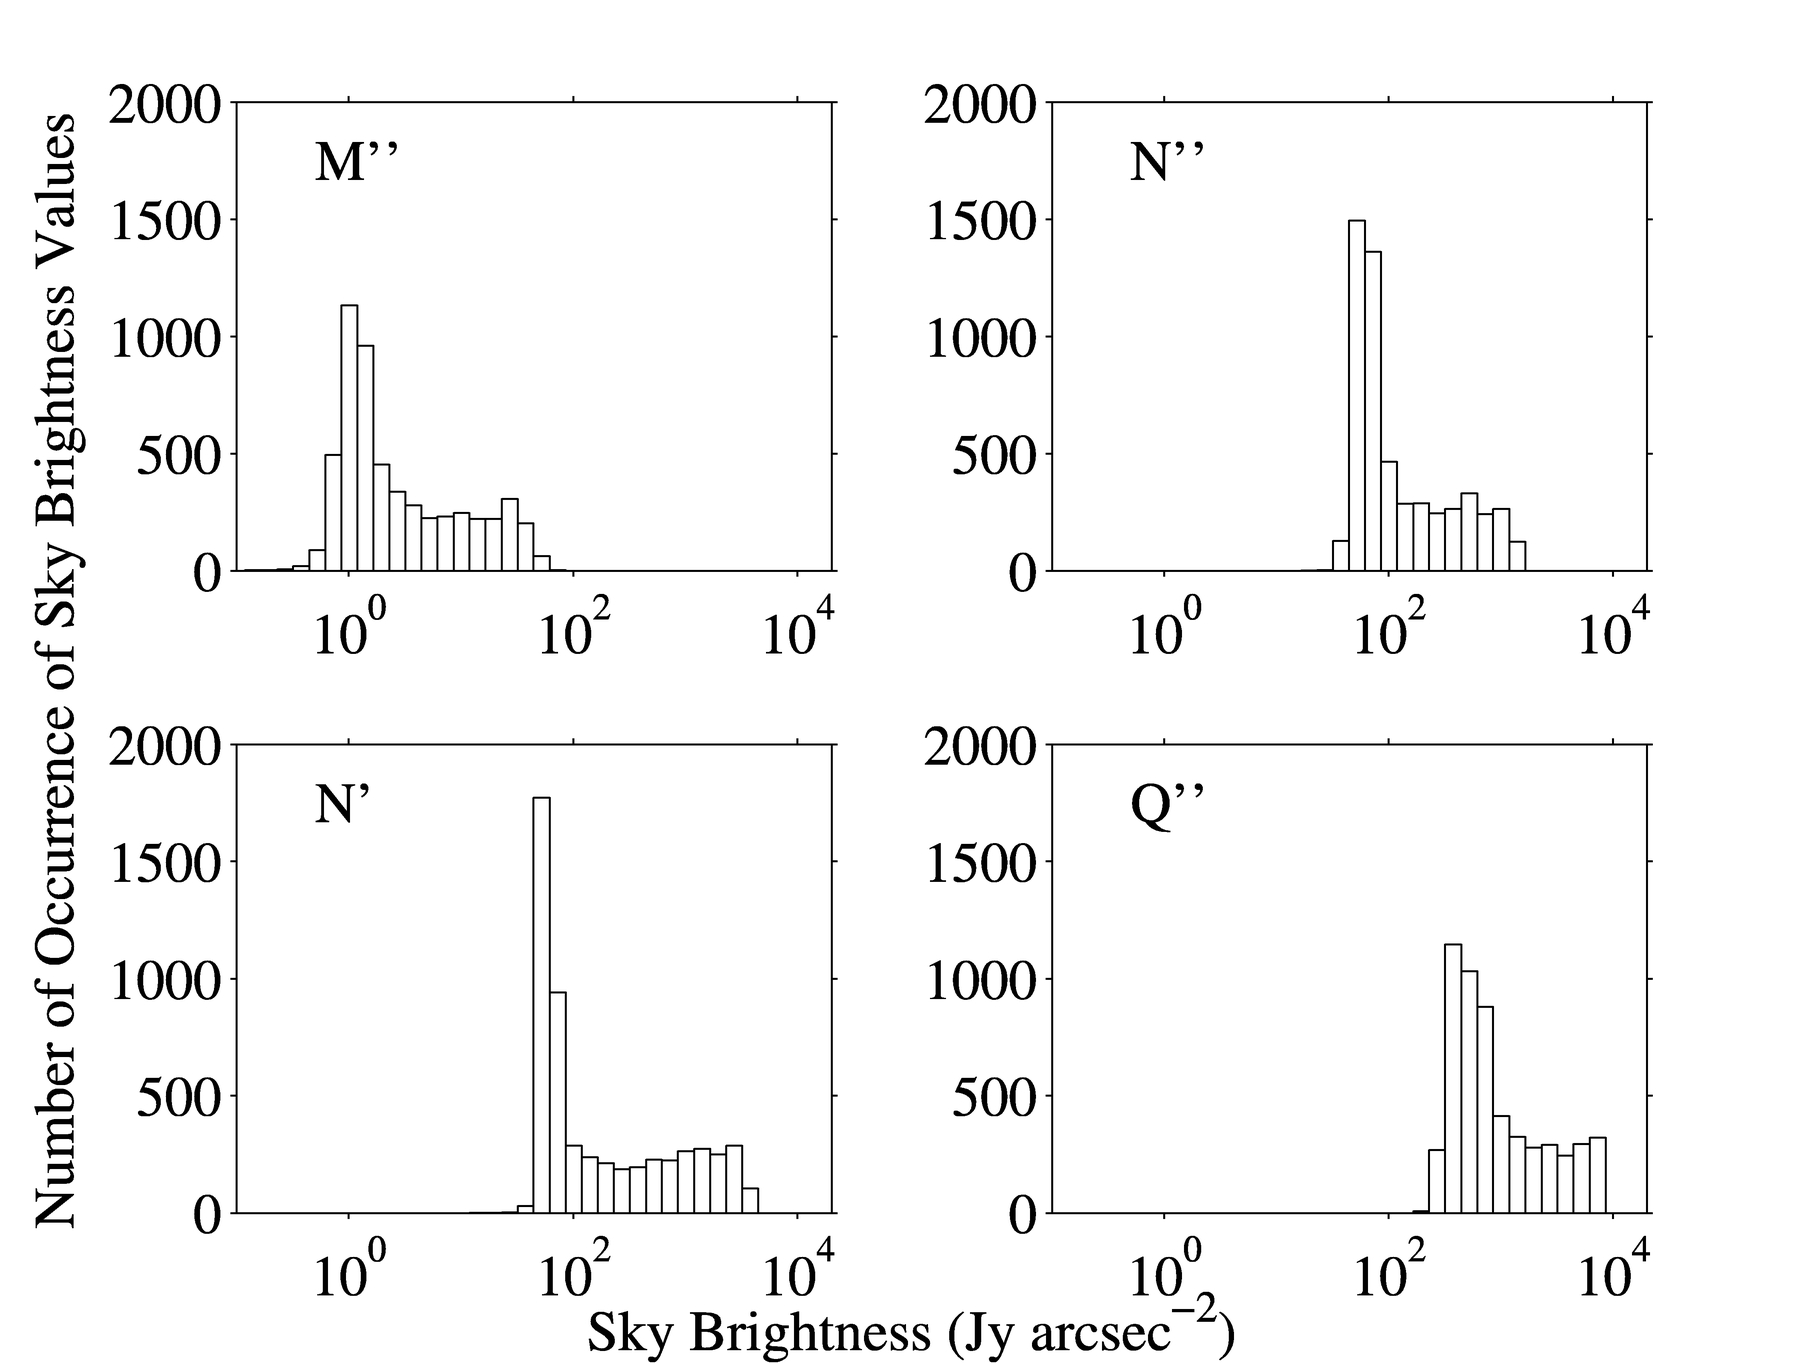
Fig. 4.— Histograms of sky brightness in the M'', N'', N', and Q'' bands. The measurements were made with PAERI during two field seasons at Dome C, Antarctica (2003 January and 2003 December/2004 January).
The histograms also give estimates of the sky brightness in each of the bands under clear skies. Table 2 shows the mode (most probable value), median, and minimum values of the distribution of sky brightness for each band. The distributions shown here, and thus the values shown in Table 2, do not necessarily represent climatological conditions at Dome C, but rather only the conditions during our two field seasons.
 |
As expected from the shape of the Planck curve, the M'' band has the lowest brightness levels. Values of around 1 Jy arcsec−2 are comparable to those measured at South Pole Station in winter by Phillips et al. (1999). The values in the N' and N'' bands are slightly higher than those reported by Chamberlain et al. (2000), but range from about 30 to 50 Jy arcsec−2 for clear‐sky conditions. The values in the Q'' band vary from about 200 to 300 Jy arcsec−2 under clear skies. These values are much lower than those reported by Smith & Harper (1998), because their results were centered on a band around 17 μm, which is much more opaque than the band reported here (18.69–18.94 μm). In fact, the Q'' band as defined here appears to be an optimal spectral region for astronomical observations, because it lies between the emission band of carbon dioxide (centered at 15 μm) and the emergence of the water vapor rotational band at wavelengths longer than 20 μm. It is also worth noting that the important fine‐structure line of [S iii] at 18.71 μm lies in a portion of this window that is particularly clear at Dome C.
3.2. "Clear Sky" Determination
In addition to knowing how clear the sky can be, it is also important to know how often the sky is clear. The determination of "clear sky" conditions is difficult over the Antarctic Plateau, because of precipitation that can occur in an otherwise "clear sky." Chamberlain et al. (2000) have reported that the N‐band sky brightness in winter is limited not by emission from water vapor, but rather by atmospheric aerosols. Although we show evidence here of a slight diurnal cycle in sky brightness, the presence of any ice crystals or supercooled liquid water droplets (fog) can greatly increase the atmospheric opacity.
By examining PAERI data during the few visual observations of clear‐sky ice crystal precipitation, it was determined that when a human observer begins to visually detect ice crystals in the near‐surface air, the N'' band sky brightness is about 50 to 70 Jy arcsec−2. This result was confirmed by calculating "clear sky" brightness thresholds, using the radiance‐ratio method described by Town et al. (2005). This method computes the ratio of the integrated sky brightness (over the bandwidth of the PAERI longwave detector), divided by the integrated Planck function of the near‐surface air temperature (as determined from the brightness temperature between 15.6 and 15.9 μm, a region that contains strongly emitting carbon dioxide lines). The ratio is low (perhaps 0.3 to 0.4) when the sky is clear and when the sky brightness is small compared to a Planck function of the near‐surface air temperature. The ratio is close to unity when the sky is cloudy and the sky brightness is nearly equal to that of the Planck function.
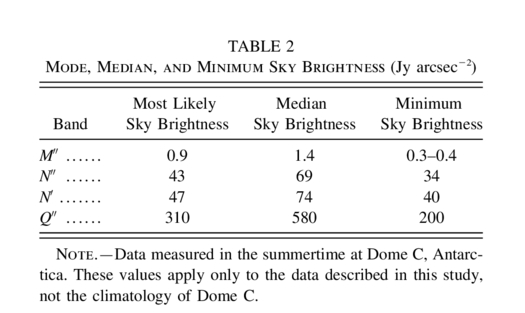
Here we determine three different thresholds for a "clear sky." First, we calculate the sky brightness at zenith, using only the average temperature and humidity profiles from radiosondes launched at Dome C under exclusively clear‐sky conditions. The radiance‐ratio method then provides a threshold. This "clear‐sky threshold" represents our most stringent criterion for truly clear‐sky conditions. The second threshold again calculates the zenith sky brightness, but uses the average temperature and humidity profiles from all of the radiosondes launched at Dome C. This is called the "all‐sky threshold." The clear‐sky and all‐sky temperature and humidity profiles are shown in Figure 5. The primary difference between the two cases is near the surface, where the clear‐sky temperature profile has a lower temperature because of the presence of a stronger temperature inversion under clear skies. In addition, the relative humidity (with respect to ice) is nearly saturated near the surface for the clear‐sky case.
Fig. 5.— Profiles of temperature and relative humidity with respect to ice for clear‐sky and all‐sky conditions at Dome C, averaged for the austral summer months of 2003 January, 2003 December, and 2004 January. The precipitable water vapor is 1.1 mm for the clear‐sky profile and 1.2 mm for the all‐sky profile.
The third threshold uses the calculation from the all‐sky threshold, but adds radiance to account for atmospheric hydrometeors, such as ice haze and radiation fog. We approximated this thin cloud as having a temperature of 250 K and an emissivity of 0.05, which was justified by fitting an actual PAERI measurement observed during ice‐haze conditions. This threshold is termed the "ice‐haze threshold"; this is the same clear‐sky threshold used by Town et al. (2005).
Figure 6 shows the thresholds (vertical dashed lines) and the radiance ratios for the entire data set of about 5500 PAERI measurements. The bottom panel is an enlargement of the main peak of the distribution shown in the top panel. (The bin size is different in the two panels.) The clear‐sky and all‐sky thresholds only distinguish the smallest values of the radiance ratios. The ice‐haze threshold encompasses the primary peak of the distribution.
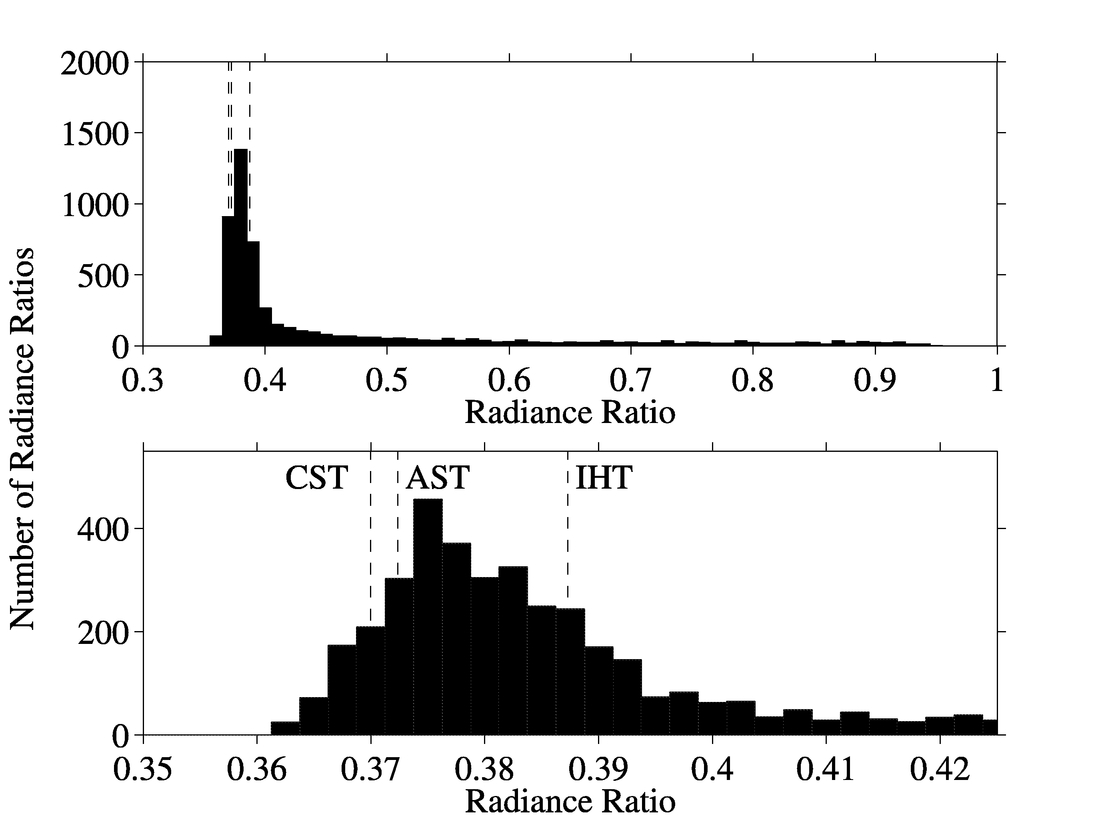
Fig. 6.— Histograms of radiance ratios (as defined in the text) with three thresholds for "clear‐sky conditions." CST is the threshold set using the radiosonde data obtained under clear skies only, AST is the threshold using radiosonde data from all‐sky conditions, and IHT is the threshold that accounts for emission from ice haze in the near‐surface atmosphere.
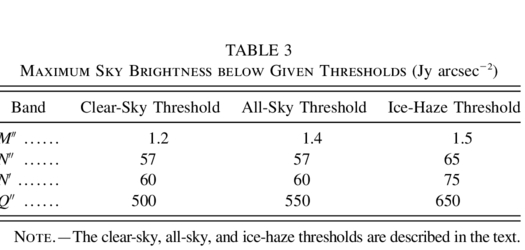
Because there is a one‐to‐one correspondence between each radiance‐ratio value and the PAERI spectrum from which it was derived, the maximum value of the sky brightness below each threshold can be determined. Table 3 summarizes these results. The values for the ice‐haze threshold are somewhat arbitrary, since they depend on the definition of the thin cloud used to calculate the threshold. However, the value of 65 Jy arcsec−2 for the N'' band agrees quite well with the value deduced by looking at the actual PAERI data during times when ice haze was reported in the visual sky observations.
 |
It is interesting to note that the distributions of the clearest sky data (those below the clear‐sky and all‐sky thresholds) are bimodal, again suggesting the influence of the summertime diurnal cycle. (This is not observed in Fig. 4, because the bin size of the histograms is too coarse.) This is most prevalent in the N' band (shown as a time series in Fig. 3), but is also somewhat apparent in the other bands as well.
By simply dividing the number of ratios below a given threshold by the total number of observations, an estimate can be made of the fraction of time that exceptionally clear conditions will occur. Again, these values are not necessarily representative of the true climatology of Dome C. Using the results listed in Table 3, one can deduce, for instance, that the sky brightness in the dark portions of the N band will be less than about 50–60 Jy arcsec−2 for about 10% of the time, and less than about 75 Jy arcsec−2 for close to 50% of the time, at Dome C in the summertime if the conditions encountered during our two field seasons are representative of climate conditions at this site.
One interesting caveat to these results is the potential effect of radiation fog on astronomical observations. Even though radiation fog occurred about 8% of the time in January, it was almost always confined to a very thin layer above the surface. The observers noticed the fog as they walked up the tower. By the time they reached the height of the PAERI instrument, they could see the top of the fog layer. Therefore, to maximize the amount of time of clear‐sky observing during the summer, infrared telescopes should be placed high enough above the surface to avoid this very shallow, low‐lying fog. Future studies should be conducted at other times of year to determine the frequency of fog and its height above the surface.
3.3. Sky Stability
The stability of the sky brightness under clear‐sky conditions is also of primary interest. Aristidi et al. (2005) have recently reported on the wind conditions at Dome C, which are very important for atmospheric stability. Because the PAERI data were rarely obtained on a consistent schedule over a long period of time (days), it was difficult to accurately perform spectral analysis (e.g., Smith & Harper 1998). In other words, the longest period of measurements at a fixed sampling rate under clear‐sky conditions was less than 12 hr. As mentioned above, the sampling rate of PAERI measurements was quite long (about 10 minutes), compared with past experiments (Smith & Harper 1998; Chamberlain et al. 2000).
Because of these sampling issues, we simply report the standard deviation of the sky brightness measurements for the longest period of clear‐sky observations during the two field seasons. This was a 5 day period from noon on 2004 January 11 at 12:00 UTC until noon on 2004 January 16, which is basically the data shown in Figure 3. Two hours of data were removed around 00:00 UTC on 2004 January 14, because of the presence of thin clouds. The average sky brightness for the remainder of this time period was 47.7 Jy arcsec−2 and varied by only 4.4 Jy arcsec−2 (1 σ). Therefore, except for a brief period of a couple of hours, the sky was extraordinarily stable for several days.
4. TRANSMISSION CALCULATIONS
In addition to making measurements with the PAERI, we also calculate the infrared radiance and transmission with LBLRTM, using the radiosonde data as input. A "model atmosphere" was constructed using the radiosonde temperature and humidity profiles from the clear‐sky averages shown in Figure 5. The precipitable water vapor for the "clear sky" humidity profile is 1.1 mm. The effect of the finite field of view of the PAERI instrument is removed from the measured spectra using the method described by Knuteson et al. (2004b). The monochromatic calculations from LBLRTM were convolved with the PAERI instrumental line function to allow direct comparisons of the PAERI measurements with the calculations. The radiance comparisons (not shown) are quite good, even in the window regions, indicating that the effects of atmospheric aerosols and ice crystals are negligible in the measured clear‐sky spectra, and that the temperature and gaseous profiles used in the model atmosphere are fairly accurate.
Transmission calculations for summertime conditions under clear skies at Dome C are shown in Figure 7. The top panel shows the transmission from 4 to 20 μm. The transmission between 4.6 and 4.7 μm and 4.9 to 5.1 μm in the M band is generally greater than 95%, with some narrow bands greater than 98%. The spectral region from 17.5 to 19.5 μm in the Q band shows transmissive regions between strong water vapor absorption lines that have transmission greater than 95%. The bottom panel in Figure 7 shows the N band between 8 and 12 μm in detail on an expanded scale. The transmission in this spectral region is generally above 95% (excluding ozone absorption between 9.3 and 10.1 μm) and even exceeds 99% at some wavelengths, especially between 11 and 12 μm.
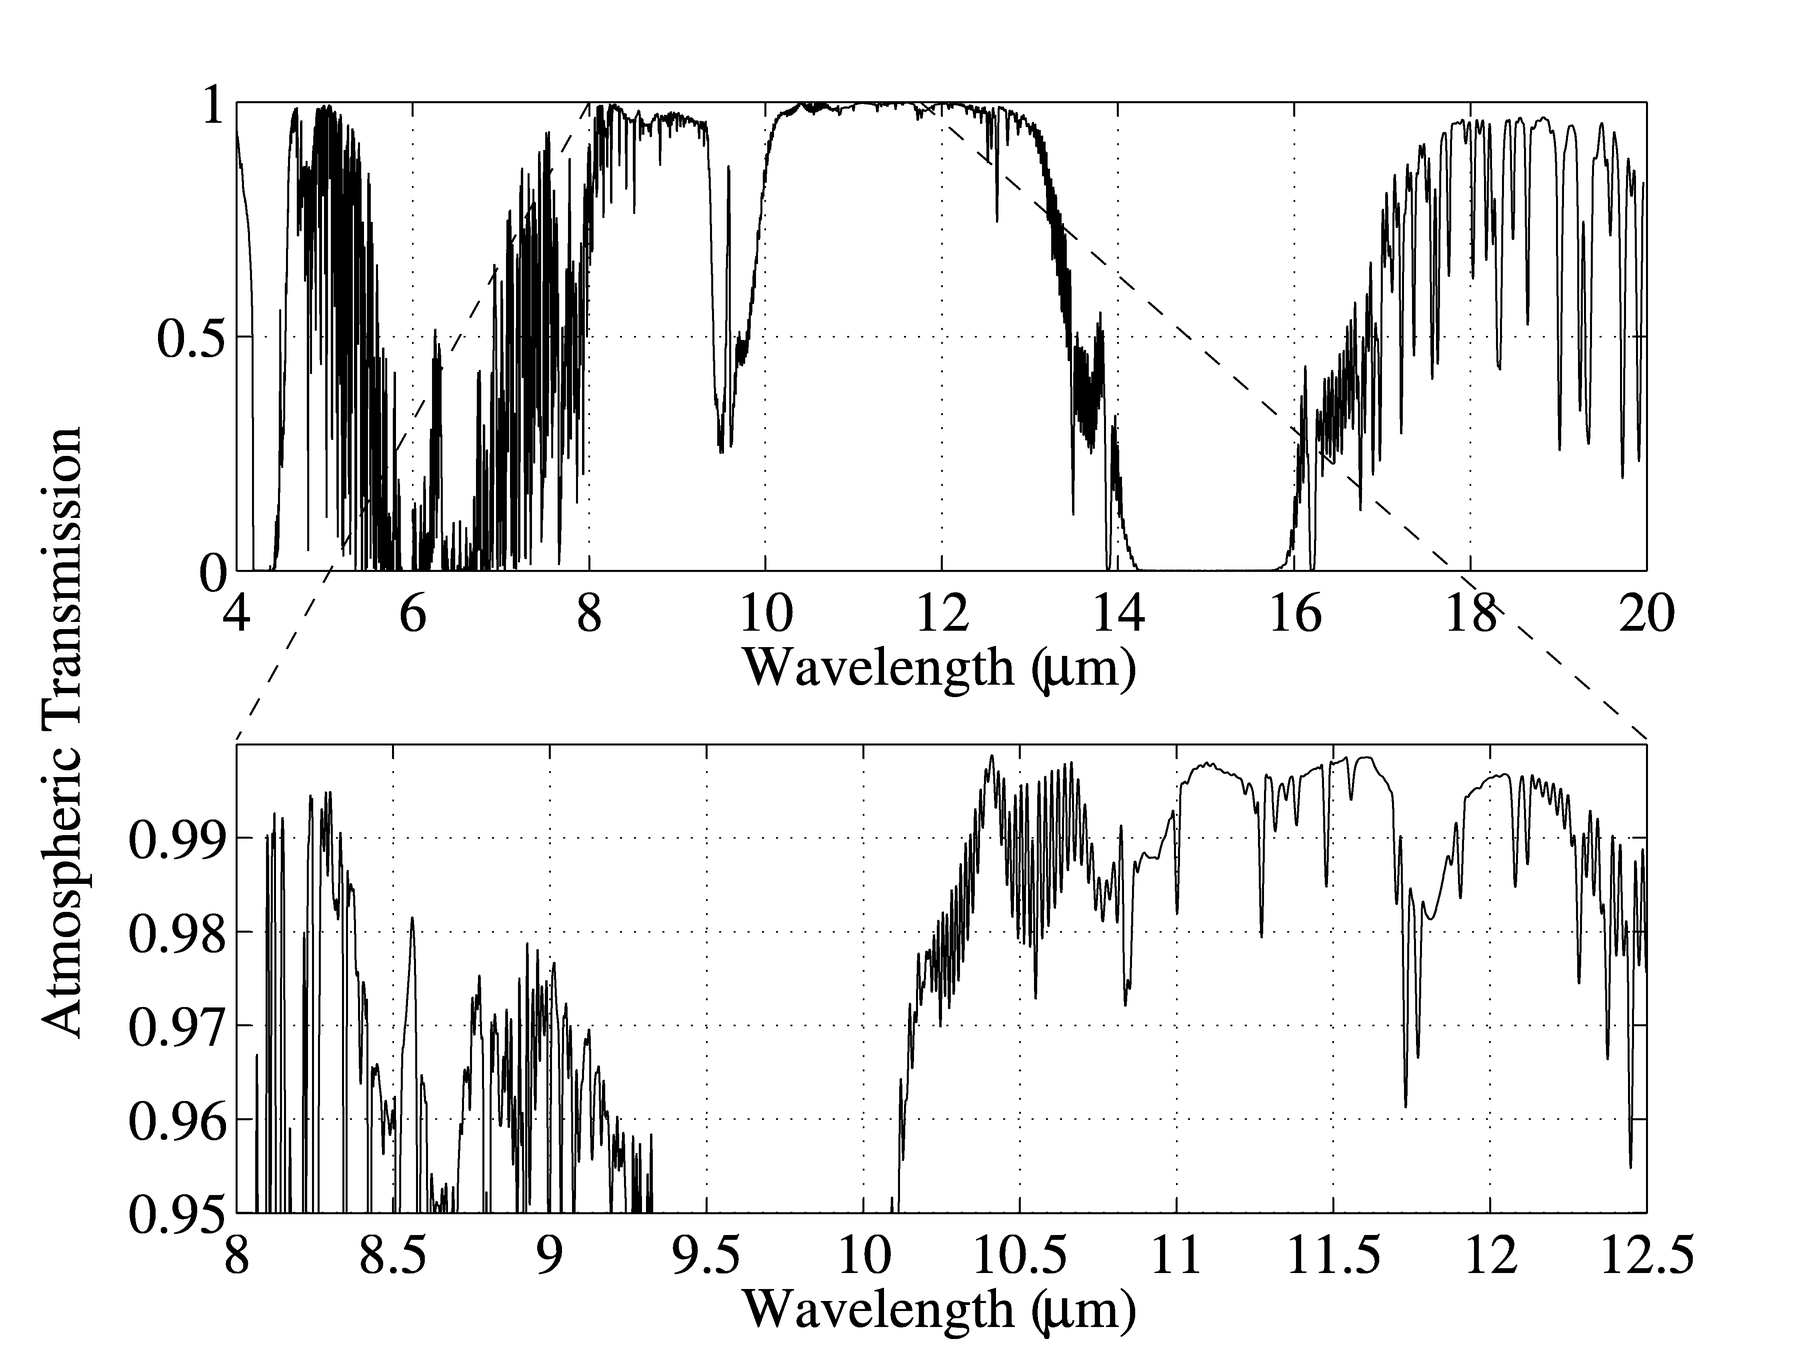
Fig. 7.— Atmospheric transmission in summertime at Dome C, Antarctica, calculated using the LBLRTM. The model atmosphere used the clear‐sky profile shown in Fig. 5. The top panel shows the transmission from 4 to 20 μm; the bottom panel is an enlargement from 8 to 12.5 μm.
One might expect that the wintertime transmission at this site would be better than in summer, because of lower temperatures throughout the troposphere and stratosphere and because of the lower column water vapor amounts. In reality, the frequency of near‐surface ice crystals, the depth of ice‐haze layers above the surface, and the wind conditions (Aristidi et al. 2005) will likely determine the usefulness of this site for infrared astronomy.
5. CONCLUSIONS
The Polar Atmospheric Emitted Radiance Interferometer has made the first measurements of the spectral infrared sky brightness at Dome C, Antarctica. The measurements show fine spectral detail of the clearest portions of the infrared spectrum. Dome C appears to be an excellent site for astronomical measurements, even in summer. Typical values of the infrared sky brightness in the darkest portions of the M, N, and Q bands are less than 0.9, 43, and 310 Jy arcsec−2, respectively. The lowest summertime values of sky brightness in these bands are 0.4, 34, and 200 Jy arcsec−2.
We also find that the sky brightness in the dark portions of the N band is less than about 50–60 Jy arcsec−2 for about 10% of the time, and less than about 75 Jy arcsec−2 for close to 50% of the time at Dome C in the summertime. These conditions apply if one takes care to position instruments above the thin layer of radiation fog just above the surface.
The sky brightness during long periods of clear‐sky conditions is exceptionally stable. During a 5 day period of clear skies in 2004 January, the average sky brightness in the N' band was 47.7 Jy arcsec−2 and varied by only 4.4 Jy arcsec−2 (1 σ).
Calculations of the summertime atmospheric transmission over Dome C show that portions of the M, N, and Q bands have transmission greater than 95%, with many spectral regions greater than 99%.
This work was supported by a grant from the National Aeronautics and Space Administration (NAG5‐11112). Vital logistical support for our field work was provided by the Programma Nazionale di Ricerche in Antartide (PNRA), the Institut Polaire Francais–Emile Victor, and the Office of Polar Programs at the National Science Foundation. We thank Karim Agabi (Univ. Nice), Tony Travouillon (Univ. New South Wales), and W. Lance Roth (Univ. Idaho) for launching radiosondes at Dome C. We also thank Stephen Hudson (Univ. Washington) for providing his observations of radiation fog for 2003 December and 2004 January. We acknowledge the Climate Monitoring and Diagnostics Laboratory of the National Oceanic and Atmospheric Administration for providing data on concentrations of trace gases from South Pole Station.
We dedicate this paper to Dr. Mario Zucchelli, late director of the PNRA. This project would not have been possible without his extraordinary vision and generosity.
Footnotes
- 1.
The measurements that we present in this paper are cited in Lawrence (2004) and listed as "in press" for the "Mem. Soc. Astron. Italiana Suppl. Ser.," but unfortunately they did not eventually appear in that form.