

ABSTRACT
We have analyzed all the reliable photometric data sets available in the bibliography for a selected sample of monoperiodic high‐amplitude δ Scuti stars in order to study the stability of their light curves. A total of 169 data sets and more than 22,000 points have been considered for seven stars: ZZ Mic, EH Lib, BE Lyn, YZ Boo, SZ Lyn, AD CMi, and DY Her. The results do not reveal significant long‐term changes of amplitude of the light curves for any of these stars.
Export citation and abstract BibTeX RIS
1. INTRODUCTION
It is well known that long‐term changes of amplitude, corresponding to one or several excited modes of a pulsating variable, are common among low‐amplitude δ Scuti stars. These variables show complex pulsation frequency spectra where a number of simultaneously excited nonradial (and radial) modes are present.
Moreover, it is also possible to find some low‐amplitude δ Scuti stars showing both a single pulsation frequency and variations in amplitude over a timescale of years. Two well‐studied examples are τ Peg (Breger 1991) and BF Phe (Poretti et al. 1996). A third example could be 28 And (Rodríguez et al. 1993, 1998), where very strong changes in amplitude, corresponding to the main frequency, are found. As an example, the observed amplitude for 1996 is about 19 times smaller than for 1991. Nevertheless, the analysis of the 1996 data set suggests also the existence of a secondary frequency with very small amplitude. However, this secondary frequency cannot be the reason for the strong amplitude variation observed in the main frequency. The cause for the amplitude variations observed in some monoperiodic low‐amplitude δ Scuti stars is still unknown.
The question now arises, what occurs when analyzing δ Scuti stars showing large amplitudes of pulsation? For these stars, simple frequency spectra and radial pulsation (Rodríguez et al. 1996) seems to be the rule. Only one or two modes appear excited, excluding microvariability (Garrido & Rodríguez 1996). Several authors have assumed that the high‐amplitude δ Scuti stars do not show changes of amplitude of their light curves in the long term; that is, the light curves of these stars are stable in amplitude. However, at this time, there is not any detailed work in the literature devoted to this aspect. The aim of this work is to analyze the behavior in the amplitude for monoperiodic high‐amplitude δ Scuti stars. For this, we have selected several well‐observed monoperiodic high‐amplitude δ Scuti stars. For any of these variables, there are photometric observations available in the literature over a long time span. For each star, we have analyzed all the reliable photometric data sets found in the bibliography in order to find any sign of amplitude variation in the light curves from one year to another.
2. METHOD
2.1. General Considerations
For each star, every analyzed data set consists of observations from one author collected over a period of less than 1 year. A comparison was made of the amplitudes obtained for different years. When necessary, the observations collected by the same author, over 2 consecutive years, were analyzed together as only one data set.
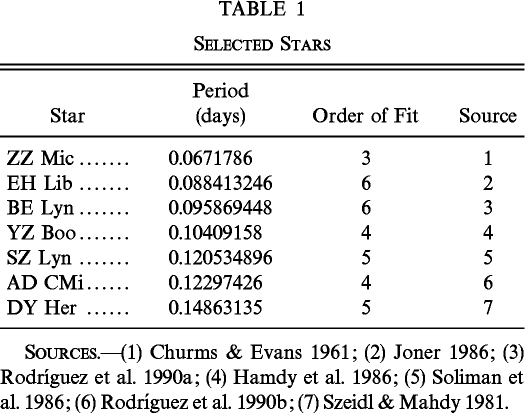
Table 1 lists the seven monoperiodic high‐amplitude δ Scuti stars we selected together with their pulsation periods and the order of the fit used in the corresponding Fourier decompositions. First, the data corresponding to each data set were phased from 0 to 1 using a linear ephemeris with the periods listed in Table 1. In order to avoid possible phase shifts in the phased data, due to the uncertainties in the published periods or possible secular variations, the origin in time T0, for each linear ephemeris, was chosen in the same epoch of the observations. For this, we use or derive one time of light maximum from the corresponding data. Nevertheless, in the case of SZ Lyn the ephemeris which describes well its period variation contains both a secular increase of the period and binary variation (Soliman et al. 1986) with a relatively short orbital period (1173.5 days) and a large semiamplitude (0.00569 days). This binary contribution is too large and must be taken into account. In this case, we use the full ephemeris derived by these authors to phase all the data sets of SZ Lyn. Thus, we avoid problems of dispersion in the phased data due to real phase shifts.
 |
After one data set has been phased, we make a Fourier decomposition of the light curve with a fixed order for the fit. For each star, several data sets were proved to know the best order of the fit. Using the matching Fourier decomposition, we build the corresponding synthetic light curve phased from 0 to 1 and determine the amplitude (as determined by Fourier analysis, i.e., semiamplitude) of the full light curve (containing all the harmonics of the fit). By comparing the observed and synthetic full light curves, we derived the σ (calculated as standard deviations of the residuals on 0.1 phase around both the time of maximum and minimum) and errors (as standard errors) listed in the columns (5) and (4) of Tables 2–pasp_111_760_709tb33pasp_111_760_709tb44pasp_111_760_709tb55pasp_111_760_709tb66pasp_111_760_709tb778, respectively.
 |
 |
 |
 |
 |
 |
 |
2.2. Transformations into Johnson ΔV Amplitudes
Tables 2–8 show that the majority of the photometric data available in the literature were collected using the Johnson BV filters. In addition, some observing runs were carried out using other filters and photometric systems. For the sake of homogeneity, all the resulting amplitudes are transformed to equivalent amplitudes into the Johnson V filter.
2.2.1. Johnson ΔB Amplitudes
In the case of data collected using the Johnson B filter, the obtained ΔB amplitudes are transformed into ΔV amplitudes by comparing the mean values obtained in these two bands for each star.
2.2.2. Str ömgren Δv, Δb, Δy Amplitudes
For this case, the b and v measurements can be averaged to approximate the variations in B. Then, the factor derived in the above section can be used to obtain the Johnson ΔV amplitudes. With respect to the observations collected using the filter y, we assume that the published magnitudes are in the standard system, that is, they are Johnson V magnitudes already.
2.2.3. Hipparcos ΔHp Amplitudes
Recently, Harmanec (1998) has derived a relationship to transform Hipparcos Hp magnitudes into Johnson V magnitudes. Using this, we can approximate the corresponding amplitudes as

Alternatively, we can use the relation derived by Cousins (1987), between the Johnson and Strömgren color indices, to obtain

In addition, we can write the following equation using Table 1b from Garrido et al. (1990) where the amplitude ratios, between observed b−y and V variations, were determined for a large sample of high‐amplitude δ Scuti stars:

Thus, using these three formulae, the corresponding Hipparcos ΔHp and Johnson ΔV amplitudes can be related using the equation

Note that the estimated transformation errors in the amplitudes, due to approximations in the equations, are of only a very few thousandths of a magnitude. This is smaller than the errors produced by the equation (4) itself and has negligible influence on the results which we obtain for the final ΔV amplitudes. This is true also for all the relationships derived below.
2.2.4. Walraven ΔBW, ΔVW Amplitudes
When we are dealing with data collected into the Walraven photometric system, we can make use of the relation given in Diethelm (1985). Thus, the amplitudes in the two systems satisfy the following equation where VW and (V−B)W are also in magnitudes:
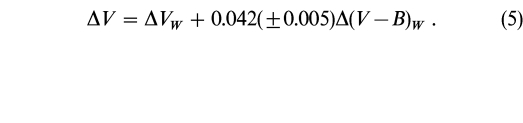
Assuming that Δ(V−B)W = -Δ(B−V) and using the relations (2) and (3), we can write

This relationship agrees very well with the results obtained by Diethelm (1985) for the high‐amplitude δ Scuti star RY Lep. In addition, by comparing the curves of this star in the filter B and BW, a similar equation can be derived for the corresponding ΔB and ΔBW amplitudes as

2.2.5. Geneva ΔBG, ΔVG Amplitudes
For observations collected using the filter VG of the Geneva photometric system, we can use the relation derived by Rufener & Maeder (1971) for the clusters of Pleiades and Praesepe. Thus, the Johnson V and Geneva VG amplitudes can be related by the following equation. As can be seen, the coefficient is practically unity due to both central wavelengths being very close to each other (Arp 1961; Matthews & Sandage 1963; Rufener 1964):

For photometry relating to Geneva BG magnitudes, no relationships were found in the literature to transform into the Johnson photometric system. However, we can make a linear approximation, taking into account the central wavelengths of the different filters and the amplitude ratios calculated by Garrido et al. (1990) for a large sample of observed high‐amplitude δ Scuti stars using Strömgren photometry. This way, we assume that the central wavelengths for the Strömgren vb, Johnson V, and Geneva BG filters are 4110, 4670, 5550, and 4250 Å, respectively (Straizys 1992; Arp 1961; Rufener 1964). Then, the Johnson V and Geneva BG amplitudes satisfy the equation

2.2.6. Other Filters
A number of photometric data available in the bibliography were not collected using "standard" filters. Examples are those observations carried out by Broglia & Masani (1957) on YZ Boo using blue and yellow filters centered at λ = 4250 Å and λ = 5400 Å, Binnendijk (1968) on SZ Lyn using B and V filters centered at λ = 4420 Å and λ = 5300 Å, etc. For these cases we have made use of the same method described for the Geneva BG filter in the preceding section. The following relations are then obtained to relate the corresponding amplitudes. Note that the relation obtained for B4250 is the same as for BG as both filters are centered at the same wavelength.


3. RESULTS
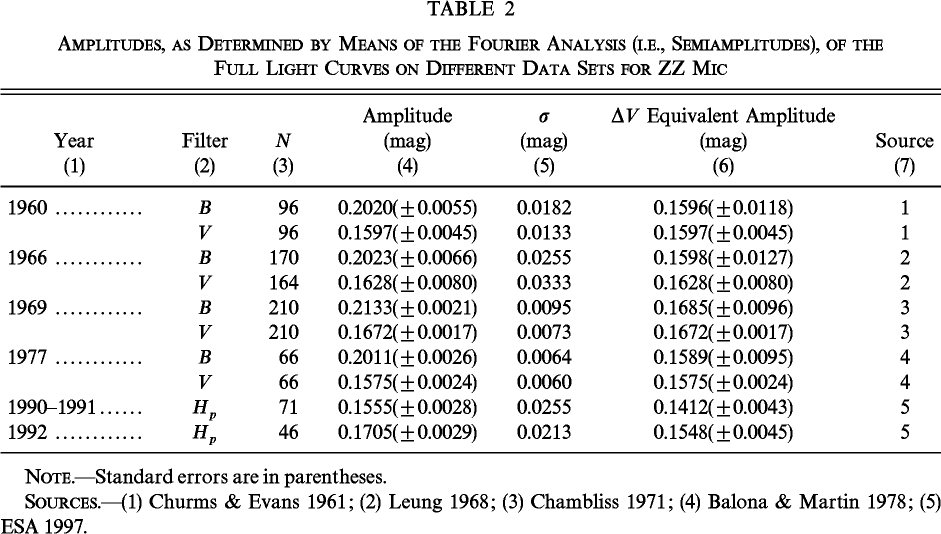
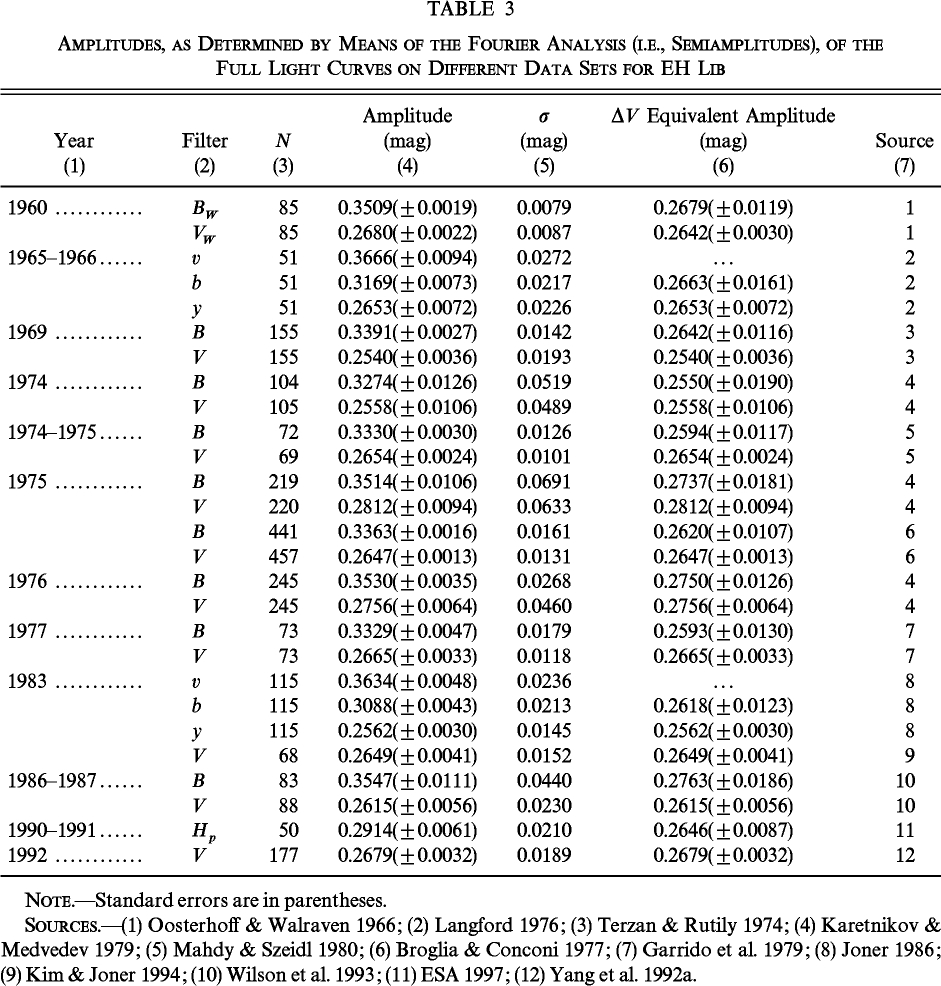
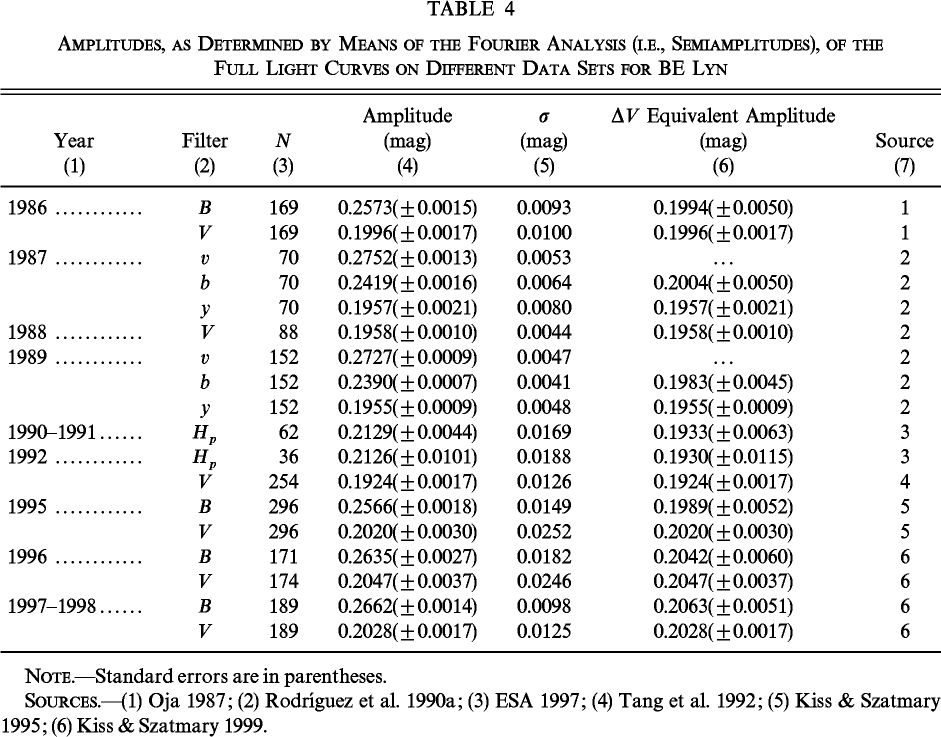
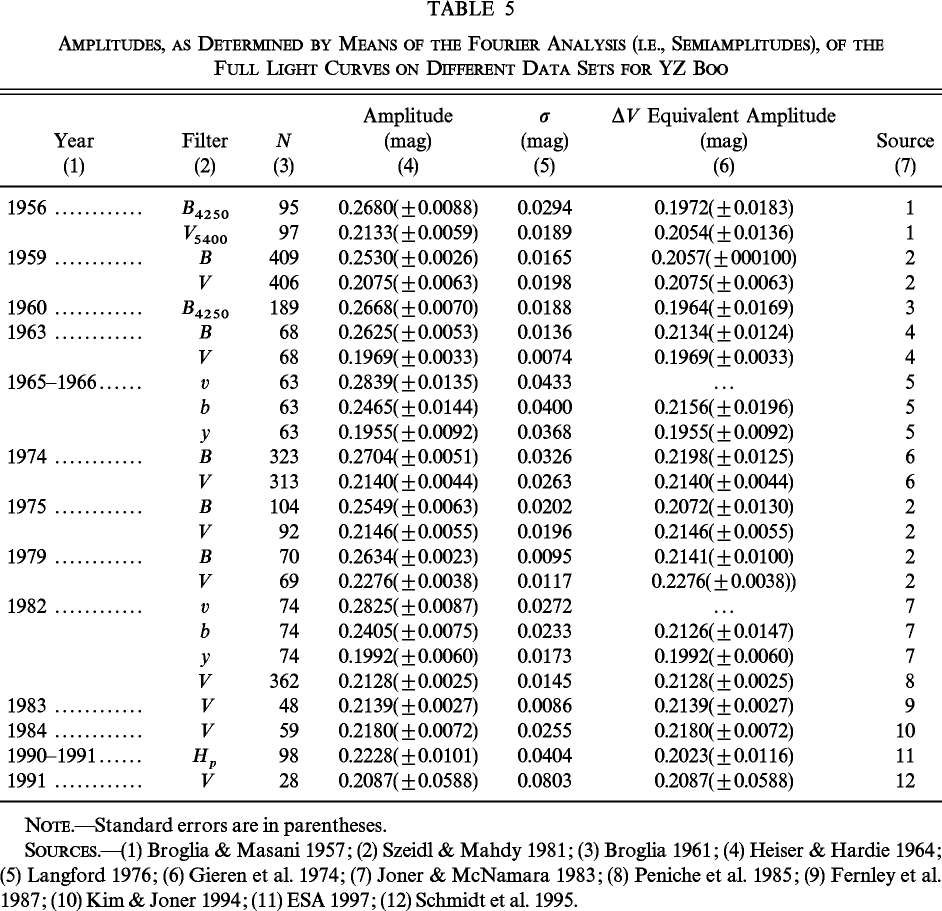
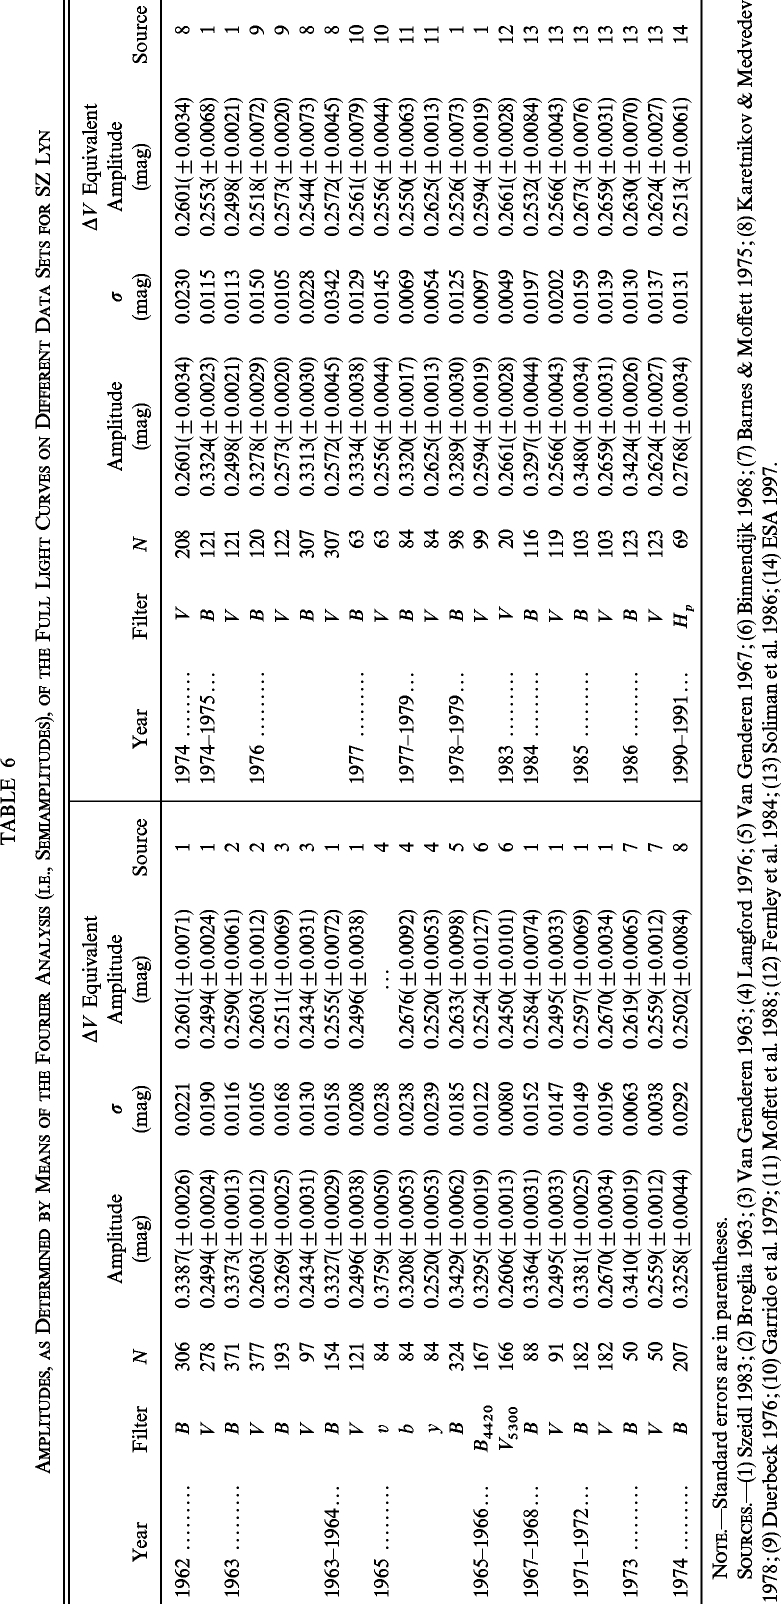
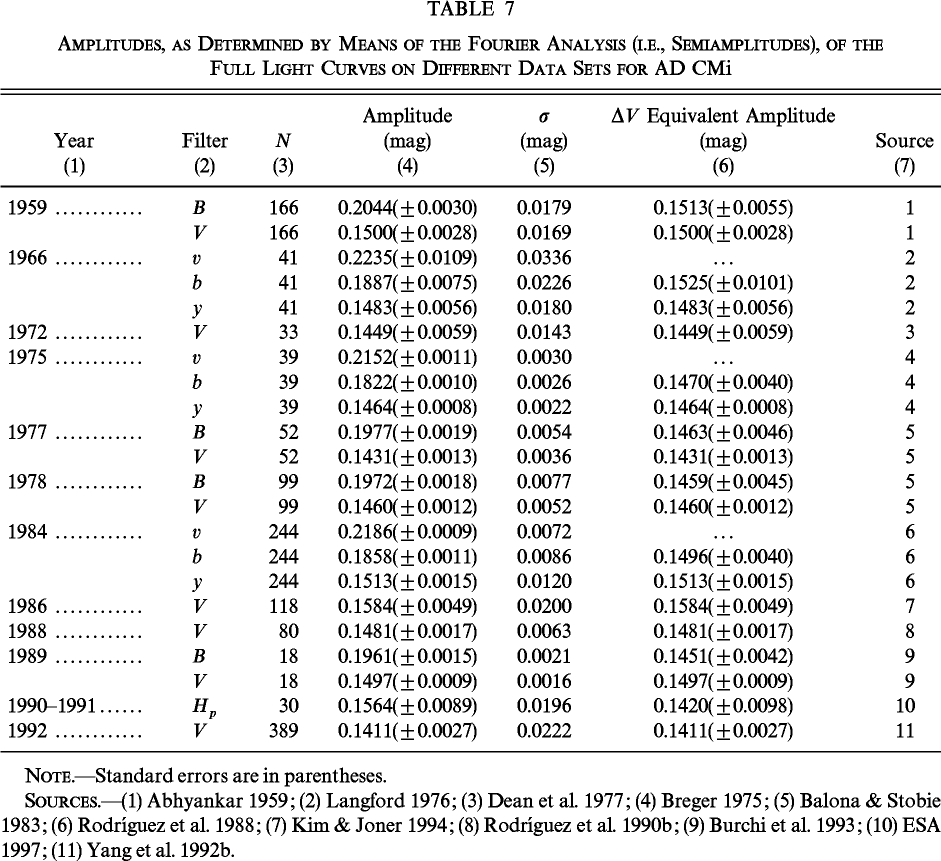
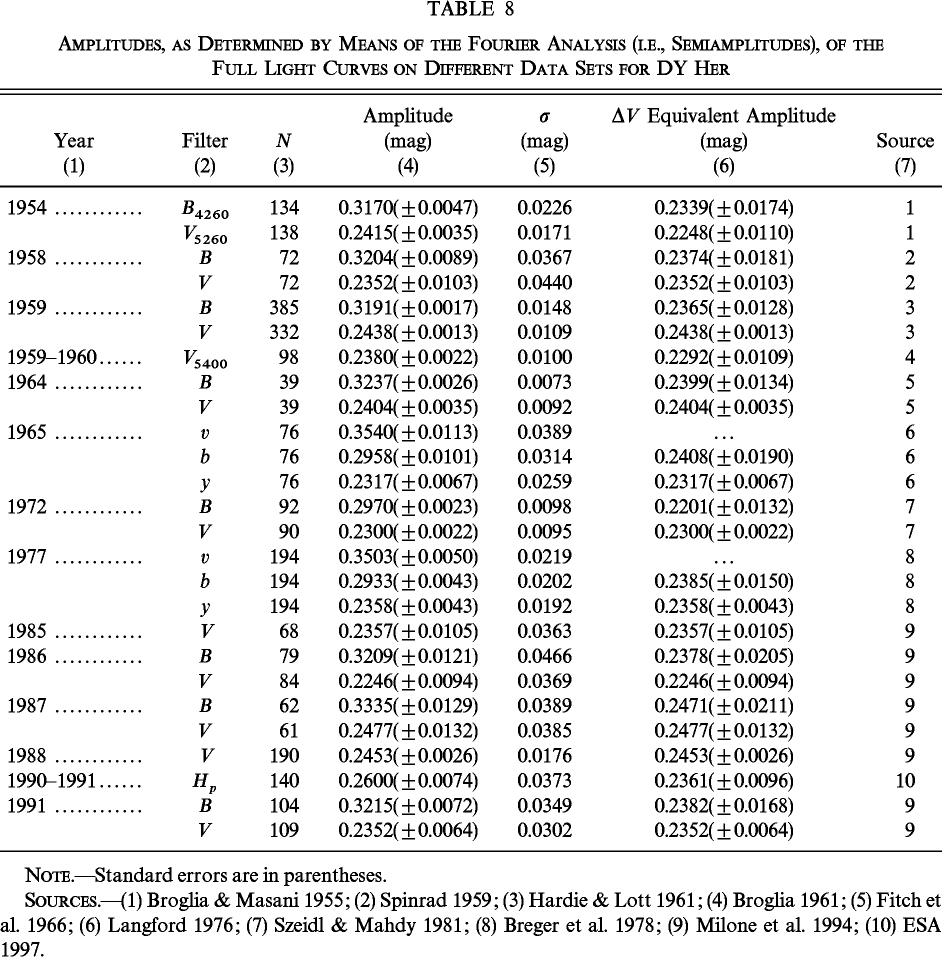
Tables 2–8 list the results obtained for each star. For every data set, the columns denote (1) the year when the observations were carried out, (2) filter used, (3) number of points collected, (4) amplitude (semiamplitude) obtained for the full light curve together with its standard error, (5) standard deviation of the residuals, (6) the corresponding Johnson ΔV equivalent amplitude obtained using the relations given in the previous section, and (7) the source of the data.
3.1. ZZ Mic
This star was photometrically observed through the 1960s by Churms & Evans (1961), Leung (1968), and Chambliss (1971) and in the 1970s by Balona & Martin (1978) using the Johnson photometric system. After this, only the observations collected by the Hipparcos satellite (ESA 1997) for the period 1990–1992 are available. Mean values of 0.2047(±0.0042) and 0.1618(±0.0042) mag are obtained for the amplitudes in the B and V bands, respectively. Then, a factor of F = 0.790(±0.037) is used to transform the amplitudes from B into V. We derive a mean value for the equivalent amplitude in the Johnson V filter of 〈ΔV〉 = 0.1590 mag with a mean standard error of 〈ε〉 = 0.0069 mag. As can be seen in Table 2, the results obtained for the final amplitudes seem to be in very good agreement. The only exception is the amplitude derived from the Hipparcos 1990–1991 data set. It seems to be slightly smaller than the others.
3.2. EH Lib
This star shows the largest amplitude among the seven high‐amplitude δ Scuti stars which have been considered in this paper. EH Lib has been observed by many authors over a period of 32 years, from 1960 to 1992. The largest data set was collected in 1975 by Broglia & Conconi (1977) using the Johnson BV filters. In total, 27 data sets have been found in the literature for this star. A factor F of 0.779(±0.028) was derived to transform the ΔB amplitudes into ΔV. The mean value obtained for the ΔV equivalent amplitude through all the data sets was of 0.2651(±0.0091) mag.
3.3. BE Lyn
This star was recently discovered as being variable, in 1986 by Oja (1987). The time span of observations is relatively short, only 12 years from 1986 to 1998. Nevertheless, there are data sets available in the literature for almost all of these years, mainly due to observations carried out by Kiss & Szatmary (1995, 1998). In general, we found that these data had the smallest dispersions. To transform the ΔB amplitudes into ΔV, the factor F was found to be 0.775(±0.015) mag and the 〈ΔV〉 equivalent amplitude obtained was 0.1989(±0.0040) mag.
3.4. YZ Boo
The earliest reliable data set of photometric observations found in the bibliography for YZ Boo is that carried out by Broglia & Masani (1957) in the year 1956. Since this, 22 other observation runs have been considered in our study. The largest data set corresponds to Szeidl & Mahdy (1981) in 1959 using Johnson BV photometry. These authors also observed this star during 1975 and 1979 using the same filters. The largest dispersion was found for the data from Schmidt et al. (1995), who collected only 28 points through 16 nights using the V filter. However, the corresponding Fourier decomposition seems to be reliable. From Table 5 we find a factor F = 0.813(± 0.031) mag and 〈ΔV〉 = 0.2090(± 0.0119) mag as the equivalent amplitude for the V band.
3.5. SZ Lyn
The largest amount of data has been collected for SZ Lyn. For this star, we found 42 photometric data sets spanning 29 years, between 1962 and 1991. The longest data set was obtained by Szeidl (1983), who observed this variable for several years during the 1960s and 1970s. However, the largest data set in only one observing run was obtained in 1963 by Broglia (1963) using Johnson photometry. For this star, we find a factor F of 0.768(±0.015) mag to transform ΔB amplitudes into ΔV and 〈ΔV〉 = 0.2567(± 0.0055) mag as equivalent amplitude. Note that the data set from Fernley et al. (1984) consists of only 20 points. These points are "normal" points obtained by averaging the observed data, each 0.05 cycles, over the whole pulsation cycle.
3.6. AD CMi
The variability of AD CMi was discovered in 1959 by Abhyankar (1959) using the Johnson photometric system. The majority of the observations were carried out during the 1970s and 1980s using Johnson and Strömgren photometry. Finally, Yang et al. (1992b) collected the largest data set in 1992 using only the Johnson V filter. F = 0.740(± 0.016) mag and 〈ΔV〉 = 0.1477(± 0.0040) mag are obtained. Note that the 18 points listed for the data set from Burchi et al. (1993) correspond to "normal" points obtained from 121 individual measurements collected on three nights.
3.7. DY Her
DY Her gave the longest time span of photometric observations. We have data sets from 1954 to 1991. Its variability was discovered by Hoffmeister (1935), but the first reliable photometric data set available in the literature was collected in 1954 by Broglia & Masani (1955). From 1965 until 1985, we found only two data sets: those from Szeidl & Mahdy (1981) and Breger et al. (1978) obtained in 1972 and 1977 using Johnson and Strömgren photometry, respectively. The longest data set was collected by Milone et al. (1994) from 1985 to 1991. For this star, we find F = 0.741(± 0.036) mag and 〈ΔV〉 = 0.2361(± 0.0112) mag.
4. CONCLUSIONS
Figure 1 shows the results obtained for all the stars analyzed in this work. In this figure we present, for each star, the annual mean amplitudes in the Johnson V filter (each year, the final ΔV equivalent amplitudes were averaged). The shaded regions correspond, in each case, to the mean value of ΔV with its standard error. As can be seen, with the data available in the bibliography, and taking into account the present error bars, we do not find significative changes in the luminosity amplitudes for any of the considered variables. If there is some real change, this variation would be of only a very small percentage of the total amplitude. In some cases, as for BE Lyn or SZ Lyn, the amplitude is found to be constant within a limit of 2% (their standard errors) of the total amplitude. In the worst case, YZ Boo, the possible amplitude variations are less than 6% of the total amplitude. However, it represents more than 0.01 mag. Therefore, small amplitude variations of a few thousandths of magnitude cannot be ruled out. On the other hand, microvariability as that found in some other high‐amplitude δ Scuti and SX Phe stars (AI Vel, SX Phe, and DY Peg; Garrido & Rodríguez 1996) must also not be ruled out.
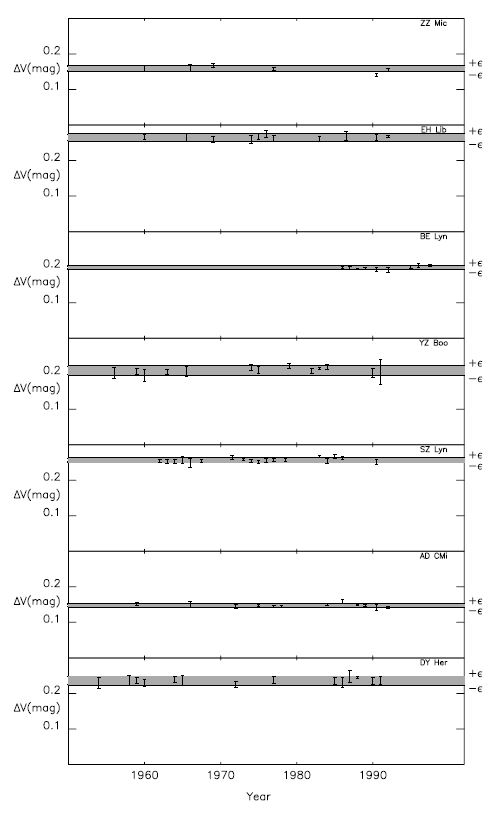
Fig. 1.— Annual mean amplitudes into the Johnson V filter for the sample of stars. The shaded regions correspond, in each star, to 〈ΔV〉 ± 〈ε〉.
Nevertheless, even in the case of YZ Boo, the 6% amplitude variation is very small when compared with those observed in some monoperiodic low‐amplitude δ Scuti stars. With the available data it seems that there are not significant changes in the amplitudes, over long timescales, for any of the monoperiodic high‐amplitude variables considered in this work. One question now arises: what is the difference between events occurring in monoperiodic low‐amplitude δ Scuti stars and events occurring in the monoperiodic δ Scuti stars of high amplitude?
The author thanks Dr. L. L. Kiss for making available his unpublished data on BE Lyn and Dr. L. Balona for his valuable comments. This research was supported by the Junta de Andalucía and the Dirección General de Enseñanza Superior (DGES) under project PB96‐0840. This research has made use of the Simbad database, operated at CDS, Strasbourg, France. Acknowledgments are also especially made to M. C. Romero for making available many papers used in this investigation and to V. G. Brown for proofreading.