
Abstract
Rheumatoid arthritis (RA) is a fluctuating progressive disease requiring frequent symptom assessment for appropriate management. Continuous tracking using digital technologies may provide greater insights of a patient’s experience. This prospective study assessed the feasibility, reliability, and clinical utility of using novel digital technologies to remotely monitor participants with RA. Participants with moderate to severe RA and non-RA controls were monitored continuously for 14 days using an iPhone with an integrated bespoke application and an Apple Watch. Participants completed patient-reported outcome measures and objective guided tests designed to assess disease-related impact on physical function. The study was completed by 28 participants with RA, 28 matched controls, and 2 unmatched controls. Completion rates for all assessments were > 97% and were reproducible over time. Several guided tests distinguished between RA and control cohorts (e.g., mean lie-to-stand time [seconds]: RA: 4.77, control: 3.25; P < 0.001). Participants with RA reporting greater stiffness, pain, and fatigue had worse guided test performances (e.g., wrist movement [P < 0.001] and sit-to-stand transition time [P = 0.009]) compared with those reporting lower stiffness, pain, and fatigue. This study demonstrates that digital technologies can be used in a well-controlled, remote clinical setting to assess the daily impact of RA.
Introduction
Rheumatoid arthritis (RA) is a chronic, systemic, and progressive autoimmune disease that affects an estimated 2 million Americans and 20 million people worldwide1. RA manifests in a range of symptoms that can fluctuate daily, including joint pain, stiffness, swelling, and fatigue2,3,4. Due to the progressive and fluctuating nature of the disease, frequent symptom assessment is paramount for a more accurate representation of the disease5,6.
RA symptoms are conventionally assessed using validated patient-reported outcome (PRO) measures, such as the health assessment questionnaire (HAQ), patient global assessment (PGA), visual analog scale (VAS), pain VAS, and duration of morning stiffness7. While well-developed PRO measures capture useful information regarding the symptoms, function, and impact of disease as experienced by patients8, they are subjective and provide only a snapshot of the patients’ lives, particularly if administered infrequently and inconsistently4. To provide a more complete picture of the patient’s status, there is a need for novel approaches to enable more frequent and sensitive monitoring of the patients’ function, disease impact, and quality of life in an objective manner to complement PRO data in clinical trials and clinical practice9.
Digital technologies offer the opportunity of continuously tracking a patient’s experience with RA and may allow for the collection of patient-centric assessments of disease activity in real-world settings. Furthermore, the use of familiar user-friendly consumer devices likely improves participant use throughout the study period10. The PARADE study demonstrated the feasibility of remotely collecting data on participants with RA in a real-world setting using a smartphone application, including PRO and objective sensor data on physical function assessment5,11. However, the PARADE study lacked clinical supervision and found that participant compliance decreased substantially over time. Another study used a wrist-worn sensor to assess morning activity patterns in participants with RA in a clinical setting and successfully recorded significant differences compared with healthy controls12.
Digital technologies have also been used to remotely monitor patients with other conditions, such as neurodegenerative diseases. A clinical trial measured daily activity in patients with Parkinson’s disease using a smartphone device with a pre-installed bespoke application and found significant differences in everyday motor behaviour compared with healthy controls13. In a Phase II trial, the same group demonstrated promising adherence, reliability, and validity of using a smartphone and smartwatch with a bespoke mobile application to collect data on participants’ performance of daily tasks14. An exploratory trial assessed physical functioning in patients with amyotrophic lateral sclerosis using an accelerometer, wireless hub, and microphone, which showed deterioration over time and moderate-to-strong correlations with the Revised Amyotrophic Lateral Sclerosis Rating Scale (ALSFRS-R), the gold standard measure of functional decline15,16. Daily physical functioning has also been assessed in patients with multiple sclerosis; sensor data provided the ability to distinguish from healthy controls as well as between disease severity groups17. These and other studies have set forth the use of digital health technologies in clinical research. European and US regulators have produced draft guidance for their use to collect data remotely in clinical trials and recommend ensuring the technology is fit-for-purpose through evidence-based feasibility and validation prior to clinical assessment10,18,19,20. This includes evaluation of established and/or novel endpoints, ensuring that the latter are clinically meaningful and capable of detecting aspects of disease progression that are important for patients10.
The main aim of this study was to investigate whether digital technologies are capable of remotely monitoring the daily impact of RA symptoms on physical functions associated with day-to-day activities in the home environment. To accomplish this, a series of objective tests were employed along with standard PROs in both RA and control cohorts, all measured using a smartphone with a bespoke mobile app. In auxiliary, the feasibility, reliability, and reproducibility of data capture using these digital technologies were assessed.
Results
Participant population
Of a total of 60 recruited participants, two participants with RA withdrew prior to data collection, while 28 participants with RA, 28 matched non-RA controls (referred to as “controls” hereafter), and 2 unmatched controls completed the study. RA and control cohorts had a mean (standard deviation [SD]) age of 58.8 (9.3) and 58.5 (9.9), respectively, and were mostly female (both 89%) and mostly white (86% vs 89%, respectively; Table 1 and Supplementary Table S1). Mean (SD) body mass index (BMI) was significantly higher in RA (31.4 [7.3]) versus control cohorts (25.8 [4.6], P < 0.001). There were 13/28 participants (46%) with moderate RA and 15/28 (54%) with severe RA. The majority of participants with moderate RA (85%) had ≥ 10 years since RA diagnosis, whereas participants with severe RA were mostly diagnosed 5–9 years prior (47%, P < 0.01; Table 2).
Construct validity: correlations between guided test performance and PRO measures
Correlation analysis showed that higher fatigue, stiffness, and lower body joint-pain map (JMAP) scores correlated with longer mean lie-to-stand transition times (Fig. 1a–c), with fatigue showing the strongest correlation with the lie-to-stand test (correlation coefficient: 0.42). One-way analysis of variance (ANOVA) showed differences between guided test performance across levels of symptom severity, as assessed by PRO measures. This included lie-to-stand transition times and fatigue, stiffness, and the aggregated lower body JMAP metric (all P < 0.0001; Fig. 1a–c), dominant wrist angular velocity and dominant wrist pain (P < 0.001; Supplementary Fig. S1a), median wrist range of motion (ROM) and degree of stiffness (P < 0.001; Supplementary Fig. S1b), and sit-to-stand transition times and degrees of stiffness (P < 0.0001; Supplementary Fig. S1c).

Correlations between lie-to-stand time and fatigue (a), stiffness (b), and lower body JMAP score (c). R2 values calculated using Spearman’s rank correlation. One-way ANOVA was used to compare differences in guided test performances and PRO measures. One-way ANOVA post hoc analyses were used to compare differences in guided tests between groups based on symptom severity as determined by PRO measures (*P < 0.05, **P < 0.01, ***P < 0.001). †Fatigue was assessed through a single-item question asking participants to rate their worst level of fatigue over the past 24 h on a 10-point scale, ranging from “no fatigue” (0) to “as bad as you can imagine” (10). FACIT-Fatigue questionnaire was administered only on Days 1, 7, and 14, hence the fewer data points compared to stiffness and lower body JMAP score plots; ‡stiffness was assessed using a single-item question on the severity of morning stiffness experienced by the participant on a given day, with 5 response options provided, ranging from no stiffness (0) to very severe (4); §lower body JMAP score was calculated by summing the scores for each hip, knee, and ankle joint (left and right; total = 6), plus the average score of all foot joints (10 joints per foot) and dividing by 2. Score could range from a minimum of 0 to a maximum of 12 (maximum reached in study was 8). ANOVA analysis of variance, FACIT-Fatigue functional assessment of chronic illness therapy—fatigue, JMAP joint-pain map, PRO patient-reported outcome, RA rheumatoid arthritis, s seconds.
Additional post hoc analyses showed that participants with RA and fatigue PRO scores of 0–2 performed the lie-to-stand test faster than those with fatigue of 7–8 (P = 0.046; Fig. 1a), and those with less severe lower body JMAP scores also had quicker times than those with higher JMAP scores (Fig. 1c). Participants with RA with a JMAP score of 0 had faster wrist movements than those with higher JMAP scores, whereas no significant differences were found with controls (Supplementary Fig. S1a). Participants with RA with no stiffness had greater range of wrist movement (P < 0.001; Supplementary Fig. S1b) and faster sit-to-stand transition times than those with a stiffness score of 2 (P = 0.009; Supplementary Fig. S1c).
Clinical utility: comparisons of guided test and PRO scores between RA and control cohorts
Participants with RA had a greater maximum wrist ROM than controls (mean [SD] of dominant hand 165.1 [8.6] vs 156.9 [9.9] degrees; P < 0.001) but lower maximum velocity (mean [SD] of dominant hand 410.5 [163.5] vs 509.1 [134.1] deg/s [s]; P = 0.03; Table 3). Participants with RA had longer transition times for the sit-to-stand (mean [SD] 1.74 s [0.52] vs 1.49 s [0.25]; P = 0.03) and lie-to-stand tests (mean [SD] 4.77 s [1.70] vs 3.25 s [0.61]; P = 0.001) vs controls, but not for the stand-to-sit transition. No notable differences were found between participants with moderate and severe RA for wrist ROM, sit-to-stand, and lie-to-stand tests, although the transition time for the lie-to-stand test was longer in severe versus moderate RA cohorts (mean [SD] 4.90 s [1.65] vs 4.62 s [1.82]; P = 0.59).
The gait and peg tests reported similar results between RA and control cohorts, determining these as less useful measures for testing physical functioning of participants with RA.
Participants with RA had significantly worse PRO scores than controls (Supplementary Table S2). In addition, patients with severe RA had worse scores for most PROs compared with the moderate RA group, reaching statistical significance for HAQ Disability Index (HAQ-DI), RA Symptom and Impact Questionnaire (RASIQ) pain, RASIQ stiffness, morning and afternoon stiffness, pain, PGA, and Short Form 36 (SF-36) physical component summary (PCS) scores. The results showed that, in almost all joints, participants with RA had significantly higher average pain scores over the duration of the study than controls (P ≤ 0.004), whereas there was no significant difference in pain scores in any joint between participants with moderate versus severe RA.
Feasibility: task completion and compliance rates
Completion rates were high in both cohorts, with mean completion rates for both PROs and guided tests of 97% for the RA cohort and 99% for the control cohort. Similarly, the quality control (QC) process showed a high rate of correct exercise completion: 98% for the wrist test, 99.9% for walk exercises, 84% for completed sit-to-stand tests, and 95% for completed lie-to-stand tests.
On all study days, the majority of participants in RA and control cohorts wore the Apple Watch for > 85% (RA: 82%; control: 90%) and many even for > 90% (RA: 64%; control: 50%) of the day, which was inclusive of charging time (approximately 2 h per day). Nearly all participants in RA and control cohorts had 100% completion of assigned daily tasks on all 14 study days. Mixed effects linear models found no significant effect of study day on wear rates or task completion rates.
Reproducibility and reliability: effect over time of guided test performance and inter-rater reliability analysis for RA and controls
A univariate mixed effects linear model found no significant changes over time in any of the PRO measures or in the lie-to-stand transition times throughout the 14-day study period (P < 0.113; Supplementary Fig. S2a); however, there was an increase in wrist angular velocity (P < 0.001, Supplementary Fig. S2b) and a decrease in the sit-to-stand transition time (P < 0.001; Supplementary Fig. S2c) and maximum ROM (P = 0.043) between Day 1 and Day 14. There was also a significant decrease in maximum ROM in controls (P = 0.030) but not RA participants (P = 0.750) over the study period.
Intra-class coefficients (ICCs) for controls ranged from 0.599 to 0.852, while those for participants with RA ranged from 0.722 to 0.897, with the highest ICCs generally for the wrist and standing (vs sitting/lying) exercises for both RA and control cohorts.
Discussion
Although digital endpoints based on guided tests administered through a smartphone app have been explored in other diseases13,14,17, the application to RA is relatively unexplored. To our knowledge, PARADE was the first of these studies in RA with a subsequent study that used sit-to-stand tasks but in a relatively small study population size (N = 45)5,21. The current study adds to the limited available evidence and demonstrated moderate correlations between guided test-derived measures and PRO measures, which were indicative of construct validity, while RA and control cohorts were distinguishable by their guided test scores, providing evidence of clinical utility. Also, this study verified the feasibility of using digital technologies to monitor the physical function and impact of disease on participants with RA remotely over a 14-day period in a controlled clinical setting. Compliance rates were exceptionally high, and results were generally reproducible over time.
Correlations of the lie-to-stand test results with PRO scores (fatigue, stiffness, lower body JMAP metric) demonstrate how digital measures can be linked to different symptoms while providing objectivity to conventional assessments. In particular, the lie-to-stand test relates closely to the action of getting out of bed and is therefore a valuable metric, as the ability to perform daily activities is a key indicator of patients’ quality of life in RA2. The PRO scores in this study that were indicative of greater pain or discomfort were generally associated with worse guided test scores in the RA cohort. Specifically, those with a dominant wrist pain score of 3 had a reduced median angular velocity of their dominant wrist than those with a pain score of 1. Similarly, those with higher body JMAP scores of 6–8 had slower lie-to-stand transition times than those with JMAP scores of 0–4. In summary, this represents the initial stages of validation for novel digital endpoints in RA, with assessment of clinical validity in the context of an interventional clinical trial being the logical next stage of progression.
Regarding clinical utility, the guided tests separated RA and control cohorts, as did standard PRO scores; however, results should be treated with caution considering the descriptive nature of the statistical analyses used in this study. Longer sit-to-stand (RA: 1.74 s; control: 1.49 s; P = 0.03) and lie-to-stand times (RA: 4.77 s; control: 3.25 s; P = 0.001) in RA participants compared with controls are likely a result of their symptoms (fatigue, stiffness, pain) directly impacting their performance speeds of these actions. Furthermore, symptoms commonly fluctuate in RA3, which could have contributed to the greater variability of guided test performance among the RA cohort compared with controls. Although guided tests were unable to differentiate between moderate and severe RA cohorts in this study, most PRO measures (pain, stiffness, fatigue, and lower body JMAP) were able to separate moderate from severe RA. Wrist angular velocity was inversely related to increasing levels of wrist pain (dominant wrist pain 0 vs 1–3; P < 0.05), consistent with the PARADE study findings5. In a study using smartphones in a clinical trial setting, worse activity-based scores were shown for participants with Parkinson’s disease compared with healthy controls, and activity tests were related to symptom severity. Furthermore, guided active tests identified abnormalities that were missed in patient examinations, suggesting that digital assessments may be more sensitive and may provide additional insights compared with conventional measures13.
Differences were found between the performance over time of the individual guided tests. For example, the lie-to-stand test results were consistent over the duration of the study period while the wrist angular velocity and sit-to-stand tests saw improvements in scores over time. Given that the latter two tests were simple one-step motions, patients are likely to have learned and become more confident with the tests, leading to quicker motions and shorter transition times, as the study continued. Similarly, the decrease in wrist ROM over time in controls compared with stable metrics shown in the RA cohort may be due to increased awareness of the assessment’s objective by the latter.
Passive data collection and task completion rates were very high across all participants over the study period. These rates were higher than those in the PARADE study in which, by Week 2 of 12, only 40.6% of participants had provided data, despite 73.2% of participants at study initiation showing preference for participating in a study using a mobile app over one conducted in a clinic5. Potential reasons for the higher rates of retention in this study include involving clinician-recruited participants with upcoming visits as opposed to self-recruitment, confirming clinical diagnosis of the participants with RA, using a robust monitoring system to encourage task completion, compensating participants, use of consumer technology that many participants would already be familiar with, and the relatively short study duration. Furthermore, involving an advisory board of participants with RA in the design of the study and mobile application and providing patient training for performing the various study assessments may have contributed to enhanced participant engagement in this study22. The participant responses to the beta test fed into optimizing the study design and technology to proactively tackle any common user issues. Reassuringly, participants responded with “Strongly agree” (77%) or “Agree” (21%) after the study when asked if they would be involved in an identical future study. Similarly, the Remote Monitoring of RA (REMORA) study also incorporated patient feedback to help optimize development of their mobile app and found strong patient engagement over the 3-month study period23. Lastly, the current study included more robust quality check systems than the PARADE study11 to ensure that only data from correctly performed tests were analyzed. Together, this highlights the importance of incorporating appropriate training, involving patients in device/application development, and including data integrity checks in studies involving remote monitoring and digital technologies.
While this study had encouraging results with its various objectives, there were some limitations to consider. To allow for one-to-one follow-up, a relatively small population was included over a short study period. Also, the study population lacked demographic variability due to the involvement of only one clinical site. Thus, findings should be interpreted within this context. It should be noted that 75% of the RA cohort had a college/graduate level education and therefore does not represent low education level populations, while engagement with the digital technologies tested relied upon a certain level of education/experience. However, by utilizing user-friendly and familiar devices, it is anticipated the study findings will be applicable across a wider patient demographic. As this was an exploratory study into the use of devices to measure patient function, we did not assess whether the measures conducted in this study would be sensitive to drug treatment effects or disease progression. Additionally, potential confounding factors such as the BMI difference between RA and control cohorts could have impacted the sit-to-stand or lie-to-stand metrics; however, associations between guided test performance and PRO measures were not altered when BMI was controlled for (data not shown). Finally, as this study was not adjusted for multiplicity or powered for hypothesis testing, statistical comparisons could be used only for quantification/descriptive purposes.
Future developments would include creating composite endpoints that combine both active and passive monitoring, as well as PRO and other clinical measures, potentially providing a more robust means to differentiate control and RA cohorts and disease severity. Future work in a study population with a wider demographic would involve a more targeted and reduced set of assessments (e.g., only including the lie-to-stand guided test, which showed the greatest promise in this study) for simpler use and implementation. Further longitudinal studies are warranted to evaluate the potential of using the technology and guided tests in a remote clinical trial setting. This will help substantiate the findings in larger populations with appropriate statistical power to enable hypothesis testing.
Few studies have used digital endpoints based on guided tests administered through smartphones to assess symptoms of RA5,21, emphasizing this as a relatively unexplored field of study. Although these findings require further validation with a larger group of participants over a longer study period, the guided tests and the digital technologies used showed capability of capturing consistent and reliable information on the physical functioning of participants, thus offering a more holistic picture of a patient’s disease alongside conventional measurements. Participant retention and compliance were high, with consistent engagement with the mobile app throughout the course of the study. Ultimately, digital technologies have the potential to gain greater insights into the impact of patient symptoms and their ability to perform daily tasks. This will allow for a more enhanced and patient-centric understanding of the effect of novel medicines, leading to improved efficacy assessment as well as faster decision-making in future trials.
Methods
Study design
This was a prospective study of participants with moderate to severe RA and 28 controls, matched on age (± 3 years), sex, and race. A sample size of 60 was chosen to facilitate one-to-one follow-ups. RA and control participants were recruited from Reliant Medical Group’s Rheumatology clinic and General Medical clinic (Worcester, Massachusetts). All participants were given an Apple Watch Series 4 and an iPhone 7 that had a preloaded, bespoke, study-specific mobile application. In-person training was provided by a site study coordinator on how to use the devices and application, perform the guided tests, and complete the PRO measures. Participants were required to complete PRO measures either weekly, daily, or twice a day, and guided tests twice a day for 14 days (Fig. 2; Supplementary Table S3). Data were transmitted in near real time to monitor compliance and for study coordinators to contact participants to encourage task completion if necessary.
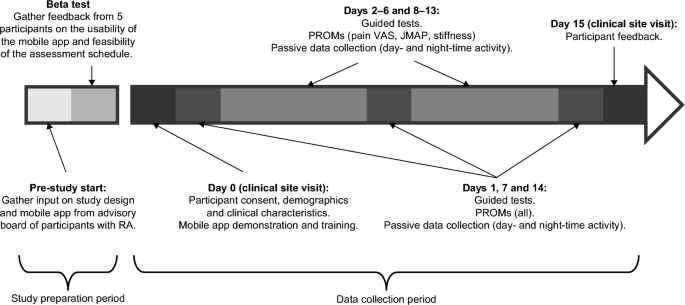
Study design. JMAP joint-pain map, PROM patient-reported outcome measure, RA rheumatoid arthritis, VAS visual analog scale.
Prior to the study initiation, an advisory board of patients with RA (not participating in the study) provided input on the study design and mobile app; this was followed by a beta test over a 5-day period involving 5 participants with RA to gather feedback on the usability of the app, clarity of instructions, and feasibility of the assessment schedule. Feedback from the beta test included difficulty in remembering to charge the devices, inconsistent syncing of data to the backend server, and limitations of the iPhone leg strap. In response to this feedback, the training was updated to include more specific instructions on when to charge the devices, the software was updated to improve data syncing, and the leg strap was redesigned along with providing a detailed pictorial guide for how to attach it.
Study objectives
The following study objectives were investigated:
-
1.
Construct validity: correlations between guided test performance and PRO measure severity.
-
2.
Clinical utility: differences in guided test performance and PRO measure scores between RA and control cohorts.
-
3.
Feasibility: completion rates of study assessments and Apple Watch wear rates in RA and control cohorts.
-
4.
Repeatability and reproducibility: changes in guided test performance and PRO measures over time in RA and control cohorts.
Ethics
All documentation, including the study protocol, any amendments, and informed consent procedures, was reviewed and approved by Reliant Medical Group’s Institutional Review Board. All participants provided written informed consent before any study procedures were undertaken. The study was conducted in accordance with the International Committee for Harmonisation principles of Good Clinical Practice and the Declaration of Helsinki.
Participant selection
The full list of participant inclusion and exclusion criteria is included in Supplementary Table S4. Briefly, participants with RA were recruited from the Reliant Medical Group by clinicians during a clinical visit if they had a clinically verified diagnosis of moderate to severe RA, with severity assessed using Routine Assessment of Patient Index Data 3 (RAPID-3; score ≤ 12: moderate RA; score > 12: severe RA). Controls were outpatients from the Reliant Medical Group and were excluded if they had prior or current diagnosis of a rheumatological disorder, inflammatory disorder, malignancy, or other relevant diseases.
Study assessments
The schedule of assessments and example screenshots of the bespoke mobile application used to collect the metrics from these assessments are provided in Supplementary Table S3 and Supplementary Fig. S3, respectively.
For the guided tests, the iPhone was used to collect accelerometer and gyroscope data as participants performed predefined guided physical functioning tests. The guided exercises were designed using clinical and patient feedback to test aspects of participants’ functionality that are likely impacted by the symptoms that matter most to patients with RA (i.e., joint pain, stiffness, fatigue, and sleep)2. Participants were instructed to perform each guided test daily, once in the morning (immediately after waking up) and once in the afternoon, to assess the change in stiffness throughout the day. The wrist ROM test is described in detail in the PARADE study5. Briefly, while holding the iPhone facing upwards over the edge of a table, participants flexed and extended their wrist joint to its maximum angle (without going beyond the zone of comfort), repeating the motion for 10 s. The test was done once in both hands. For the sit-to-stand test, participants sat on a chair with the iPhone strapped to their upper right thigh and with their arms crossed over their chest, then stood up and sat down 5 times at their own pace. Average times taken to transition from sitting to standing and from standing to sitting were extracted from accelerometer and gyroscope data. For the lie-to-stand test, participants lay on a bed with their legs stretched and the iPhone strapped to their upper right thigh, then stood up on the floor twice at their own pace. Average times taken to transition from lying to standing and from standing to lying were extracted from accelerometer and gyroscope data. Other guided tests included the gait test and the 9-hole peg test (ResearchKit; Apple Inc., CA, USA)5. In the gait test, participants were asked to attach the iPhone to their right thigh and walk in a straight line for 30 s. The 9-hole peg test, which measures hand dexterity, asks participants to use two fingers on their left hand to drag a round ‘peg’ on the iPhone screen into a ‘hole’ elsewhere on the screen and then use two fingers on their right hand to remove the peg from the hole. The Apple Watch was also used to continuously collect background accelerometer data to passively measure daily and night-time activity counts, the data of which are not reported in this article.
PROs were assessed on Days 1, 7, and 14, and included the following: Functional Assessment of Chronic Illness Therapy—Fatigue (FACIT-Fatigue) to assess fatigue28; HAQ-DI and SF-3629 questionnaires to indicate impacts on participant’s quality of life24,30,31; Patient-Reported Outcomes Measurement Information System (PROMIS) Pain Interference to assess how pain interferes with participants’ daily wellbeing and PROMIS Sleep Disturbance to assess sleep quality32; RASIQ to quantify symptom severity and its impact on the participant4. RA-specific assessments (RASIQ, PGA, stiffness) were not administered to controls.
Short questionnaires were administered every day, except for morning stiffness that was done on Days 2–6 and 8–13. Morning stiffness and severity of stiffness were assessed from responses to questions 11, 12, and 13 from RASIQ4. The JMAP recorded the number and severity of painful joints experienced at a given time from 55 prespecified joints presented on a body map; pain was scored as no pain, mild pain, moderate pain, or severe pain11. Pain VAS assessed pain severity on a scale ranging from 0 mm (no pain) to 100 mm (worst pain)33. PGA measured overall the way RA affects participants and/or disease activity using a single-item question and the VAS scoring34. A global assessment of fatigue over the previous 24 h was measured on a 10-point scale, ranging from “no fatigue” (0) to “as bad as you can imagine” (10).
Guided test algorithms
Details of the algorithms for the wrist ROM test, sit-to-stand test, and lie-to-stand test are provided in the Supplementary methods S1. An illustrative flow chart of the algorithm for the lie-to-stand test is shown in Supplementary Fig. S4 and has previously been reported for the wrist ROM test11.
Data quality assessment
Automated and manual data quality assessments were conducted throughout the study to ensure that the data analyzed were only from tests that had been performed correctly. The wrist test quality check was performed manually, and both manual and algorithmic quality checks were performed for the walk test, sit-to-stand test, and lie-to-stand test. Tests that were clearly performed incorrectly were removed from the sample.
Statistical analyses
Descriptive statistics were used for demographics and clinical characteristics, PRO measures, and guided tests. Wilcoxon signed-rank tests were used for matched (i.e., participants with RA vs controls and morning vs afternoon) and rank sum tests for unmatched (i.e., participants with moderate vs severe RA) comparisons. Nonparametric tests were used, as normal distribution could not be assumed due to the small sample size. Trends in time were assessed using univariate mixed effects models, with study day as a fixed effect and individual differences as random effects. ICCs were calculated to measure the consistency of guided tests over time for each participant using a two-way mixed effect, single rater, consistency convention; a higher ICC indicated a more regular test performance over the study period than a lower ICC. Correlations between PROs and guided tests were assessed using Pearson correlation coefficients, and one-way ANOVA was conducted using the Kruskal–Wallis test by ranks, with Mann–Whitney U-tests for post hoc pairwise comparisons. There was no adjustment for multiplicity in this study, and the study was not powered for hypothesis testing; therefore, P-values were used for quantification/descriptive purposes only.
Data availability
Anonymised individual participant data that support the findings of this study are available from the corresponding author, upon reasonable request and subject to GSK’s approval.
References
Safiri, S. et al. Global, regional and national burden of rheumatoid arthritis 1990–2017: A systematic analysis of the Global Burden of Disease study 2017. Ann. Rheum. Dis. 78, 1463–1471. https://doi.org/10.1136/annrheumdis-2019-215920 (2019).
Alten, R. et al. Physical and emotional burden of rheumatoid arthritis: Data from RA matters, a web-based survey of patients and healthcare professionals. Rheumatol. Ther. 6, 587–597. https://doi.org/10.1007/s40744-019-00179-2 (2019).
Flurey, C. A., Morris, M., Richards, P., Hughes, R. & Hewlett, S. It’s like a juggling act: Rheumatoid arthritis patient perspectives on daily life and flare while on current treatment regimes. Rheumatology 53, 696–703. https://doi.org/10.1093/rheumatology/ket416 (2014).
Becker, B. et al. Development, psychometric evaluation and cognitive debriefing of the rheumatoid arthritis symptom and impact questionnaire (RASIQ). J. Patient Rep. Outcomes 5, 129. https://doi.org/10.1186/s41687-021-00400-3 (2021).
Crouthamel, M. et al. Using a ResearchKit smartphone app to collect rheumatoid arthritis symptoms from real-world participants: Feasibility study. JMIR Mhealth Uhealth 6, e177. https://doi.org/10.2196/mhealth.9656 (2018).
Haraoui, B. Assessment and management of rheumatoid arthritis. J. Rheumatol. Suppl. 82, 2–10. https://doi.org/10.3899/jrheum.090124 (2009).
Kalyoncu, U., Dougados, M., Daurès, J. P. & Gossec, L. Reporting of patient-reported outcomes in recent trials in rheumatoid arthritis: A systematic literature review. Ann. Rheum. Dis. 68, 183–190. https://doi.org/10.1136/ard.2007.084848 (2009).
Gossec, L., Dougados, M. & Dixon, W. Patient-reported outcomes as end points in clinical trials in rheumatoid arthritis. RMD Open 1, e000019. https://doi.org/10.1136/rmdopen-2014-000019 (2015).
Bingham, C. O. 3rd. et al. Use of daily electronic patient-reported outcome (PRO) diaries in randomized controlled trials for rheumatoid arthritis: Rationale and implementation. Trials 20, 182. https://doi.org/10.1186/s13063-019-3272-0 (2019).
FDA. Digital health technologies for remote data acquisition in clinical investigations, https://www.fda.gov/media/155022/download (2021).
Hamy, V. et al. Developing smartphone-based objective assessments of physical function in rheumatoid arthritis patients: The PARADE study. Digit. Biomark. 4, 26–43. https://doi.org/10.1159/000506860 (2020).
Keogh, A. et al. A thorough examination of morning activity patterns in adults with arthritis and healthy controls using actigraphy data. Digit. Biomark. 4, 78–88. https://doi.org/10.1159/000509724 (2020).
Lipsmeier, F. et al. Evaluation of smartphone-based testing to generate exploratory outcome measures in a phase 1 Parkinson’s disease clinical trial. Mov. Disord. 33, 1287–1297. https://doi.org/10.1002/mds.27376 (2018).
Lipsmeier, F. et al. Reliability and validity of the Roche PD mobile application for remote monitoring of early Parkinson’s disease. Sci. Rep. 12, 12081. https://doi.org/10.1038/s41598-022-15874-4 (2022).
Garcia-Gancedo, L. et al. Objectively monitoring amyotrophic lateral sclerosis patient symptoms during clinical trials with sensors: Observational study. JMIR Mhealth Uhealth 7, e13433. https://doi.org/10.2196/13433 (2019).
Kelly, M. et al. The use of biotelemetry to explore disease progression markers in amyotrophic lateral sclerosis. Amyotroph. Lateral Scler. Frontotemporal Degener. 21, 563–573. https://doi.org/10.1080/21678421.2020.1773501 (2020).
Creagh, A. P. et al. Smartphone- and smartwatch-based remote characterisation of ambulation in multiple sclerosis during the two-minute walk test. IEEE J. Biomed. Health Inf. 25, 838–849. https://doi.org/10.1109/JBHI.2020.2998187 (2021).
Committee for Medicinal Products for Human Use (CHMP). Qualification opinion on stride velocity 95th centile as a secondary endpoint in Duchenne muscular dystrophy measured by a valid and suitable wearable device, https://www.ema.europa.eu/en/documents/scientific-guideline/qualification-opinion-stride-velocity-95th-centile-secondary-endpoint-duchenne-muscular-dystrophy_en.pdf (2016).
Haberkamp, M. et al. European regulators’ views on a wearable-derived performance measurement of ambulation for Duchenne muscular dystrophy regulatory trials. Neuromuscul. Disord. 29, 514–516. https://doi.org/10.1016/j.nmd.2019.06.003 (2019).
Mantua, V., Arango, C., Balabanov, P. & Butlen-Ducuing, F. Digital health technologies in clinical trials for central nervous system drugs: An EU regulatory perspective. Nat. Rev. Drug Discov. 20, 83–84. https://doi.org/10.1038/d41573-020-00168-z (2021).
Perraudin, C. G. M. et al. Observational study of a wearable sensor and smartphone application supporting unsupervised exercises to assess pain and stiffness. Digit. Biomark 2, 106–125. https://doi.org/10.1159/000493277 (2018).
Hefele, B., Langan, S. M., Pollins, K. & Gelfand, J. M. Engaging the patient’s perspective in clinical trials research. J. Invest. Dermatol. 139, 1217–1220. https://doi.org/10.1016/j.jid.2019.02.028 (2019).
Austin, L. et al. Providing “the bigger picture”: benefits and feasibility of integrating remote monitoring from smartphones into the electronic health record. Rheumatology (Oxford) 59, 367–378. https://doi.org/10.1093/rheumatology/kez207 (2020).
Matcham, F., Norton, S., Steer, S. & Hotopf, M. Usefulness of the SF-36 Health Survey in screening for depressive and anxiety disorders in rheumatoid arthritis. BMC Musculoskelet. Disord. 17, 224. https://doi.org/10.1186/s12891-016-1083-y (2016).
Salaffi, F., Carotti, M., Gasparini, S., Intorcia, M. & Grassi, W. The health-related quality of life in rheumatoid arthritis, ankylosing spondylitis, and psoriatic arthritis: A comparison with a selected sample of healthy people. Health Qual. Life Outcomes 7, 25. https://doi.org/10.1186/1477-7525-7-25 (2009).
Russell, A. S. Quality-of-life assessment in rheumatoid arthritis. Pharmacoeconomics 26, 831–846. https://doi.org/10.2165/00019053-200826100-00004 (2008).
Bowling, A., Bond, M., Jenkinson, C. & Lamping, D. L. Short Form 36 (SF-36) health survey questionnaire: Which normative data should be used? Comparisons between the norms provided by the omnibus survey in Britain, the health survey for England and the Oxford healthy life survey. J. Public Health Med. 21, 255–270. https://doi.org/10.1093/pubmed/21.3.255 (1999).
Hewlett, S., Dures, E. & Almeida, C. Measures of fatigue: Bristol Rheumatoid Arthritis Fatigue Multi-Dimensional Questionnaire (BRAF MDQ), Bristol Rheumatoid Arthritis Fatigue Numerical Rating Scales (BRAF NRS) for severity, effect, and coping, Chalder Fatigue Questionnaire (CFQ), Checklist Individual Strength (CIS20R and CIS8R), Fatigue Severity Scale (FSS), Functional Assessment Chronic Illness Therapy (Fatigue) (FACIT-F), Multi-Dimensional Assessment of Fatigue (MAF), Multi-Dimensional Fatigue Inventory (MFI), Pediatric Quality Of Life (PedsQL) Multi-Dimensional Fatigue Scale, Profile of Fatigue (ProF), Short Form 36 Vitality Subscale (SF-36 VT), and Visual Analog Scales (VAS). Arthritis Care Res. (Hoboken) 63(Suppl 11), S263-286. https://doi.org/10.1002/acr.20579 (2011).
Optum. SF-36v2 Health Survey, https://www.qualitymetric.com/sf-36v2-pro-health-survey-lp/ (2017).
Maska, L., Anderson, J. & Michaud, K. Measures of functional status and quality of life in rheumatoid arthritis: Health Assessment Questionnaire Disability Index (HAQ), Modified Health Assessment Questionnaire (MHAQ), Multidimensional Health Assessment Questionnaire (MDHAQ), Health Assessment Questionnaire II (HAQ-II), Improved Health Assessment Questionnaire (Improved HAQ), and Rheumatoid Arthritis Quality of Life (RAQoL). Arthritis Care Res. (Hoboken) 63(Suppl 11), S4-13. https://doi.org/10.1002/acr.20620 (2011).
Seror, R., Tubach, F., Baron, G., Guillemin, F. & Ravaud, P. Measure of function in rheumatoid arthritis: individualised or classical scales?. Ann. Rheum Dis. 69, 97–101. https://doi.org/10.1136/ard.2008.102137 (2010).
Becker, B. et al. Qualitative and psychometric approaches to evaluate the PROMIS pain interference and sleep disturbance item banks for use in patients with rheumatoid arthritis. J. Patient Rep. Outcomes 5, 52. https://doi.org/10.1186/s41687-021-00318-w (2021).
Delgado, D. A. et al. Validation of digital visual analog scale pain scoring with a traditional paper-based visual analog scale in adults. J. Am. Acad. Orthop. Surg. Glob. Res. Rev. 2, e088–e088. https://doi.org/10.5435/JAAOSGlobal-D-17-00088 (2018).
Nikiphorou, E. et al. Patient global assessment in measuring disease activity in rheumatoid arthritis: A review of the literature. Arthritis Res. Ther. 18, 251. https://doi.org/10.1186/s13075-016-1151-6 (2016).
Schwickert, L. et al. Inertial sensor based analysis of lie-to-stand transfers in younger and older adults. Sensors 16, 1277. https://doi.org/10.3390/s16081277 (2016).
Acknowledgements
This study was funded by GSK (GSK ID: 212295). The authors would like to thank all study participants for their time and generous contribution to the study. Editorial support (in the form of writing assistance, including preparation of the draft manuscript under the direction and guidance of the authors, collating and incorporating authors’ comments for each draft, assembling tables and figures, grammatical editing and referencing) was provided by Frankie Wignall, at Fishawack Indicia Ltd, part of Fishawack Health, and was funded by GSK.
Author information
Authors and Affiliations
Contributions
V.H. and C.L. were joint first authors and M.S.D. and R.W. were joint last authors. V.H., L.G.G., W.H.C., R.T., M.S.D., and R.W. contributed to the design of the study and towards the data analysis and interpretation. C.L., C.W.Y., P.B., and M.Y. were involved in the design of the study, and the data acquisition, analysis, and interpretation. A.M. and M.D. contributed to the design of the study. J.B. contributed to the data acquisition, analysis, and interpretation. E.A.M. was involved in patient recruitment. J.L. contributed to the data analysis and interpretation. All authors were involved in the development of the article and revising it critically for important intellectual content, and all authors approved the final version to be published.
Corresponding author
Ethics declarations
Competing interests
VH, LGG, AM, WHC, RT, and RW are employees of GSK and own stocks/shares in GSK and Haleon. CL, CWY, PB, JB, JL, MD, MY, and MSD are employees of Analysis Group, which received research funding from GSK to conduct the study. EAM is an employee of Reliant Medical Group, which received research funding from GSK to conduct the study.
Additional information
Publisher's note
Springer Nature remains neutral with regard to jurisdictional claims in published maps and institutional affiliations.
Supplementary Information
Rights and permissions
Open Access This article is licensed under a Creative Commons Attribution 4.0 International License, which permits use, sharing, adaptation, distribution and reproduction in any medium or format, as long as you give appropriate credit to the original author(s) and the source, provide a link to the Creative Commons licence, and indicate if changes were made. The images or other third party material in this article are included in the article's Creative Commons licence, unless indicated otherwise in a credit line to the material. If material is not included in the article's Creative Commons licence and your intended use is not permitted by statutory regulation or exceeds the permitted use, you will need to obtain permission directly from the copyright holder. To view a copy of this licence, visit http://creativecommons.org/licenses/by/4.0/.
About this article

Cite this article
Hamy, V., Llop, C., Yee, C.W. et al. Patient-centric assessment of rheumatoid arthritis using a smartwatch and bespoke mobile app in a clinical setting. Sci Rep 13, 18311 (2023). https://doi.org/10.1038/s41598-023-45387-7
Received:
Accepted:
Published:
DOI: https://doi.org/10.1038/s41598-023-45387-7
This article is cited by
Comments
By submitting a comment you agree to abide by our Terms and Community Guidelines. If you find something abusive or that does not comply with our terms or guidelines please flag it as inappropriate.
