
Abstract
This study presents the Enhanced Cheetah Optimizer Algorithm (ECOA) designed to tackle the intricate real-world challenges of dynamic economic dispatch (DED). These complexities encompass demand-side management (DSM), integration of non-conventional energy sources, and the utilization of pumped-storage hydroelectric units. Acknowledging the variability of solar and wind energy sources and the existence of a pumped-storage hydroelectric system, this study integrates a solar-wind-thermal energy system. The DSM program not only enhances power grid security but also lowers operational costs. The research addresses the DED problem with and without DSM implementation to analyze its impact. Demonstrating effectiveness on two test systems, the suggested method's efficacy is showcased. The recommended method's simulation results have been compared to those obtained using Cheetah Optimizer Algorithm (COA) and Grey Wolf Optimizer. The optimization results indicate that, for both the 10-unit and 20-unit systems, the proposed ECOA algorithm achieves savings of 0.24% and 0.43%, respectively, in operation costs when Dynamic Economic Dispatch is conducted with Demand-Side Management (DSM). This underscores the advantageous capability of DSM in minimizing costs and enhancing the economic efficiency of the power systems. Our ECOA has greater adaptability and reliability, making it a promising solution for addressing multi-objective energy management difficulties within microgrids, particularly when demand response mechanisms are incorporated. Furthermore, the suggested ECOA has the ability to elucidate the multi-objective dynamic optimal power flow problem in IEEE standard test systems, particularly when electric vehicles and renewable energy sources are integrated.
Introduction
Fossil fuel-fired power plants continue to be the primary method of generating electric power. The need to investigate alternative energy sources has increased due to the rapid rise in global electricity usage, the continuous depletion of fossil fuel reserves, and the growing environmental impact caused by the burning of fossil fuels in power plants1,2. Society's attention has been directed towards sustainable energy solutions due to the urgent need to reduce the negative effects of electricity generation on climate change3. Solar and wind power have become noticeable alternatives in this situation, acknowledged for their economic feasibility and ability to meet energy needs without causing harmful emissions4,5. However, the incorporation of these environmentally aware energy sources, such as wind and solar technologies, has brought about a level of intricacy and uncertainty in the energy sector. The emerging transition to renewable energy requires a detailed comprehension of the challenges associated to the inherent irregularity and fluctuation of solar and wind resources6. This requires a thorough examination of the dynamic properties that arise from integrating these renewable sources into the power grid. As the discussion about sustainable energy progresses, it is crucial to understand the complexities of utilizing solar and wind power to achieve their best possible integration into the overall energy system7. These insights are essential for progressing the discussion on sustainable energy usage and developing effective strategies to align the shift towards green energy with the needs of a reliable and robust power grid8. The load variation is unaffected by the unpredictability of solar irradiation and wind speed. These resources' unpredictability and sporadic nature present serious obstacles to solving the generation scheduling issue. The inherent variability and irregular characteristics of renewable energy sources, such as wind and solar power, present a potential risk to the stability and dependability of the power grid. This oscillating behavior, commonly known as "blinking," can have detrimental effects on the grid as a whole9,10. In order to address these challenges and improve the ability of the power grid to withstand disruptions, the incorporation of pumped hydroelectric energy storage is seen as a feasible solution11. Pumped-storage hydropower (PSH) units are widely recognized globally for their ability to effectively manage fluctuations in generation and supply. The growing popularity of PSH units arises from their inherent capacity to efficiently store electrical energy. Pumped-storage hydroelectric (PSH) units play a crucial role in the electric power systems by storing excess electrical energy, which is usually available and cost-effective during low-demand periods, as hydraulic potential energy12. This complex procedure entails the movement of water from the lower reservoir of the PSH unit to its upper reservoir. During times of high demand, the stored hydraulic potential energy is used to meet the increased load requirements, thereby assisting to maintain stability in the power grid. PSH units, operating on a daily or weekly basis, provide an efficient solution to mitigate the effects of renewable energy intermittency on the power grid13. Implementing Pumped Storage Hydro (PSH) units results in a gradual decrease in the overall fuel expenditure in a power system. The cost-effectiveness of this approach is due to the strategic placement of PSH units, which helps to stabilize fluctuations in energy supply and demand and optimize the operation of the power system14. Overall, the integration of pumped hydroelectric energy storage, demonstrated by PSH units, is an effective approach to mitigate the intermittent nature of renewable energy sources. By utilizing the storage capabilities of PSH, the power grid can attain heightened stability, decreased operational expenses, and enhanced flexibility to accommodate the ever-changing landscape of renewable energy generation15,16.
A modest sovereign system's optimal generation scheduling using renewable energy sources has been covered in17. Although clean and pollution-free, renewable energy sources have a limited ability to provide electricity. The optimal approach to address the economic dispatch quandary lies in dynamic economic dispatch (DED). This approach efficiently distributes the time-varying load demand across all active generating units, while taking into account the limitations presented by thermal generator ramp rates18. In the realm of Dynamic Economic Dispatch (DED), decisions made at one time significantly influence subsequent decisions. Addressing this, a novel Enhanced Non-Dominated Sorting Crisscross Optimization (ENSCSO) algorithm was introduced to solve the multi-objective Dynamic Economic Emission Dispatch problem19. This algorithm was tested via simulations on a ten-unit generation system that integrates wind power and a time-of-use demand response program. Ameliorated dragonfly algorithm (ADFA) was applied to solve static economic load dispatch and dynamic economic load dispatch problem in20. Static economic dispatch was carried out on three different test systems and dynamic economic dispatch was implemented on two different test systems. In21, a Levy Interior Search Algorithm was crafted with a focus on resolving the multi-objective economic load dispatch issue, integrating the incorporation of wind power. The objective functions considered were operation cost and system risk. A simulation was conducted using a modified IEEE 30-bus system, incorporating the integration of wind power. A distributed structure and stochastic linear programming game were presented, allowing for the scheduling of appliances and storage units as well for the energy payments in22. A distributed primal–dual continuous time consensus algorithm was implemented for solving dynamic economic dispatch problem23. Simulation was carried out on three different test systems. An improved version of Circle Search Algorithm was introduced in ref.24 to resolve the economic emission dispatch problem by incorporating demand response integration. Improved circle search algorithm was investigated on IEEE 6-bus and IEEE 30-bus system to implemented the multi-objective economic emission dispatch25. In26, multi-objective particle swarm optimization was proposed to solve the dynamic economic emission dispatch problem. Within the Demand-Side Management (DSM) process, a strategy utilizing day-ahead load shifting techniques was implemented to manage residential loads. The primary objective involved minimizing the utility's energy bill. The application of the Interior Search Algorithm was utilized to address the economic load dispatch problem within a microgrid setting, as referenced in27. Multi-objective dynamic optimal power flow problem was implemented using harmony search algorithm. In27, the day-ahead load shifting DSM technique was enacted using a day-ahead pricing strategy combined with an energy consumption game. Additionally, in28, the successful implementation of the normal boundary intersection method effectively addressed the centralized multi-objective dynamic economic dispatch incorporating demand side management for individual residential loads and electric vehicles. Generation costs, emissions, and energy loss are considered as objective functions. A suite of innovative optimization algorithms was developed to tackle various complex challenges within energy management systems. In29, the Improved Mayfly Optimization Algorithm was devised to solve the combined economic emission dispatch problem within a microgrid setting. Ref.30 introduced the Chaotic Fast Convergence Evolutionary Programming (CFCEP) aimed at resolving the combined heat and power dynamic economic dispatch problem. This solution incorporated demand side management, renewable energy sources, and pumped hydro energy storage. The Social Group Entropy Optimization (SGEO) technique, highlighted in reference31, was proposed to address the fuel-constrained dynamic economic dispatch problem. This strategy combined demand-side management, renewable energy sources, and a pumped hydro storage plant. It implemented a Multi-Objective Dynamic Economic Emission Dispatch by incorporating game theory-based demand response techniques32. Lastly, in ref.33, a Multi-Objective Dynamic Economic Emission Dispatch approach was applied within a microgrid context. This implementation incorporated demand response strategies along with a zero-balance approach.
As outlined in the International Energy Agency's strategic plan, DSM stands as the major choice for energy policy decisions. DSM programs offer various advantages, such as cost reduction and heightened security within power systems. Here's an overview of the ongoing research contributions in this domain:
-
1.
In our research paper, we introduce the Enhanced Cheetah Optimizer Algorithm (ECOA) to address dynamic economic dispatch while integrating renewable energy sources and demand side management. We've integrated chaotic sine map and levy flight mechanism and into this algorithm to improve solution quality and convergence speed. This learning method involves simultaneously considering an estimate and its opposite counterpart, aiming to refine the current candidate solution more effectively.
-
2.
The inherent variability of wind and solar power generators is depicted through the utilization of the most reliable probability density functions (PDFs).
-
3.
The alteration in the generation costs of wind and solar power in relation to the respective scheduled power adjustments is thoroughly investigated.
-
4.
We subjected our proposed algorithm to a comprehensive evaluation to assess its effectiveness in addressing dynamic economic dispatch challenges associated with pumped-storage hydroelectric units and demand-side management. The ECOA algorithm we introduced plays a vital role in determining optimal times for both pumping water to the upper reservoir and releasing it for power generation, taking into consideration factors such as electricity prices, demand patterns, and the availability of renewable energy.
-
5.
The algorithm we proposed was thoroughly examined for its efficacy in resolving dynamic economic dispatch problems involving unconventional energy sources and demand side management. We compared the optimization results of our proposed algorithm with those obtained using COA and GWO for comprehensive analysis.
Mathematical formulation of dynamic economic dispatch
The primary aim of integrating renewable energy sources into the Dynamic Economic Dispatch (DED) system is to achieve a dual objective of minimizing two factors simultaneously34. The primary objective is to minimize the overall expenses linked to thermal power plants by enhancing their operating efficiency. Furthermore, the integration aims to reduce costs associated with the functioning of wind-power producing units and solar Photovoltaic (PV) facilities. This extensive framework of DED expands its scope to incorporate the integration of pumped hydroelectric energy storage, acknowledging its crucial role in mitigating the intermittent nature of renewable energy sources35,36. The study attempts to achieve an efficient and cost-effective balance between traditional and renewable energy sources within the dynamic economic dispatch framework using this integrated method37.
The formulation of the DED problem with DSM encompasses defining the resultant objective function along with its associated constraints. The fuel cost function for the ith thermal generator at time \(t\), accounting for the valve-point effect38,39, is expressed as:
where \(a_{i}\), \(b_{i}\) and \(c_{i}\) are fuel cost coefficients of \(i^{th}\) generator, k is the total number of generating units, \(P_{Gi}\) is the output power of the \(i^{th}\) generator in megawatts. Here \(e_{i}\) and \(f_{i}\) represents the generating cost coefficients of the \(i^{th}\) unit are utilized to model valve point loading effect.
Modelling the costs of renewable energy sources
Assessment of direct costs for wind and solar photovoltaic power
The functioning of energy generation from RESs doesn't require any fuel. Hence, in cases where Independent System Operators (ISO) own Renewable Energy Sources (RESs), only maintenance costs are incurred without any associated cost function40. Yet, if private organizations manage RESs, the ISO compensates them as per the mutually agreed-upon contract for the scheduled electricity generation40.
The assessment of direct costs for wind turbines and solar photovoltaic (PV) power involves a detailed examination of the expenses associated with the design, construction, installation, operation, and maintenance of these renewable energy systems41,42. Direct costs are those directly attributable to the development and operation of the specific technology.
The literature offers the direct cost function for the \(ith\) wind farm concerning the planned power40.
Here, \(P_{W}\) represents the generated power and \(K_{W}\) represents the direct cost coefficient related to the wind turbine. In connection with is, the direct cost involved in solar PV with scheduled power \(P_{PV}\) and cost coefficient, \(K_{PV}\) is represented by the following equation
In this context, \(P_{PV}\) denotes the generated power, while \(K_{PV}\) represents the direct cost coefficient associated with solar photovoltaic generation.
Assessment of reserve cost and penalty cost associated with wind power
As wind energy is inherently unpredictable, the power generated by wind turbines fluctuates over time, potentially surpassing or falling short of the scheduled power43. Therefore, the ISO needs to have backup generating capacity to meet demand. The assessment of reserve cost and penalty cost associated with wind power involves evaluating the expenses and penalties incurred due to the intermittent and variable nature of wind energy. Reserve costs and penalty costs are critical aspects in the economic evaluation and operational planning of power systems that include wind power44.
The reserve cost for the wind unit is presented based on the literature40.
When wind generators produce more output power than is scheduled, the ISOs must pay the fine by reducing the power of thermal generators when they do not consume the extra power.
Here \(P_{W \;sh,i}\) represents the scheduled wind power and \(P_{W\; ac,i}\) represents the actual power generated by the wind turbine. The rated power is represented by \(P_{W\; r,i}\) while the Probability Density Function (PDF) of the wind power is represented as \(f_{w} \left( {p_{w,i} } \right)\). Accordingly, it is possible to compute the reserve and penalty costs for solar-only and solar-and-hydro combined generators45. The required input data for modeling the cost of renewable energy sources is obtained from existing literature30.
Assessment of the penalty and reserve cost associated with PV power
Assessing the cost of generating wind power aligns closely with formulating the stochastic generation cost of solar PV electricity40. Moreover, the lognormal Probability Density Function (PDF) proves useful in representing solar radiation40. Additionally, reserve and penalty cost models for solar PV-powered plants are devised based on the methodology outlined in Reference46. Section 2.3 does the computation for the solar photovoltaic unit's generated power output. The assessment of reserve cost and penalty cost associated with photovoltaic (PV) power involves evaluating the expenses and penalties incurred due to the intermittent and variable nature of solar energy. Reserve costs and penalty costs are critical aspects in the economic evaluation and operational planning of power systems that include solar PV.
The reserve cost for overestimating solar PV power is characterized as40:
where \(P_{PV\; ac,i}\) represents the actual power generated by the solar PV plant, and \(k_{rpv,i}^{\prime }\) denotes the reserve cost coefficient related to the solar PV plant. The expectation of solar PV power below P_ is represented by \(E\left( {P_{PV \;ac,i} < P_{PV\; sh,i} } \right)\), and the likelihood of a solar power shortage from the scheduled solar PV power is given by \(f_{pv} \left( {P_{PV\; ac,i} < P_{PV\; sh,i} } \right).\) The cost of the penalty for underestimating solar PV power is characterised as40:
where \(k_{ppv,i}^{\prime }\) represents the penalty cost coefficient for the solar PV plant and \(f_{pv} \left( {P_{PV\; ac,i} > P_{PV \;sh,i} } \right)\) characterizes the likelihood that solar power will be above the scheduled power (\(P_{PV \;sh,i}\)), and \(E\left( {P_{PV\; ac,i} > P_{PV\; sh,i} } \right)\) indicates the expectation that solar PV power will be above \(P_{PV \;sh,i}\).
Formulation of overall generation cost with the integration of renewable energy sources
The overall operation cost is a critical metric that reflects the economic efficiency of the power system operation. The overall operation cost considers the intermittent nature of renewable energy sources, accounting for periods of high and low generation, and the associated economic implications.
The overall operation cost within the DED problem is structured as follows30,40:
Minimize
Equality and inequality constraints
Equality constraints
Generator power output constraint
The total power generation, when combined with demand-side management, can be expressed through the following Eq30:
where \(N_{TH}\), \(N_{W}\), \(N_{PV}\) and \(N_{pump}\) denotes the quantity of thermal power units, wind power units, solar photovoltaic units, and pumped storage units, respectively. The power generated by the ith thermal, wind, solar photovoltaic, and pumped storage units is represented as \(P_{Gi}\), \(P_{Wi}\), \(P_{PVi}\) and \(P_{GHi}\) respectively.
In order to achieve optimal economic load dispatch, one must include transmission line losses. The transmission line losses are calculated using Newton–Raphson methods and B-coefficient methods. In order to calculate the active power loss \(P_{loss} .\) Newton–Raphson method is used in conjunction with the power flow solution. The subsequent equation defines the actual power loss while adhering to equality prerequisites40.
With \(j = 1, 2, \ldots NB\); in this case, \(NB\) represents the total number of buses. \(V_{j}\) and \(V_{k}\) represents the \(jth\) bus and \(kth\) bus voltage respectively. \(Q_{gj}\) denotes the \(jth\) bus reactive power output and \(\delta_{j}\) and \(\delta_{k}\) characterizes the voltage angle at bus \(j\) and bus \(k\) respectively.\(B_{jk}\) and \(G_{jk}\) represents the transfer susceptance and conductance between buses j and \(k\) respectively. \(P_{Dj}\) and \(Q_{Dj}\) represents the \(jth\) bus active and reactive power load respectively. In order to determine the equality constraints, the Newton–Raphson load flow technique solution is used. Bus voltage magnitudes and angles can be determined using the power flow solution.
Inequality constraints
Limits on the lowest and highest generation capacities
Each generator's active power generation output needs to stay within specific minimum and maximum limits40. Power generation constraints refer to the limitations and restrictions imposed on the operation of power generation units over time. These constraints are crucial for ensuring the secure and reliable operation of the power system.
Pumped-storage constraints
The integration of pumped-storage hydro units adds a dynamic and flexible component to the system, enabling better balancing of supply and demand.
The net water usage of the pumped-storage hydropower (PSH) unit should balance out to zero as the final and initial water volumes in the upper reservoir are considered equal within this scenario30.
Given the equality between the initial and final water volumes of the upper reservoir in the pumped-storage hydroelectric (PSH) unit for this scenario, the total net water used by the PSH unit should equate to zero30.
Ramp rate limits of thermal generator
The ramp rate limits of thermal generators are crucial parameters in power system operation and control. The ramp rate refers to the maximum rate at which the power output of a generator can change over a specified time interval. Rapid and large changes in power output from generators can lead to instability in the power grid. By imposing ramp rate limits, the system operators ensure that the changes in power output are gradual, helping to maintain grid stability.
Wind, solar and hydro uncertainty models
To represent the unpredictable output power from Renewable Energy Sources (RESs), a range of Probability Density Functions (PDFs) are utilized.
The wind speed determines how much power the wind turbines can produce. According to past research investigations40,46, the likelihood of wind speed follows Weibull PDF.
The Weibull distribution is commonly used in the field of wind energy because it is well-suited for modeling the variability of wind speeds at a particular location.
where \(\alpha\) represents the scale of the Weibull PDF and stands for the shape parameter of the Weibull PDF. These variables' values were collected from30. Weibull PDF's median is provided by:
The gamma (\(\Gamma )\) function is crucial in the context of the Weibull probability density function (PDF) for wind distribution because it is used to normalize the Weibull distribution and ensure that it integrates to 1 over its entire range.
\(\Gamma\) function can be represented as:
As shown in Fig. 1, the frequency distribution is derived from Weibull fitting using wind speed results obtained through simulating 8000 Monte Carlo scenarios. The values for the scale and shape parameters are sourced from30. Consistent with the literature30, the PDF parameter values have been selected. Achieving a cumulative rated output of 175 MW involves the collective output from 35 wind generators, each possessing a capacity of 5 MW. The subsequent equation delineates the power generated by the wind turbines, contingent upon the wind speed.
where \(P_{{W_{r} }}\) denotes the rated power of a single turbine. \(v_{in}\) signifies the cut-in speed, \(v_{out}\) denotes the cut-out speed whereas \(v_{r}\) is the rated speed. The study investigated different Weibull parameters that dictate the distribution of wind speeds, in line with the selections made in previous studies30. Equation (40) emphasizes the discrete nature of the wind generator's output power, notably in specific regions. Specifically, wind farm output remains at zero when wind speed falls below the cut-in speed or exceeds the cut-out speed. The wind generators operate at their rated power within the range delineated between the cut-out and cut-in regions. Previous studies30,40 detail the probability associated with these discrete zones.

Wind speed variation in wind power generation unit.
In the continuous domain, the probability distribution for wind power is expressed as follows40,46:
This Weibull PDF is utilized to characterize and model the probability distribution of wind speeds, which is crucial for assessing the potential power output of wind turbines.
Furthermore, the solar photovoltaic (PV) output power is solely contingent on solar irradiance (G), conforming to the parameters of the lognormal Probability Density Function (PDF)40,46. A previous study40 outlined the probability distribution of solar irradiance, specifying its mean and standard deviation. The lognormal distribution is often used in PV modeling because it provides a good fit for the skewed and positive-valued nature of solar irradiance and power output data. Many natural processes, including solar irradiance, exhibit lognormal characteristics, making the lognormal distribution a suitable choice for modeling. The lognormal distribution is well-suited for data with a positively skewed distribution, capturing the asymmetric behavior often observed in solar irradiance data. The parameters in the lognormal distribution have physical interpretations, such as the mean and standard deviation, which can provide insights into the characteristics of the solar resource.
The subsequent equation represents the mean of the lognormal distribution (\(M_{Lgn}\))
After running 8,000 Monte Carlo simulations, a frequency distribution for solar irradiance is derived, and Fig. 2 illustrates the lognormal fitting, demonstrating the solar PV output power.

Distribution of solar irradiance for solar PV.
The critical value (\(R_{C} )\) introduces a threshold beyond which the model transitions to a simpler form. This threshold may represent a point where the PV system behavior changes, possibly due to system constraints, saturation effects, or other factors.
In the standard environmental conditions, standard deviation of solar irradiance is represented by \(G_{std}\) and certain irradiance is characterized by \(R_{C}\). The assumed value for \(G_{std}\) stands at 1000 W/m2, whereas for \(R_{C}\), it amounts to 150 W/m2. Regarding the PV module, the rated output power \(P_{PVr}\) is specified as 175 MW.
Demand-side management
DSM initiatives bring forth numerous benefits such as cost efficiency and improved power system security47. These programs encompass various categories, prominently featuring demand response. Among these, the time-of-use (TOU) program48 stands out—it redistributes a segment of the load demand from peak hours to off-peak periods or times of lower cost, while maintaining the overall load demand. This TOU program served as the foundational inspiration for the demand response program applied in this study. This flattens the load curve and lowers the expected operation cost. The numerical model for the TOU program is created in line with Eq. (35) and is constrained by Eqs. (36) - (39).
Enhanced Cheetah optimizer algorithm
Akbari et al.49 introduced the COA algorithm, drawing inspiration from the hunting techniques of cheetahs. This method integrates three primary strategies: prey search, ambush tactics, and active attacks. Significantly, it implements a mechanism to navigate away from a prey location and return to a home position, effectively avoiding entrapment in local optimal points. Each cheetah's potential hunting patterns correspond to potential solutions for the problem at hand. The algorithm operates on the premise that the population's best position determines the optimal solution, akin to identifying the prey. Cheetahs adapt their hunting patterns to enhance their performance over the hunting period. By mimicking these strategies, the COA algorithm49 effectively seeks optimal solutions for intricate problems.
When a cheetah scans its surroundings, it can detect potential prey, giving it the option to either wait for the prey to approach or to initiate an immediate attack upon spotting it. The attack itself involves two distinct phases: a rapid approach followed by capture. However, several factors might prompt the cheetah to abandon the hunt, such as low energy reserves or if the prey is too agile. In such scenarios, the cheetah might retreat to its resting spot, preparing for a fresh hunting opportunity. The cheetah carefully assesses the prey's condition, the environment, and the distance involved before choosing between these strategies. The COA algorithm encapsulates this entire hunting process, relying on the strategic utilization of these tactics across multiple hunting cycles or iterations49. Essentially, the COA algorithm leverages these intelligent hunting strategies iteratively throughout the hunting process.
-
i.
Searching: Cheetahs engage in scanning or active search within their territories or the surrounding area to locate prey within the search space.
-
ii.
Sitting-and-waiting: Upon detecting prey but under unfavorable conditions, cheetahs may opt to sit and wait, allowing the prey to approach or for a better opportunity to arise.
-
iii.
Attacking: This strategy involves two crucial phases:
-
a.
Rushing: Once committed to an attack, cheetahs sprint toward the prey at maximum speed.
-
b.
Capturing: Leveraging speed and agility, cheetahs capture the prey by closing in swiftly.
-
a.
-
iv.
Returning home and leaving prey: This strategy comes into play under two circumstances. Firstly, if the cheetah fails to catch its prey, it may choose to relocate or return to its territory. Secondly, when a certain time lapses without successful hunting, the cheetah may reposition itself to the last known prey location and conduct further searches in that area49. Detailed mathematical models for these hunting strategies are expounded upon in subsequent sections.
The CO algorithm has demonstrated strong capabilities in tackling expansive problems. However, as the upcoming experimental results will demonstrate, there remains an opportunity for improvement in terms of convergence speed and computational time, particularly when fine-tuning the parameters of photovoltaic models. To overcome these limitations, we present an upgraded iteration of the COA algorithm tailored explicitly to tackle these drawbacks.
Searching strategy
In the exploration phase of the COA algorithm, each cheetah adjusts its position by referencing its prior location. Cheetahs commonly follow the lead of the leader within their group. Expanding upon this notion, the search approach detailed in Eq. (16) is adapted based on the position of the group's second-best cheetah, designated as \(X_{L,j}^{t}\), influencing the modification process. This adjustment is detailed as follows50:
where the randomization parameter (\(\hat{r}^{t}\)) and the random step length (\(\alpha_{i,j}^{t}\)) undergo modifications as follows:
The value of the randomization parameter (\(\hat{r}^{t}\)) in Eq. (40) can be ascertained through the implementation of a sine map, where the initial values for \(C_{t}\) and \(a\) are specifically set at 0.36 and 2.8 as indicated in reference51.
where \(t\) represents the current iteration number.
The random step length (\(\alpha_{i,j}^{t}\)) can be represented as
Here \(X_{{k^{\prime},j}}^{t}\) and \(X_{{i^{\prime},j}}^{t}\) are the positions of \(kth\) and \(ith\) cheetahs in the sorted population, respectively.
Emphasizing the alignment of every cheetah's position around the group leader plays a crucial role in the local search phase. Furthermore, the second term in Eq. (40) enhances solution diversity, actively aiding in the global search or exploitation phase. In addition, introducing substantial strides during the hunting phase via the random parameter extends solutions beyond variable ranges. Subsequently, these are substituted by fresh random solutions within the population. This dual purpose not only broadens the spectrum of solutions but also shields the algorithm from being stuck in local optimum points.
Attacking strategy
To bolster the optimization capabilities of COA algorithm, the researcher crafted the Enhanced Cheetah Optimizer (ECOA) algorithm. This new approach combines principles inspired by Levy flights, mirroring the flight patterns observed in birds. Adopting a Levy flight-based approach for system identification offers expedited convergence without relying on derivative information40. This method employs stochastic random searches based on Levy flight concepts52. Integrating the Levy flight approach bolsters local search capabilities, mitigating the risk of local entrapment for the optimal solution52.
Furthermore, the attacking strategy within the ECOA algorithm undergoes reformulation as follows40:
where σ can be calculated as40:
The function \(\Gamma \left( x \right)\) represents the factorial of (x-1), while \(r_{1}\) and \(r_{2}\) denote indiscriminate numbers within the range of \(\left[ {0,1} \right].\) For \(1 < \beta \le 2\), a constant value (e.g., 1.5) for \(\beta\) is specifically applied in this research49. The symbol \(Levy\left( \lambda \right)\) signifies step length, employing the Levy distribution characterized by infinite variance and a mean of \(1 < \lambda < 3\). \(\lambda\) serves as the distribution factor, with \(\Gamma \left( . \right)\) representing the gamma distribution function.
Within the COA algorithm, the interaction factor considers the position of neighbouring cheetahs. Ordinarily, cheetahs hunt individually, adapting their positions in response to their prey's whereabouts. Therefore, in this newly suggested attack strategy, each cheetah adjusts its position relative to the prey during the attack phase, advancing toward it following this formula50:
This refined attack strategy significantly accelerates the COA algorithm's ability to approach near-optimal solutions swiftly. It bolsters the algorithm's local search prowess (exploitation phase), thus amplifying its convergence speed. Figure 3 showcases the schematic of the enhanced Cheetah Optimizer Algorithm as proposed.
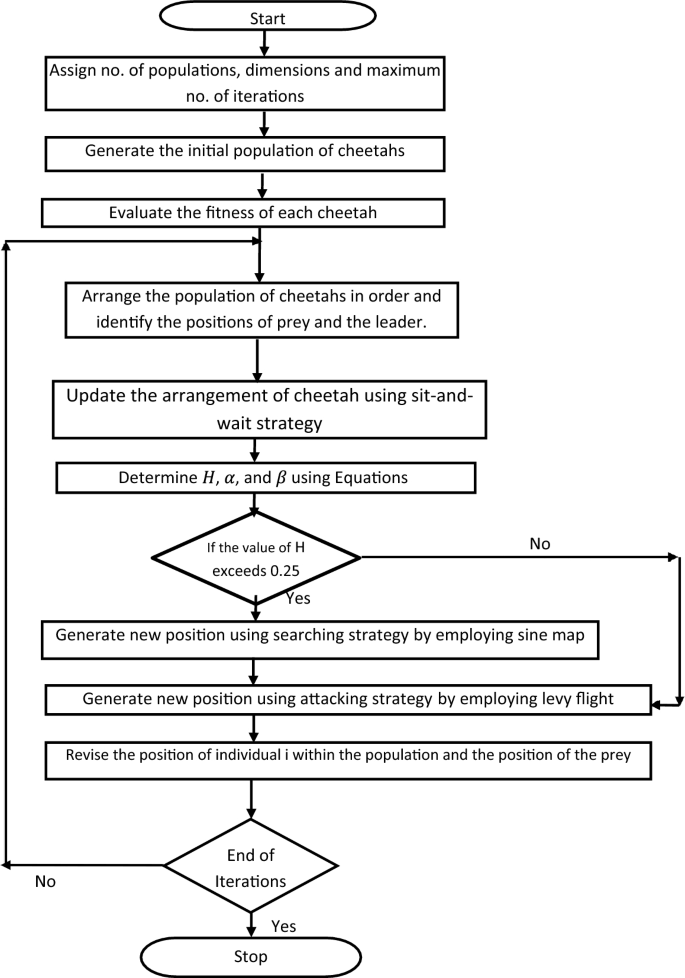
Flowchart of the proposed enhanced cheetah optimizer algorithm.
Results and discussion
Test system: I
The proposed approach has been deployed to address the dynamic economic dispatch problem, both with and without DSM. To gauge its effectiveness, optimization outcomes were compared against COA, GWO, CFCEP30, FCEP30, CCDE30, and HSPSO30. The MATLAB 9.12 software was utilized to implement the ECOA, COA, and GWO53 models on a Laptop with an AMD Athlon processor, 1 TB storage, and 3.0 GHz processing speed. The test system encompasses 10 thermal power plants, one equivalent wind turbine, a solar photovoltaic plant, and a pumped-storage hydroelectric plant. The scheduling spans 24 intervals, considering the valve-point loading effect on thermal generators. The input data, including bus data, PDF parameters, and cost coefficients, were gathered from a preceding study30. Notably, during intervals 11, 12, and 13, peak loads are identified, prompting DSM to redistribute 10% of the load from these hours to the 2nd, 3rd, and 4th intervals. It's important to note that the pumped-storage hydroelectric (PSH) plant operates in generating mode specifically when both the power generated and discharge rate are positive. Conversely, it functions in pumping mode when pumping power and pumping rate are negative30.
The Weibull PDF parameters in this case are chosen from Ref.30. The direct cost coefficients, penalty cost coefficients, and reserve cost coefficients for wind power are sourced from literature30. Notably, the direct cost of renewable power is lower than the average cost of thermal power. Additionally, the penalty incurred for underutilizing available wind power is less than the direct cost40. Examining the scheduled power range from 0 to the wind farm's rated power, Fig. 4 illustrate the variations in reserve, penalty, direct, and total costs for the two wind farms. The total cost comprises the combined direct, reserve, and penalty costs corresponding to the scheduled power. The direct cost shows a linear relationship with scheduled power; as scheduled power rises, a larger spinning reserve becomes necessary, leading to increased reserve costs and consequently driving up the overall generation cost. The penalty cost decreases, albeit at a slower rate, as scheduled power increases. Similarly, the cost variations for solar power over/under-estimation against scheduled power are portrayed in Fig. 5. The yearly operating and maintenance costs for solar PV power plants align within a comparable range to those of onshore wind power plants30. Lognormal PDF parameters for solar irradiance are adopted from Ref.30 as well. Furthermore, the direct cost coefficients, penalty cost coefficient, and reserve cost coefficient for solar power are also referenced from literature30. Yet, using the chosen PDF parameters for solar irradiance, the overall cost of solar power doesn't follow a strictly upward trajectory.

Variation in the cost of wind power relative to scheduled power for wind generators.

Fluctuation in the cost of solar power versus scheduled power for solar PV units.
The solar PV plant's stochastic power output is shown as a histogram in Fig. 6. The solar PV system's scheduled electricity delivery to the grid is shown by the red dotted line. As previously said, the schedule power can be any amount of electricity that ISO and the owner of the solar PV firm mutually agreed upon. Figure 7 represents the stochastic power generated by the wind farm. The red dotted line represents the scheduled electricity delivery to the grid by the wind farm. Tables 1 and 2 presents the optimal scheduling of the ten-unit system with and without DSM respectively. The best, average and worst cost and average CPU time among 100 runs of solutions acquired from the proposed ECOA, COA and GWO with and without DSM are summarized in Table 3. It is observed from Table 3 that execution time for ECOA algorithm is lesser compared to COA, GWO, HSPSO, CCDE, FCEP and CFCEP. Reduced computation time enables more effective implementation of demand-side management strategies since quick response times are essential for implementing demand response programs, load shedding, or load shifting, contributing to improved demand-side management and grid reliability. Furthermore, faster computation facilitates better integration of variable renewable energy sources by adapting quickly to their inherent variability.

Distribution of real power (MW) from solar PV.

Distribution of real power (MW) from wind farm.
Figures 8 and 9 illustrate the cost convergence patterns obtained from the proposed ECOA, COA, and GWO algorithms, both with and without DSM.

Characteristics of convergence in a 10-unit system without DSM.

Characteristics of convergence in a 10-unit system with DSM.
It is apparent from Fig. 8’s convergence characteristics that the proposed ECOA algorithm achieves convergence after 163 iterations in the context of dynamic economic dispatch with demand-side management. In comparison, the conventional COA and GWO algorithms converge at the end of 167 and 172 iterations, respectively. It is evident from Fig. 8 that the convergence behavior indicates the proposed ECOA algorithm reaches convergence after 170 iterations, while the conventional COA and GWO algorithms converge at the conclusion of 173 and 180 iterations, respectively. The findings suggest that the convergence of the proposed ECOA was not only swift but also exhibited a smoother trajectory compared to COA and GWO. Table 3 reveals that the operational cost is minimized when dynamic economic dispatch incorporates Demand-Side Management (DSM), as opposed to dynamic economic dispatch without DSM. Furthermore, the cost derived from the proposed ECOA remained the most economical among all methods. The achieved mean cost value closely approached the minimum, showcasing ECOA's competence in reaching global optimal solutions. Moreover, Table 3 reveals that the proposed ECOA algorithm exhibits a lower standard deviation in comparison to COA and GWO. This reduced standard deviation suggests greater stability and consistency in the performance of the ECOA algorithm, highlighting its potential for reliable and predictable outcomes. Due to space limitations, results acquired from COA and GWO53 cannot be given here. A sensitivity analysis was performed based on 100 trial test runs. Table 4 displays the results of the sensitivity analysis conducted for the proposed ECOA algorithm applied to Test System I and II. The results lead to the conclusion that a population size of 30 for the provided test system yields the global optimum for the test system—I. Consequently, the simulation outcomes firmly support the conclusion that the ECOA algorithm, as introduced in this study, holds significant potential for delivering high-quality solutions when contrasted with alternative algorithms.
Test system: II
This system comprises twenty thermal power plants, two similar wind power generation units, two equivalent solar photovoltaic (PV) facilities, and two pumped-storage hydroelectric plants. The data for this test system are derived by mirroring the information from test system 1. Notably, the power demand in this configuration is twice that of test system 1. Specifically, hours 11, 12, and 13 represent peak load periods. During Demand-Side Management (DSM), 10% of the load during the 11th, 12th, and 13th hours is shifted to the 2nd, 3rd, and 4th hours. The optimal scheduling of the 20-unit system with and without DSM respectively for the 20-unit system is presented in Tables 5 and 6. Tables 5 and 6 provides an analysis of the best, average, and worst costs and average CPU time for 100 runs of solutions obtained from the proposed ECOA, COA and GWO with and without DSM. Table 7 reveals that the computational time for the ECOA algorithm is notably shorter than that of COA, GWO, HSPSO, CCDE, FCEP, and CFCEP algorithms. This accelerated computational speed enables swift decision-making in the face of dynamic system conditions, including abrupt shifts in demand or renewable energy generation. Additionally, the proposed ECOA algorithm adeptly harnesses available renewable energy while safeguarding system stability, thereby optimizing the equilibrium between conventional and renewable generation. Furthermore, faster algorithms may require fewer computational resources, making them more efficient and cost-effective for implementation on various hardware platforms, including embedded systems or edge devices.
Figures 10 and 11 show the cost convergence characteristics obtained from planned ECOA, COA, and GWO54 with and without DSM respectively. It is evident from Fig. 10’s convergence characteristics that the proposed ECOA algorithm achieves convergence after 221 iterations, while the conventional COA and GWO algorithms converge at the end of 226 and 230 iterations, respectively. It is noted from Fig. 11 that the convergence characteristics indicate the proposed ECOA algorithm achieves convergence after 193 iterations in the scenario of dynamic economic dispatch with demand-side management. In contrast, the conventional COA and GWO algorithms converge at the conclusion of 215 and 217 iterations, respectively. According to the findings, the proposed ECOA's convergence characteristic was faster and smoother than those of COA and GWO. Table 6 showcases that the inclusion of DSM results in lower costs compared to scenarios without DSM. Furthermore, among all the approaches, the proposed ECOA exhibits the most economical cost. The achieved mean cost value was close to the lowest value. Table 7 illustrates that, in comparison to COA and GWO, the proposed ECOA algorithm displays a diminished standard deviation. This decrease in standard deviation implies enhanced stability and consistency in the performance of the ECOA algorithm, underscoring its potential for delivering reliable and predictable outcomes. This proves that ECOA has the efficacy to create a global optimal solution. The findings from COA and GWO cannot be presented here due to space restrictions. The outcomes of the sensitivity analysis for the proposed ECOA algorithm on Test System I and II are presented in Table 4. These results indicate that, for Test System II, a population size of 45 results in the global optimum. Based on the simulation outcomes, it is evident that the ECOA algorithm proposed in this study possesses a greater probability of generating superior-quality results compared to alternative algorithms.

Characteristics of convergence in a 20-unit system without DSM.

Characteristics of convergence in a 20-unit system with DSM.
Conclusion and future research directions
The current study introduces an enhanced Cheetah Optimizer Algorithm that addresses the unpredictability of renewable energy sources and the involvement of pumped-storage hydroelectric units. This enhancement serves as a practical solution for real-life Distributed Energy Dispatching (DED) scenarios, both with and without Demand-Side Management (DSM). The proposed ECOA, COA and GWO are used to resolve two test systems. Optimization results indicate that the operational expenses associated with Demand-Side Management (DSM) are lower compared to those incurred without its implementation. Furthermore, research indicates that the introduced ECOA algorithm surpasses COA and GWO in performance metrics. The proposed ECOA approach exhibits adaptability and reliability, making it a viable solution for tackling multi-objective energy management challenges within a microgrid, especially when integrating demand response mechanisms. Future endeavors will involve exploring the capabilities of the enhanced cheetah optimization algorithm in addressing multi-objective optimization problems that encompass constraints. This investigation will specifically focus on navigating the trade-offs between conflicting objectives and constraints. Additionally, there is an opportunity to delve into hybridization with other optimization techniques, aiming to enhance convergence speed and improve solution accuracy. The suggested ECOA can be analyzed for its application in realizing the multi-objective optimal operation of bipolar DC microgrids. Furthermore, the suggested ECOA can be applied to elucidate the multi-objective dynamic optimal power flow problem in multi-microgrid systems which involve the integration of electric vehicles and renewable energy sources.
Data availability
The datasets used and/or analysed during the current study available from the corresponding author on reasonable request.
Abbreviations
- \(F\left( {P_{G} } \right)\) :
-
Total generating cost
- \(t\) :
-
Time
- \(P_{Wi}\) :
-
Power generated by the ith wind power generating unit
- \(P_{PVi}\) :
-
Power generated by the ith solar power generating unit
- \(P_{GHi}\) :
-
Power generated by the ith pumped hydroelectric storage unit
- \(P_{loss}\) :
-
Active power loss
- \(C_{W}\) :
-
Direct cost function for wind farm
- \(C_{PV}\) :
-
Direct cost function for solar photovoltaic generation
- \(C_{{R_{W} }}\) :
-
Reserve cost for the wind unit
- \(C_{{R_{PV} }}\) :
-
Reserve cost for the solar photovoltaic generation
- \(P_{W r,i}\) :
-
Rated wind power of ith wind power generating unit
- \(P_{PV r,i}\) :
-
Rated wind power of ith solar power generating unit
- \(F_{C}\) :
-
Overall operation cost
- \(P_{Gi}\) :
-
Real power output of ith generator
- \(P_{D}\) :
-
Power demand
- \(P_{loss}\) :
-
Active power loss
- \(N_{TH}\) :
-
No. of thermal power generating units
- \(N_{W}\) :
-
No. of wind power generating units
- \(N_{PV}\) :
-
No. of solar power generating units
- \(N_{pump}\) :
-
No. of pumped hydroelectric storage units
- \(T_{pump}\) :
-
Collection of time intervals during which the pumped-storage plant operated in pumping mode
- NB:
-
Total number of buses
- \(DR_{t}\) :
-
Percentage of the predicted base load involved in Demand Response Participation (DRP) at time t.
- \(Inc_{t}\) :
-
Quantity of added load at time t
- \(Ls_{t}\) :
-
Load that can be shifted at time
- \(L_{Base, t}\) :
-
Predicted base load at time t
- \(v_{in}\) :
-
Cut-in wind speed
- \(v_{out}\) :
-
Cut-out wind speed
- \(v_{r}\) :
-
Rated wind speed
- \(a_{i} ,b_{i} \;{\text{and}}\;c_{i}\) :
-
Fuel cost coefficients of ith generating unit
- \(e_{i} \;{\text{and}}\;f_{i}\) :
-
Fuel cost coefficients of ith generating unit with valve point effect
- \(Q_{gj}\) :
-
Reactive power output at jth bus
- \(B_{jk}\) :
-
Transfer susceptance between bus j and bus k
- \(G_{jk}\) :
-
Transfer conductance between bus j and bus k
- h:
-
Hour
- DED:
-
Dynamic economic dispatch
- DSM:
-
Demand side management
- ELD:
-
Economic load dispatch
- OPF:
-
Optimal power flow
- COA:
-
Cheetah optimizer algorithm
- ECOA:
-
Enhanced Cheetah optimizer algorithm
- GWO:
-
Grey wolf optimizer
- PSH:
-
Pumped-storage hydropower
- ENSCSO:
-
Enhanced non-dominated sorting crisscross optimization
- ADFA:
-
Ameliorated Dragonfly algorithm
- CFCEP:
-
Chaotic fast convergence evolutionary programming
- FCEP:
-
Fast convergence evolutionary programming
- CCDE:
-
Colonial competitive differential evolution
- HSPSO:
-
Heterogeneous strategy particle swarm optimization
- SGEO:
-
Social group entropy optimization
- TG:
-
Thermal generator
- PDF:
-
Probability density function
- POZ:
-
Prohibited operating zone
- PV:
-
Photovoltaic
- DG:
-
Distributed generation
- WT:
-
Wind turbine
- NA:
-
Not available
- UR:
-
Upward ramp
- DR:
-
Downward ramp
- DR:
-
Demand response
- TOU:
-
Time-of-use
- PSO:
-
Particle swarm optimization
- ISO:
-
Independent system operator
References
Hu, F. et al. Research on the evolution of China’s photovoltaic technology innovation network from the perspective of patents. Energy Strateg. Rev. 51, 101309. https://doi.org/10.1016/j.esr.2024.101309 (2024).
Shao, B. et al. Power coupling analysis and improved decoupling control for the VSC connected to a weak AC grid. Int. J. Electr. Power Energy Syst. 145, 108645. https://doi.org/10.1016/j.ijepes.2022.108645 (2023).
Lin, X., Wen, Y., Yu, R., Yu, J. & Wen, H. Improved weak grids synchronization unit for passivity enhancement of grid-connected inverter. IEEE J. Emerg. Sel. Top Power Electron. 10, 7084–7097. https://doi.org/10.1109/JESTPE.2022.3168655 (2022).
Lin, X. et al. Stability analysis of Three-phase Grid-Connected inverter under the weak grids with asymmetrical grid impedance by LTP theory in time domain. Int. J. Electr. Power Energy Syst. 142, 108244. https://doi.org/10.1016/j.ijepes.2022.108244 (2022).
Gao, Y., Doppelbauer, M., Ou, J. & Qu, R. Design of a double-side flux modulation permanent magnet machine for servo application. IEEE J. Emerg. Sel. Top Power Electron. 10, 1671–1682. https://doi.org/10.1109/JESTPE.2021.3105557 (2022).
Hu, F., Wei, S., Qiu, L., Hu, H. & Zhou, H. Innovative association network of new energy vehicle charging stations in China: Structural evolution and policy implications. Heliyon 10, e24764. https://doi.org/10.1016/j.heliyon.2024.e24764 (2024).
Li, S., Zhao, X., Liang, W., Hossain, M. T. & Zhang, Z. A fast and accurate calculation method of line breaking power flow based on Taylor expansion. Front Energy Res. https://doi.org/10.3389/fenrg.2022.943946 (2022).
Liu, Y., Liu, X., Li, X., Yuan, H. & Xue, Y. Model predictive control-based dual-mode operation of an energy-stored quasi-Z-source photovoltaic power system. IEEE Trans. Ind. Electron. 70, 9169–9180. https://doi.org/10.1109/TIE.2022.3215451 (2023).
Wu, H., Jin, S. & Yue, W. Pricing policy for a dynamic spectrum allocation scheme with batch requests and impatient packets in cognitive radio networks. J. Syst. Sci. Syst. Eng. 31, 133–149. https://doi.org/10.1007/s11518-022-5521-0 (2022).
Liu, G. Data collection in MI-assisted wireless powered underground sensor networks: Directions, recent advances, and challenges. IEEE Commun. Mag. 59, 132–138. https://doi.org/10.1109/MCOM.001.2000921 (2021).
Xiao, Y. & Konak, A. The heterogeneous green vehicle routing and scheduling problem with time-varying traffic congestion. Transp. Res. Part E Logist. Transp. Rev. 88, 146–166. https://doi.org/10.1016/j.tre.2016.01.011 (2016).
Yang, Y., Zhang, Z., Zhou, Y., Wang, C. & Zhu, H. Design of a simultaneous information and power transfer system based on a modulating feature of magnetron. IEEE Trans. Microw. Theory Tech. 71, 907–915. https://doi.org/10.1109/TMTT.2022.3205612 (2023).
Jiang, Z. & Xu, C. Policy incentives, government subsidies, and technological innovation in new energy vehicle enterprises: Evidence from China. Energy Policy 177, 113527. https://doi.org/10.1016/j.enpol.2023.113527 (2023).
Shirkhani, M. et al. A review on microgrid decentralized energy/voltage control structures and methods. Energy Rep. 10, 368–380. https://doi.org/10.1016/j.egyr.2023.06.022 (2023).
Wang, Y., Xia, F., Wang, Y. & Xiao, X. Harmonic transfer function based single-input single-output impedance modeling of LCCHVDC systems. J. Mod. Power Syst. Clean Energy https://doi.org/10.3583/MPCE.2023.000093 (2023).
Wang, Y. et al. A comprehensive investigation on the selection of high-pass harmonic filters. IEEE Trans. Power Deliv. 37, 4212–4226. https://doi.org/10.1109/TPWRD.2022.3147835 (2022).
Rajagopalan, A. et al. Multi-objective optimal scheduling of a microgrid using oppositional gradient-based grey Wolf optimizer. Energies 15, 9024. https://doi.org/10.3390/en15239024 (2022).
Wu, H., Liu, X. & Ding, M. Dynamic economic dispatch of a microgrid: Mathematical models and solution algorithm. Int. J. Electr. Power Energy Syst. 63, 336–346. https://doi.org/10.1016/j.ijepes.2014.06.002 (2014).
Chinnadurrai, C. L. & Victoire, T. A. A. Enhanced multi-objective crisscross optimization for dynamic economic emission dispatch considering demand response and wind power uncertainty. Soft Comput. 24, 9021–9038. https://doi.org/10.1007/s00500-019-04431-3 (2020).
Suresh, V., Sreejith, S., Sudabattula, S. K. & Kamboj, V. K. Demand response-integrated economic dispatch incorporating renewable energy sources using ameliorated dragonfly algorithm. Electr. Eng. 101, 421–442. https://doi.org/10.1007/s00202-019-00792-y (2019).
Karthik, N., Parvathy, A. K., Arul, R. & Padmanathan, K. A new heuristic algorithm for economic load dispatch incorporating wind power, p. 47–65. https://doi.org/10.1007/978-981-16-2674-6_5 (2022).
Qin, H., Wu, Z. & Wang, M. Demand-side management for smart grid networks using stochastic linear programming game. Neural Comput. Appl. 32, 139–149. https://doi.org/10.1007/s00521-018-3787-4 (2020).
He, X., Yu, J., Huang, T. & Li, C. Distributed power management for dynamic economic dispatch in the multimicrogrids environment. IEEE Trans. Control Syst. Technol. 27, 1651–1658. https://doi.org/10.1109/TCST.2018.2816902 (2019).
Rajagopalan, A. & Montoya, O. D. Environmental economic load dispatch considering demand response using a new heuristic optimization algorithm, p. 220–42. https://doi.org/10.4018/978-1-6684-8816-4.ch013 (2023).
Lokeshgupta, B. & Sivasubramani, S. Multi-objective dynamic economic and emission dispatch with demand side management. Int. J. Electr. Power Energy Syst. 97, 334–343. https://doi.org/10.1016/j.ijepes.2017.11.020 (2018).
Karthik, N., Parvathy, A. K., Arul, R., Jayapragash, R. & Narayanan, S. Economic load dispatch in a microgrid using Interior Search Algorithm. Innov. Power Adv. Comput. Technol IEEE 2019, 1–6. https://doi.org/10.1109/i-PACT44901.2019.8960249 (2019).
Bhamidi, L. & Shanmugavelu, S. Multi-objective harmony search algorithm for dynamic optimal power flow with demand side management. Electr. Power Comp. Syst. 47, 692–702. https://doi.org/10.1080/15325008.2019.1627599 (2019).
Narimani, M., Joo, J.-Y. & Crow, M. Multi-objective dynamic economic dispatch with demand side management of residential loads and electric vehicles. Energies 10, 624. https://doi.org/10.3390/en10050624 (2017).
Nagarajan, K., Rajagopalan, A., Angalaeswari, S., Natrayan, L. & Mammo, W. D. Combined economic emission dispatch of microgrid with the incorporation of renewable energy sources using improved mayfly optimization algorithm. Comput. Intell. Neurosci. 2022, 1–22. https://doi.org/10.1155/2022/6461690 (2022).
Basu, M. Dynamic economic dispatch with demand-side management incorporating renewable energy sources and pumped hydroelectric energy storage. Electr. Eng. 101, 877–893. https://doi.org/10.1007/s00202-019-00793-x (2019).
Basu, M. Fuel constrained dynamic economic dispatch with demand side management. Energy 223, 120068. https://doi.org/10.1016/j.energy.2021.120068 (2021).
Nwulu, N. I. & Xia, X. Multi-objective dynamic economic emission dispatch of electric power generation integrated with game theory based demand response programs. Energy Convers. Manag. 89, 963–974. https://doi.org/10.1016/j.enconman.2014.11.001 (2015).
Mohammadjafari, M. & Ebrahimi, R. Multi-objective dynamic economic emission dispatch of microgrid using novel efficient demand response and zero energy balance approach. Int. J. Renew. Energy Res. https://doi.org/10.20508/ijrer.v10i1.10322.g7846 (2020).
Li, P., Hu, J., Qiu, L., Zhao, Y. & Ghosh, B. K. A distributed economic dispatch strategy for power-water networks. IEEE Trans. Control Netw. Syst. 9, 356–366. https://doi.org/10.1109/TCNS.2021.3104103 (2022).
Duan, Y., Zhao, Y. & Hu, J. An initialization-free distributed algorithm for dynamic economic dispatch problems in microgrid: Modeling, optimization and analysis. Sustain. Energy Grids Netw. 34, 101004. https://doi.org/10.1016/j.segan.2023.101004 (2023).
Mou, J. et al. A machine learning approach for energy-efficient intelligent transportation scheduling problem in a real-world dynamic circumstances. IEEE Trans. Intell. Transp. Syst. 24, 15527–15539. https://doi.org/10.1109/TITS.2022.3183215 (2023).
Zhang, L. et al. Research on the orderly charging and discharging mechanism of electric vehicles considering travel characteristics and carbon quota. IEEE Trans. Transp. Electrif. https://doi.org/10.1109/TTE.2023.3296964 (2023).
Karthik, N., Parvathy, A. K. & Arul, R. Multi-objective economic emission dispatch using interior search algorithm. Int. Trans. Electr. Energy Syst. 29, e2683. https://doi.org/10.1002/etep.2683 (2019).
Rajagopalan, A. et al. Chaotic self-adaptive interior search algorithm to solve combined economic emission dispatch problems with security constraints. Int. Trans. Electr. Energy Syst. https://doi.org/10.1002/2050-7038.12026 (2019).
Karthik, N., Parvathy, A. K., Arul, R. & Padmanathan, K. Multi-objective optimal power flow using a new heuristic optimization algorithm with the incorporation of renewable energy sources. Int. J. Energy Environ. Eng. 12, 641–678. https://doi.org/10.1007/s40095-021-00397-x (2021).
Zhang, L., Sun, C., Cai, G. & Koh, L. H. Charging and discharging optimization strategy for electric vehicles considering elasticity demand response. ETransportation 18, 100262. https://doi.org/10.1016/j.etran.2023.100262 (2023).
Mo, J. & Yang, H. Sampled value attack detection for busbar differential protection based on a negative selection immune system. J. Mod. Power Syst. Clean. Energy 11, 421–433. https://doi.org/10.35833/MPCE.2021.000318 (2023).
Cao, B. et al. Hybrid microgrid many-objective sizing optimization with fuzzy decision. IEEE Trans. Fuzzy Syst. 28, 2702–2710. https://doi.org/10.1109/TFUZZ.2020.3026140 (2020).
Wu, Q., Fang, J., Zeng, J., Wen, J. & Luo, F. Monte Carlo simulation-based robust workflow scheduling for spot instances in cloud environments. Tsinghua Sci. Technol. 29, 112–126. https://doi.org/10.26599/TST.2022.9010065 (2024).
Wang, Z., Li, J., Hu, C., Li, X. & Zhu, Y. Hybrid energy storage system and management strategy for motor drive with high torque overload. J. Energy Storage 75, 109432. https://doi.org/10.1016/j.est.2023.109432 (2024).
Biswas, P. P., Suganthan, P. N. & Amaratunga, G. A. J. Optimal power flow solutions incorporating stochastic wind and solar power. Energy Convers. Manag. 148, 1194–1207. https://doi.org/10.1016/j.enconman.2017.06.071 (2017).
Jabir, H., Teh, J., Ishak, D. & Abunima, H. Impacts of demand-side management on electrical power systems: A review. Energies 11, 1050. https://doi.org/10.3390/en11051050 (2018).
Meyabadi, A. F. & Deihimi, M. H. A review of demand-side management: Reconsidering theoretical framework. Renew. Sustain. Energy Rev. 80, 367–379. https://doi.org/10.1016/j.rser.2017.05.207 (2017).
Akbari, M. A., Zare, M., Azizipanah-abarghooee, R., Mirjalili, S. & Deriche, M. The cheetah optimizer: A nature-inspired metaheuristic algorithm for large-scale optimization problems. Sci. Rep. 12, 10953. https://doi.org/10.1038/s41598-022-14338-z (2022).
Memon, Z. A., Akbari, M. A. & Zare, M. An improved cheetah optimizer for accurate and reliable estimation of unknown parameters in photovoltaic cell and module models. Appl. Sci. 13, 9997. https://doi.org/10.3390/app13189997 (2023).
Song, H.-M. et al. Improved pelican optimization algorithm with chaotic interference factor and elementary mathematical function. Soft Comput. 27, 10607–10646. https://doi.org/10.1007/s00500-023-08205-w (2023).
Karthik, N., Parvathy, A. K., Arul, R. & Padmanathan, K. Levy interior search algorithm-based multi-objective optimal reactive power dispatch for voltage stability enhancement, p. 221–44. https://doi.org/10.1007/978-981-15-7241-8_17. (2021).
Mirjalili, S., Mirjalili, S. M. & Lewis, A. Grey Wolf optimizer. Adv. Eng. Softw. 69, 46–61. https://doi.org/10.1016/j.advengsoft.2013.12.007 (2014).
Faris, H., Aljarah, I., Al-Betar, M. A. & Mirjalili, S. Grey wolf optimizer: A review of recent variants and applications. Neural Comput. Appl. 30, 413–435. https://doi.org/10.1007/s00521-017-3272-5 (2018).
Acknowledgements
This article has been produced with the financial support of the European Union under the REFRESH—Research Excellence For Region Sustainability and High-tech Industries project number CZ.10.03.01/00/22_003/0000048 via the Operational Programme Just Transition and paper was supported by the following project TN02000025 National Centre for Energy II. The authors also wish to thank the Hindustan Institute of Technology & Science, Chennai, India, Vellore Institute of Technology, Chennai, India and Graphic Era (Deemed to be University), Dehradun, India for their all support and encouragement to carry out this work.
Author information
Authors and Affiliations
Contributions
K.N., A.R.: Conceptualization, Methodology, Software, Visualization, Investigation, Writing- Original draft preparation. S.R.: Data curation, Validation, Supervision, Resources, Writing—Review & Editing. M.B., S.A.D.M., V.B.: Project administration, Supervision, Resources, Writing—Review & Editing.
Corresponding authors
Ethics declarations
Competing interests
The authors declare no competing interests.
Additional information
Publisher's note
Springer Nature remains neutral with regard to jurisdictional claims in published maps and institutional affiliations.
Rights and permissions
Open Access This article is licensed under a Creative Commons Attribution 4.0 International License, which permits use, sharing, adaptation, distribution and reproduction in any medium or format, as long as you give appropriate credit to the original author(s) and the source, provide a link to the Creative Commons licence, and indicate if changes were made. The images or other third party material in this article are included in the article's Creative Commons licence, unless indicated otherwise in a credit line to the material. If material is not included in the article's Creative Commons licence and your intended use is not permitted by statutory regulation or exceeds the permitted use, you will need to obtain permission directly from the copyright holder. To view a copy of this licence, visit http://creativecommons.org/licenses/by/4.0/.
About this article

Cite this article
Nagarajan, K., Rajagopalan, A., Bajaj, M. et al. Optimizing dynamic economic dispatch through an enhanced Cheetah-inspired algorithm for integrated renewable energy and demand-side management. Sci Rep 14, 3091 (2024). https://doi.org/10.1038/s41598-024-53688-8
Received:
Accepted:
Published:
DOI: https://doi.org/10.1038/s41598-024-53688-8
This article is cited by
Comments
By submitting a comment you agree to abide by our Terms and Community Guidelines. If you find something abusive or that does not comply with our terms or guidelines please flag it as inappropriate.
