


Introduction
Childhood obesity is a public health problem and its prevalence is increasing worldwide (James et al., Reference James, Leach, Kalamara and Shayeghi2001).
Reported, rather than measured weight and height are often used to calculate body mass index (BMI) and to classify the child as being underweight, normal-weight, or overweight (Beck et al., Reference Beck, Schaefer, Nace, Steffen, Nigg, Brink, Hill and Browning2012). This method of data collection is quicker, easier and cheaper and therefor often performed in both clinical practice and research. However, parents presenting to health care providers may give inaccurate information on the child’s weight and height, since it has been shown that parents are likely to misperceive the weight status of their overweight child (Rietmeijer-Mentink et al., Reference Rietmeijer-Mentink, Paulis, Van middelkoop, Bindels and Van der wouden2013). As a result, children could be misclassified as being normal-weight rather than overweight or obese, which could lead to children missing out on proper and necessary treatment. Though, direct measurements of height and weight by a clinician are more-time consuming and more expensive.
General practitioners (GP) in the Netherlands are often the first health care provider of children and therefore play an important role in screening and signaling childhood obesity (Paulis et al., Reference Paulis, Palmer, Chondros, Kauer, Van Middelkoop and Sanci2017). The question arises whether the GP can rely on reported measurements by parents and children themselves or should children be measured during consultation at the GP? Therefore, this study aims to investigate the accuracy of reported weight and height in children aged 2–17 compared to direct measurements by the GP.
Methods
Study design
This study is a cross-sectional study using data from the DOERAK [“Determinants of (sustained) Overweight and complaints; Epidemiological Research among Adolescents and Kids in general practice”] cohort study. The study protocol has been published previously (Paulis et al., Reference Paulis, Van middelkoop, Bueving, Luijsterburg, Van der wouden and Koes2012). The study has been approved by the Institutional Review Board of the Erasmus University Medical Center, Erasmus MC.
Participants
Children aged 2–18 visiting their GP (or GP-trainee) between December 2010 and April 2013 were asked, during consultation, to participate in the study. This age range was used, since BMI-z scores can be calculated for children starting at age two and parents are legally responsible for their child up to the age of 18. Children were eligible to participate in the study if they/their parents had a basic understanding of the Dutch language, that is, to be able to give informed consent and fill out Dutch questionnaires. Children with mental or physical disabilities, with comorbidities affecting weight, and children visiting their GP with emergency problems were not eligible. If child and parent showed interest after receiving verbal information during consultation, the child’s weight and height were measured and recorded in the medical file, and contact information was sent to the research team. Study information and informed consent forms (and informed assent forms for children aged 12 and older) were then sent to the participants, where after the researcher contacted the family to answer possible questions and to investigate the willingness to participate. Both parents had to sign the informed consent (for children of all ages), and children aged 12 and older also had to sign the informed assent form. Children were formally included when informed consent forms (and if needed informed assent forms) were received.
Data collection and measurements
After formal inclusion, the GP or GP trainee were approached to collect data on the child’s weight and height which was measured during consultation using calibrated scales and stadiometers. Measurements were performed by the GP or GP trainee who both followed the same study protocol (Paulis et al., Reference Paulis, Van middelkoop, Bueving, Luijsterburg, Van der wouden and Koes2012).
The GP questionnaire was used to extract the participant’s gender and age. Baseline BMI-z scores were calculated from the measured weight and height, and weight status was determined using the international age and gender specific cut-off points (Cole et al., Reference Cole, Bellizzi, Flegal and Dietz2000; Cole et al., Reference Cole, Flegal, Nicholls and Jackson2007). Children were then categorized in three different weight status groups: underweight, normal-weight, overweight/obese (from here on referred to as the overweight group).
Reported weight and height measures were collected from the baseline questionnaires which were filled out by parents of children aged 2–8, or children themselves (age 9 and older). From these reported weight and height measures, BMI-z scores, and corresponding weight status, were also calculated. The parent’s questionnaires were used to extract information on socio-economic status (SES) [based on net household income (<2000 euros/month, ⩾2000 euros/month)], ethnicity (both parents born in the Netherlands, at least one parent born in another country) and marital status reported by parents (parents living together, parents separated). Highest level of education in the household was categorized into three levels (up to lower secondary level, upper secondary level, at least bachelor level), based on the international standard classification of education (Centraal Bureau Voor De Statistiek, 2011).
Statistical analysis
Baseline demographics were described for underweight, normal-weight, and overweight children using means (standard deviation) for continuous variables and frequencies (%) for dichotomous or categorical variables. Potential differences in baseline demographics between underweight and normal-weight, and overweight and normal-weight children were analyzed using the independent-samples T-test. In addition, potential differences in measured and reported height, weight, and BMI-z in the subgroups young (2–8 year) and older children (9–17 year), and boys and girls were analyzed using the paired T-test. The magnitude of the differences was determined using mean differences (MD) with 95% confidence intervals. Complete case analysis was used. P-values <0.05 were considered statistically significant. IBM SPSS statistics 12.0 was used for statistical analyses.
Results
Of the 1109 children that showed interest in study participation, 733 were included. Measured and/or reported weight and/or height was not available of 139 children who were excluded, and therefore 594 children were included in the present study (Figure 1). There were no significant differences in baseline characteristics between the excluded and included children.
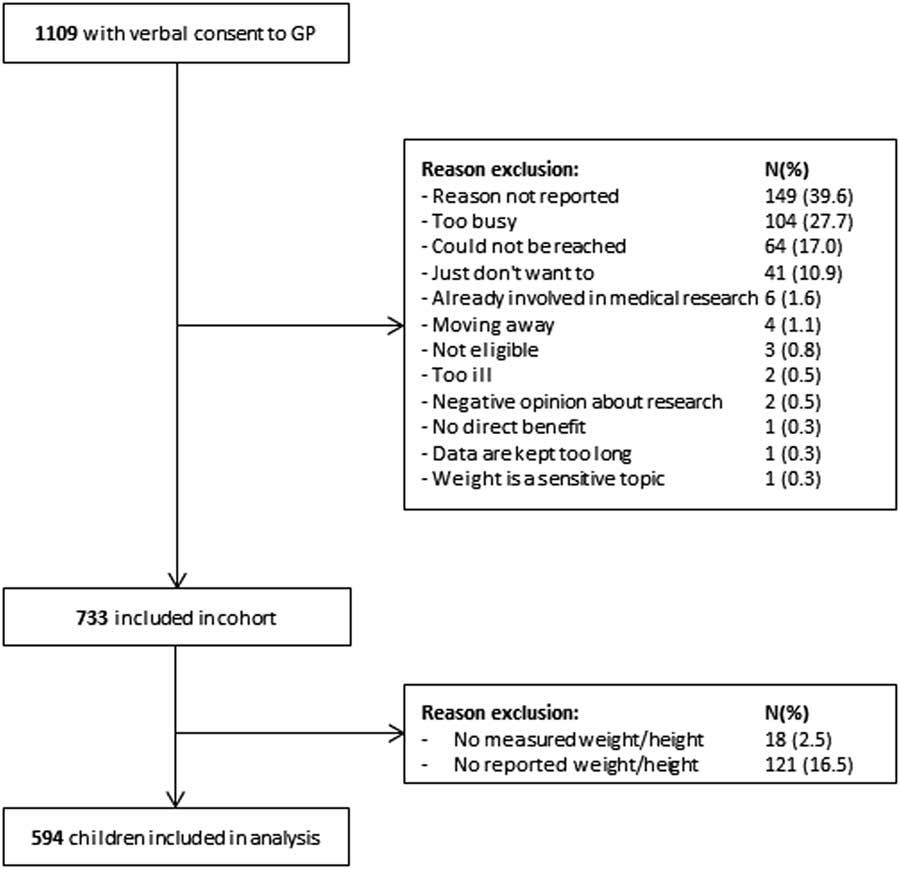
Fig. 1 Flowchart of inclusion
At baseline, 18.2% of the children were defined as being underweight, 62.3% normal-weight, and 19.5% overweight according to direct measured height and weight (Table 1). The children in the underweight group were significantly younger than the normal-weight children (6.8 versus 8.3 years), while the overweight children were significantly older than the normal-weight children (9.3 versus 8.3 years).
Table 1 Baseline characteristics

SES=socio-economic status.
a Weight status based on weight and height measures from general practitioner.
b More than 2000 euros monthly net income per household.
c Significantly different from normal-weight.
Analyses among the three weight groups showed that underweight children reported a significantly higher weight than measured [MD 0.58 kg (0.11, 1.05)] while overweight children reported a significantly lower weight than measured [MD −1.20 kg (−1.75, −0.65)]. In the normal-weight group, no significant differences were found. For height, no significant differences between reported and measured height were found for all weight groups.
The subgroup analyses among age groups showed that parents of underweight children aged 2–8 years, reported a significantly higher weight [MD 0.32 kg (0.02, 0.62)] and lower height [MD −1.01 cm (−1.69, −0.34)] than measured weight and height (Table 2). Parents of overweight children aged 2–8 reported a significantly lower weight [MD −1.08 kg (−1.77, −0.39)] and larger height [MD 1.09 (0.14, 2.04)] than measured weight and height. There were no significant differences between reported and measured weight and height for normal-weight children aged 2–8.
Table 2 Mean differences (MD) between reported and measured weight, height and BMI-z according to weight status and age group
CI=confidence interval.
a weight status based on weight and height measures from the general practitioner.
b P-value <0.05.
Normal-weight [MD −0.51 kg (−0.79 , −0.23)] and overweight children aged 9–17 reported a significantly lower weight than measured weight [MD −1.28 kg (−2.08, −0.47)].
When looking at boys and girls separately, both overweight boys [MD −1.03 kg (−1.74, −0.31)] and overweight girls [MD −1.34 kg (−2.17, −0.51)] reported a significantly lower weight than measured. Boys aged 9–17 of normal-weight [MD −0.43 kg (−0.87, −0.001)] and overweight [MD −1.06 kg (−1.94, −0.18)], and girls aged 9–17 of normal-weight [MD −0.57 kg (−0.95, −0.19)] and overweight [MD −1.46 kg (−2.80, −0.12)] reported a significantly lower weight than measured. Parents of overweight girls aged 2–8 years reported a significantly lower weight than measured [MD −1.17 kg, −1.94, −0.40)].
Of the 109 children who were classified as underweight by the GP, 33 would be misclassified into the normal-weight group when using reported measurements, and one child into the overweight group. Of the children who were classified as overweight by the GP (total 116), 20 would be misclassified as normal-weight and four as underweight using self-reported measurements (Table 3).
Table 3 Weight status (mis)classification

a Agreement on weight status between weight status based on self-reported data and based on measured data.
Discussion
Summary
Parents of underweight and overweight children aged 2–8 years reported a significantly higher and lower weight respectively, compared to measured weight. Normal-weight and overweight children aged 9–17 reported a significantly lower weight than measured. When looking at boys and girls separately, both normal-weight and overweight boys and girls aged 9–17 reported a significantly lower weight than measured. Parents of overweight girls aged 2–8 years reported a significantly lower weight than measured.
Strength and limitations
The current study is one of the first to investigate the differences in reported and measured weight status in three different weight groups, split by age, in primary care. We were therefore able to investigate both how parents’ reported weight and height of young children differed from measured values, and how reported weight and height by older children differed from measured values.
By inviting every child visiting the GP during the inclusion period, we tried to minimize selection bias. However, when comparing our study population to the overall Dutch population, parents of included children in our cohort were more often born in the Netherlands (84 versus 79%) and more often highly educated (42 versus 32%) (Centraal Bureau voor de Statistiek, 2017). Since overweight and obesity is more prevalent in ethnic minorities and families of lower SES, selection bias in the current study may have led to an underestimation of the percentage overweight and obese children, and to an overestimation of underweight children (Stamatakis et al., Reference Stamatakis, Primatesta, Chinn, Rona and Falascheti2005). This is reflected by prevalence differences in underweight children of the current study (18.2%) when compared to the prevalence (1.6%) reported by the World Health Organization (WHO) (The World Bank, 1980) and reported by the Dutch Central Bureau of Statistics (5.7%) (Centraal Bureau voor de Statistiek, 2016). Therefore, we may have to be careful to generalize the results of the current study to a wider perspective. However, the differences in percentage underweight children between the current study and the WHO may be associated with the different cut-off points that were used to classify children as underweight, normal-weight or overweight (Cole et al., Reference Cole, Bellizzi, Flegal and Dietz2000; Cole et al., Reference Cole, Flegal, Nicholls and Jackson2007; de Onis et al., Reference De Onis, Onyango, Borghi, Siyam, Nishida and Siekmann2007). The WHO uses the WHO growth references, which rely on age–sex-specific BMI centiles or standard deviation scores to define the weight status cut-offs, while the current study used an international standard growth chart which was developed by The International Obesity Task Force, to enable global comparison (Cole et al., Reference Cole, Bellizzi, Flegal and Dietz2000; Reference Cole, Flegal, Nicholls and Jackson2007; de Onis et al., Reference De Onis, Onyango, Borghi, Siyam, Nishida and Siekmann2007). However, since we were primarily interested in differences between reported and measured values within the different weight groups, we believe this did not significantly impact our results.
The size of our study sample was smaller than intended, which may have introduced a power problem (Paulis et al., Reference Paulis, Van middelkoop, Bueving, Luijsterburg, Van der wouden and Koes2012). However, since we were able to show significant differences in reported and measured weight and height, we believe a larger study sample would not significantly change our results.
Lastly, when the GP measured the child’s weight status during consultation, the results were recorded into the medical file of the child, and not per se concealed from the parent/child. We believe enough time passed from this consultation to when the baseline questionnaire was filled out by parents or the child, so that the parent/child did not remember what the GP had measured during consultation. Furthermore, this procedure was identical for every included child. We therefore believe that this procedure did not have a significant impact on our results.
Comparison with existing literature
Our findings are in line with previous literature (Beck et al., Reference Beck, Schaefer, Nace, Steffen, Nigg, Brink, Hill and Browning2012), showing that reported weight in overweight and obese young children is not accurate compared to measured values. Previous literature already showed that parents often misperceive the weight(status) of their overweight child (Rietmeijer-Mentink et al., Reference Rietmeijer-Mentink, Paulis, Van middelkoop, Bindels and Van der wouden2013). However, the current study showed that parents are also inaccurate in reporting weight of their underweight child. Not only parents, but also children aged 9–17 fail to accurately report their own weight (Sherry et al., Reference Sherry, Jefferds and Grummer-Strawn2007). As a result, 32% of the underweight children and 21% of the overweight children in our study would be misclassified in the different weight categories.
Although no significant differences in SES between underweight, normal-weight, and overweight children were found, a trend is seen where overweight children come from families with a lower SES than underweight and normal-weight children. This is in line with other literature showing that obesity is more prevalent in children from ethnic minorities with a lower SES and level of education (Gishti et al., Reference Gishti, Kruithof, Felix, Raat, Hofman, Duijts, Gaillard and Jaddoe2014). However, in the current study, reported weight within a weight class was not significantly different between levels of SES, thus SES does not seem to influence the ability to accurately report weight.
Implications for research and/or practice
According to international guidelines for primary care, the GP plays an important role in screening children on their weight status (Richardson et al., Reference Richardson, Paulis, Van Middelkoop and Koes2013). In the Netherlands, school physicians also play a role in screening children, since they measure height and weight at age 5–6 and 10–11 years. However, these data are not transferred to GPs (Gemeentelijke Gezondheidsdienst, 2018). In the United Kingdom, a similar program is active, namely the National Child Measurement Programme (National Health Service, 2018). However, besides these set measurement times, no measured data are available and GP’s will rely on self-reported data. However, if a GP would rely on the reported weight measures of parents and children, part of these under- or overweight children would potentially be missed and therefore not receive proper treatment or referral. Thus, the GP cannot rely on reported weight and height measures from parents and children. In case of suspected under- or overweight in children, it should be advised to measure weight and height in general practice. However, it is known that GP’s find it difficult to discuss weight issues during consultation (Dettori et al., Reference Dettori, Elliott, Horn and Leong2009). Furthermore, research showed that although most GP’s are able to identify the underweight and obese children at the end of the spectrum, many are not able to correctly identify the weight status of children who are just underweight, or just obese (Gage et al., Reference Gage, Erdal, Saigal, Qiao, Williams and Raats2012). Therefore, it could be argued that, to overcome these two issues, all children visiting the GP should be measured (at least yearly) as part of routine measurements so that accurate treatment and follow-up can be discussed during consultation.
Acknowledgment
We thank the general practitioners who helped with the inclusion of the participants. We also like to thank all participating children and their parents.
Funding Statement
There are no funders to report for this manuscript.
Ethical approval
The study has been approved by the Institutional Review Board of the Erasmus University Medical Center, Erasmus MC; MEC-2010-092.
Conflicting and Competing Interest
The authors declare that they have no conflicting or competing interests.


 Open access