


Excessive salt consumption is a major dietary risk factor for high blood pressure(Reference Elliott, Stamler and Nichols1,Reference He, Li and Macgregor2) , and it is associated with increased cardiovascular morbidity and mortality(Reference Poggio, Gutierrez and Matta3). In Mozambique, a rapidly urbanising low-income country(4), the prevalence of hypertension is very high and increasing(Reference Damasceno, Azevedo and Silva-Matos5,Reference Jessen, Damasceno and Silva-Matos6) , and the burden of stroke is high in the city of Maputo(Reference Gomes, Damasceno and Carrilho7,Reference Damasceno, Gomes and Azevedo8) .
High and increasing levels of Na intake have been observed worldwide(Reference Elliott and Brown9), including in African countries(Reference Oyebode, Oti and Chen10,Reference Mizehoun-Adissoda, Houinato and Houehanou11) . In a sample of Maputo inhabitants(Reference Queiroz, Damasceno and Jessen12), the mean 24-h urinary Na excretion was estimated to be twice the maximum 2000 mg daily intake recommended by the WHO(13).
Cereals represent an important part of diet and are considered as major contributors of daily Na intake(Reference Joossens, Sasaki and Kesteloot14). According to the last Household Budget Survey conducted in Mozambique in 2014/15, >50 % of household monthly expenses of 60 % of the total population are designated to acquiring food products and non-alcoholic beverages; in particular, almost half of the food expenses are related to cereals and bakery products(15). Several countries have recommendations or legislation for the maximum Na content in bread, ranging from 360 to 550 mg/100 g(Reference Dunford, Eyles and Mhurchu16–Reference Wyness, Butriss and Stanner20), but no such recommendations are available in Mozambique(Reference Webster, Trieu and Dunford21). An evaluation of Na content in white bread produced in the city of Maputo in 2012 found a mean level of 450·3 mg/100 g(Reference Silva, Padrao and Novela22), and most samples were above the maximum level allowed in neighbouring South Africa(23). Therefore, the present study aimed to assess the current Na level and the price of bread sold in bakeries in the city of Maputo and to describe trends since 2012.
Methods
Survey conducted in July 2018
A total of twenty bakeries were selected for this study. These included all bakeries located in the city of Maputo that could be identified through the Mozambican yellow pages (n 14) and other well-known city bakeries that were not listed (n 5). All bakeries had an in-house baking facility, and one factory distributed bread to several of the city’s neighbourhoods. Samples supplied by the factory were purchased from a stationary selling point, and for analysis, the factory was considered as one bakery. Three loaves of each type of bread were bought from each bakery when available. Bread types included white bread made from wheat flour from which the darker coarser bran had been removed and the starchy endosperm had been retained; brown bread made from a mixture of white and wholemeal flours; and unsalted bread labelled as such by the bakeries.
Each of the loaves was individually weighed, ground mechanically for homogenisation, individually packed in proper cooler bags (29–33 g samples of ground loaves) and identified and frozen at –18°C until Na content analysis.
Sodium determination
The homogenised bread samples were defrosted at room temperature, weighed and three aliquots of approximately 2 g were collected from each sample for Na content analysis by flame photometry (flame photometer model PFP7; JenWay®, Dunmow, UK) according to a previously validated method(Reference Vieira, Soares and Ferreira24).
Two readings of each of the three aliquots from the same homogenised bread were taken. The mean of six results obtained from each bakery was used for data analysis. The final Na content per 100 g of bread was adjusted for the difference between bread weight on packaging date and date of analysis as final Na content = (bread weight at packaging × Na content)/bread weight at analysis.
Survey conducted in June 2012
In 2012, sixteen bakeries listed in the yellow pages and one additional well-known bakery were included in the sample (n 17). Of these, five were no longer operating in 2018; twelve bakeries surveyed in 2012 were also evaluated in 2018.
Sample collection and analysis were conducted using the same methodology in 2012 and in 2018, although white bread was the only type sold in 2012.
Statistical analysis
Mean Na levels in white and brown breads purchased in 2018 and their prices in meticais (Euros, considering the exchange rate in 2018) were compared by the t-test for independent samples. Trends were quantified by the mean difference between samples for each period and the corresponding 95 % CI.
The proportion of samples of each type of bread not complying with prespecified cut-offs was computed, and Fisher’s exact test was used for comparisons. Since there are no regulations or formal recommendations in Mozambique, Na targets established by manufacturers in South Africa (<380 mg/100 g), given the geographical proximity, and Portugal (<550 mg/100 g), due to the large Portuguese community in Maputo, were selected.
Results
In 2018, white bread was available in all twenty bakeries, brown bread in seven, and unsalted brown bread in two. As depicted in Table 1, the mean Na content (mg/100 g) was 419·1 for white, 389·8 for brown and 41·6 for unsalted brown bread. Non-compliance of the Na target in bread, according to the South Africa regulation, was observed in 70 % of white and 43 % of brown bread samples, whereas none of white and 14 % of brown bread samples did not comply with the Portuguese regulation.
Table 1 Na content of samples of bread sold in the city of Maputo, in 2018
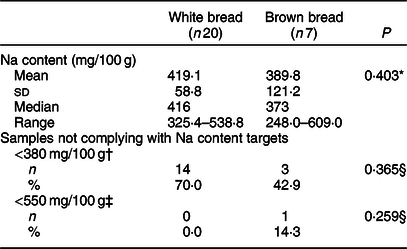
* The t-test for independent samples was used to compare white and brown bread.
† Defined according to the maximum level of Na in bread established by the South African Government (effective June 2019)(23).
‡ Defined according to the maximum level of Na in bread established by the Portuguese Government(17).
§ Fisher’s exact test was used to compare white and brown bread.
Upon comparing bakeries offering both types of bread (n 7), Na content was higher in white bread samples collected from five bakeries; differences were not statistically significant with a mean difference of 12·2 mg/100 g (95 % CI: –96·4, 120·8).
Figure 1 presents the distribution of Na content in white bread samples collected in 2012 and 2018 from the same bakeries (n 12). The mean Na content was 453·4 mg/100 g in 2012 and 406·8 mg/100 g in 2018, corresponding to a mean difference of 46·6 mg/100 g (95 % CI: 1·7, 91·5) between samples from the same bakeries.
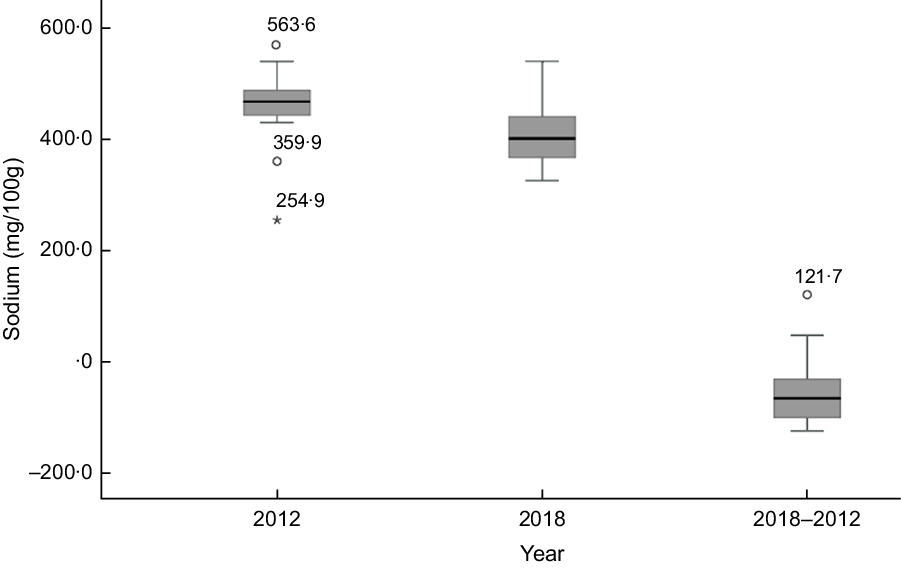
Fig. 1 Na content in white bread samples collected from twelve bakeries in the city of Maputo, in 2012 and 2018, and the mean differences between samples from the bakeries evaluated in 2012 and 2018
In 2018, the mean (sd) price per 100 g of bread was 5·3 (0·8) meticais (0·079€) for white and 9·2 (3·3) meticais (0·138€) for brown bread, with significant differences between types of bread, among all bakeries (P = 0·002) and among bakeries offering both types of bread (5·9 v. 9·2 meticais; P = 0·039). The mean price per 100 g unsalted brown bread was 6·42 meticais (0·53€).
Between 2012 and 2018, there was a significant increase (1·7 meticais; 95 % CI: 0·84, 2·46) in the mean price per 100 g of white bread collected in the same bakeries corresponding to a variation of 3·7–5·4 meticais.
Discussion
The present study followed the same methodological approach as in a previous survey conducted in 2012, allowing for the characterisation of Na content in bread offered by bakeries in the city of Maputo and an assessment of trends over the most recent years. Only white bread was available in 2012, while in 2018 some bakeries also offered brown bread, including salted and unsalted varieties. The difference between mean Na content in white and salted brown bread was not significant, whereas a very low Na content was found in brown bread labelled as unsalted.
From 2012 to 2018, there was a significant reduction of approximately 10 % in the mean Na content of white bread. Even so, in 2018, the level of Na in bread obtained from different bakeries was still largely variable, with some samples having very high levels. Accordingly, although the mean level of Na in white breads was higher than observed for brown breads, the range of Na content in the former type of bread was narrower than in the latter. Yet, median values were similar to the means. Approximately two-thirds of white bread samples and two-fifths of brown bread samples did not comply with the target of Na content for bread defined in South Africa (≤380 mg/100 g)(23), although only a few brown bread samples did not comply with the less-strict Portuguese regulation (<550 mg/100 g)(17). Even though brown bread seemed to perform better than white bread when considering the South African regulation, there was a wider variability in Na content among samples of brown bread, reflecting the lack of recommendations for Na content in bread. Though the South African regulation has established two targets for salt reduction (400 mg/100 g until June 2016 and 380 mg/100 g until June 2019), we selected 380 mg/100 g because this was used in our previous survey(Reference Silva, Padrao and Novela22). Nevertheless, the results were similar when considering 400 mg/100 g (13/20 non-compliant white bread samples and 2/7 non-compliant brown bread samples).
Dietary salt reduction is considered a cost-effective measure, and a 30 % relative reduction in mean Na consumption at the population level was set as one of the targets in the WHO Global Action Plan for the Prevention and Control of Non-Communicable Diseases 2013–2020(25). Bread largely contributes to dietary salt intake, and attention to reduce salt in bread has grown worldwide, with successful reports from several countries(Reference Trieu, Neal and Hawkes26). In Africa, only South Africa has established a legislation with targets for Na content in bread(Reference Trieu, Neal and Hawkes26).
In the city of Maputo, the availability of bread was estimated at 106 g per capita in 2008/9(27), and a study performed on Maputo inhabitants found a mean Na intake of 4220 mg/d(Reference Queiroz, Damasceno and Jessen12). Considering the mean Na content found in the present study (419·1 mg/100 g), white bread consumption may be accounting for a daily intake of 444·2 mg of Na, corresponding to around 10 % of the mean daily Na intake observed in Maputo and 22 % of the maximum daily Na intake recommended by the WHO.
Although salt influences the quality of bread, through its technological characteristics, shelf-life and sensory effects, these functions require very small levels of salt, leaving room for improvements(Reference Belz, Ryan and Arendt28). Additionally, it has been shown that a gradual salt reduction in bread is not perceived and does not affect consumer acceptability(Reference McMahon, Clarke and Jaenke29,Reference Girgis, Neal and Prescott30) .
In recent years, a significant price increase was observed in bakeries in the city of Maputo. Although we opted to use nominal prices (prices observed by consumers, not corrected for inflation) in our analyses(31), the 77 % increase in the minimum wage, from 2300 to 4063 meticais, in Mozambique between 2012 and 2018 can be used as a benchmark to interpret the 46 % price increase for white bread in the same period.
The large variability in bread Na content observed between bakeries and the higher price of brown compared to white bread show that further improvements are possible. In Mozambique, most of the population does not adopt behaviours to reduce salt intake(Reference Jessen, Santos and Damasceno32). Among Maputo inhabitants, discretionary salt is the most frequent source of dietary Na intake (60 %)(Reference Queiroz, Damasceno and Jessen12). In the short term, setting voluntary targets for Na content in bread, which can be adjusted over time, may represent an easier point of departure. However, they rely on the willingness of producers, and loss of compliance may occur over time, requiring a strong awareness campaign and close involvement of government and civil society. Additionally, salt reduction strategies should be linked to diet-related programmes ongoing in the Ministry of Health, such as iodine deficiency elimination programs(33).
The methodology used in the present study was the same as used in a previous study(Reference Silva, Padrao and Novela22), allowing for valid comparisons over a period of 6 years. At least one bakery supplying to most of the districts of the city, as well as samples from a factory that supplies to several other selling points, were included. Nevertheless, the possibility of generalising our results to the whole city of Maputo may be compromised, since smaller and less-known bakeries had no samples evaluated, though it is difficult to predict to what extent this may have limited the study’s external validity. Additionally, these results may not apply to the rest of the country. The sampling strategy adopted also limited the sample size, and the study was based on a relatively small number of bakeries, with the analysis of trends including an even smaller number of samples. Though this limits the precision of the estimates computed, the internal validity was not affected and the variation observed between 2012 and 2018 was large enough for the differences to be statistically significant.
In conclusion, the present study has important data that can be used to guide recommendations for voluntary and mandatory reductions in the salt content of processed food and for monitoring future interventions.
Acknowledgements
Acknowledgements: The authors gratefully acknowledge Filipa Henriques for the support with the bromatological analysis. Financial support: This research received no specific grant from any funding agency, commercial or not-for-profit sectors. Conflict of interest: None. Authorship: N.J., P.P., C.N., P.M., A.D. and N.L. contributed to study conception and design. NJ, PP and NL were responsible for study implementation and coordinated data collection. OP performed the bromatological analyses of bread samples. NJ and NL performed the analysis, interpretation of results and drafted the manuscript. All authors critically revised the manuscript and gave the final approval. Ethics of human subject participation: Not applicable.


