


Introduction
The Arctic, despite being remote, with small numbers of residents and comparatively little shipping and fishing traffic, is not immune to the problem of ocean plastic pollution. Against the region’s existing backdrop of dramatic environmental change, plastics have appeared on Arctic beaches (Bergmann et al., Reference Bergmann, Lutz, Tekman and Gutow2017); in the ocean and in sea ice (Bergmann et al., Reference Bergmann, Collard, Fabres, Gabrielsen, Provencher, Rochman and Tekman2022); and in the stomachs of seabirds and marine mammals (Amélineau et al., Reference Amélineau, Delphine Bonnet, Valentine Mortreux, Harding, Walkusz, Fort and Grémillet2016; Bergmann et al., Reference Bergmann, Collard, Fabres, Gabrielsen, Provencher, Rochman and Tekman2022; PAME 2019; van Franeker & Law, Reference van Franeker and Law2015).
These plastics pose issues for the environment and the human communities that depend on it. Mortality from entanglement and ingestion decreases food stocks (PAME, 2019; Provencher et al., Reference Provencher, Bond, Avery-Gomm, Borrelle, Bravo Rebolledo, Hammer and van Franeker2017; Trevail et al., Reference Trevail, Gabrielsen, Kühn and Van Franeker2015; van Franeker & Law, Reference van Franeker and Law2015), and bioaccumulation (Ask et al., Reference Ask, Anker-Nilssen, Herzke, Trevail, van Franeker and Gabrielsen2016; PAME, 2019) harms animal and human health (Barboza et al., Reference Barboza, Vethaak, Lavorante, Lundebye and Guilhermino2018; Vethaak & Leslie, Reference Vethaak and Leslie2016). Plastics flowing into the Arctic from other parts of the world can also host invasive species and pathogens, to the detriment of delicate ecosystems (Amaral-Zettler et al., Reference Amaral-Zettler, Zettler and Mincer2020; Barnes, Reference Barnes2002; Barnes & Milner, Reference Barnes and Milner2005; PAME, 2019; Wright et al., Reference Wright, Erni-Cassola, Zadjelovic, Latva and Christie-Oleza2020).
The Arctic Ocean’s physical system operates differently in many ways from lower-latitude oceans’. One crucial element of this system is sea ice. As sea ice forms, it concentrates plastic debris (Peeken et al., Reference Peeken, Bergmann, Gerdts, Katlein, Krumpen, Primpke and Tekman2018), so the formation, melt, and movement of sea ice are important to tracking plastic in the Arctic Ocean. Additionally, in other oceans, the majority of marine plastic comes from land-based sources, often transported via rivers (Cózar et al., Reference Cózar, Martí, Duarte, García-de-Lomas, van Sebille, Ballatore and Irigoien2017). However, as this study will show, the sources of plastic in the Arctic Ocean are not primarily land-derived, but instead come from fishing and shipping.
As a result of climate change, the Arctic Ocean sea ice cover is rapidly declining, and therefore it is important to identify plastic pollution sources and circulation today and how these might change in a future Arctic. For example, not only will plastic debris circulate differently in an ice-free Arctic Ocean, but an increase in ship traffic through newly ice-free regions could result in additional plastic input. This manuscript considers marine plastic pollution’s behavior in the Arctic Ocean and attempts to anticipate how its occurrence might change in the future, with or without the use of policy tools for mitigation.
Background
This manuscript is the first attempt to unify geophysical budget concepts and regulatory measures that control input and removal of plastic from the Arctic Ocean. As a precedent for physical budgets that include anthropogenic inputs and policy solutions, we can look to the carbon space, in which estimations of emissions reductions are regularly modeled. Because of the diffuse nature of carbon pollution, many of these budgets are global-scale (Lahn, Reference Lahn2020; Rogelj et al., Reference Rogelj, Schaeffer, Friedlingstein, Gillett, Van Vuuren, Riahi and Knutti2016). Likewise, the majority of plastic budgets have been global (Chassignet et al., Reference Chassignet, Xu and Zavala-Romero2021; Jambeck et al., Reference Jambeck, Geyer, Wilcox, Siegler, Perryman, Andrady and Law2015; Lebreton & Andrady, Reference Lebreton and Andrady2019). Existing regional budgets for the South Korean (Jang et al., Reference Jang, Lee, Hong, Mok, Kim, Lee, Choi, Kang and Lee2014) and Scottish (Turrell, Reference Turrell2020) coasts describe fluxes and concentrations of marine debris from natural and anthropogenic processes. Each examination stops short of proposing policy interventions and testing their effect on the budget, which is one aim of this present manuscript.
A critical element of any budget is flux: We can estimate concentrations in a given reservoir using residence times (Kanhai et al., Reference Kanhai, Gårdfeldt, Lyashevska, Hassellöv, Thompson and O’Connor2018), but have little sense of the stability of the budget—or, in the case of marine plastic pollution, the ability to change the inputs and outputs through policy—without understanding the rates at which concentration changes at the margins of our study area. While plastic concentrations may be higher at the center of ocean gyres, the flux of plastic is greater at the coastlines (Sherman & van Sebille, Reference Sherman and van Sebille2016). Thus, any attempt to change ocean plastic pollution occurrence has a greater impact near the gateways by which plastic can enter or exit the system. With respect to policy, this perspective means that rather than orchestrate open-water cleanups, it is more effective to implement changes near coastlines and for point-source industries such as fisheries and shipping.
The classic budgets of Arctic physical oceanography are those for heat and freshwater. These parameters are tracked because of sea ice’s role in the energy balance and Arctic Ocean freshwater’s impacts on global circulation. In the case of freshwater, budgets focus on oceanic import and export, sea ice import and export, riverine import, and precipitation import (Aagaard & Carmack, Reference Aagaard and Carmack1989; Serreze et al., Reference Serreze, Barrett, Slater, Woodgate, Aagaard, Lammers and Lee2006).
These budgets suggest how we might track plastic pollution in the Arctic, since it often acts as a tracer of ocean and ice circulation. Here we use “plastic” as a shorthand for plastics under 2.5 cm, which encompasses both meso- and microplastic (GESAMP, 2019). Plastics of these size classes are typically highly buoyant, and tracing surface ocean currents can account for the majority of water-borne plastic (van Sebille et al., Reference van Sebille, Aliani, Law, Maximenko, Alsina, Bagaev and Wichmann2020), though some amount of microplastic is present throughout all depths in the eastern Arctic Ocean. (Tekman et al., Reference Tekman, Wekerle, Lorenz, Primpke, Hasemann, Gerdts and Bergmann2020). In the Arctic, marine plastic is typically locally frozen into sea ice, and one floe of ice can accumulate plastic from multiple marine sources over time (Peeken et al., Reference Peeken, Bergmann, Gerdts, Katlein, Krumpen, Primpke and Tekman2018). Parsing these sources is difficult with sparse observations. As well, plastic entrained in ice does not remain so forever; most ice melts within 100 km of its formation site, and approximately one-fifth melts in a different exclusive economic zone (EEZ) from where it is formed. Because of thinning and accelerating ice, exchange of ice across EEZs has increased relative to the 1990s (DeRepentigny et al., Reference DeRepentigny, Jahn, Tremblay, Newton and Pfirman2020; Newton et al., Reference Newton, Pfirman, Tremblay and DeRepentigny2017), with implications for regional policy interventions. These factors influence our choice of the full Arctic Basin as a reservoir in this present study.
This manuscript focuses on surface transport of plastics, excluding vertical transport, and so neglects a significant sink of plastic pollution, the seafloor. Fram Strait has a high concentration of plastic in its seafloor sediments (Parga Martínez et al., Reference Parga Martínez, Tekman and Bergmann2020), especially relative to other Arctic seabeds (Woodall et al., Reference Woodall, Sanchez-Vidal, Canals, Paterson, Coppock, Sleight and Thompson2014), and this sink is discussed in our analysis. We also do not consider biological transport in this analysis, restricting our calculations instead to physical transport and physical gateways with clear mitigation approaches. We do not include estimates of atmospheric transport of plastics to the Arctic (Bergmann et al., Reference Bergmann, Mützel, Primpke, Tekman, Trachsel and Gerdts2019; Evangeliou et al., Reference Evangeliou, Grythe, Klimont, Heyes, Eckhardt, Lopez-Aparicio and Stohl2020) or glacially-entrained plastics (Ambrosini et al., Reference Ambrosini, Azzoni, Pittino, Diolaiuti, Franzetti and Parolini2019), in part because these pathways are still only minimally quantified. We also present simple, back-of-envelope calculations giving potential future ranges for plastic fluxes with different interventions. These calculations admittedly lack the nuance of coupled climate model predictions, but that is not the aim of this present study. Rather, we hope to illustrate the relative contributions of different natural and industrial fluxes, and to examine the policy tools that might have proportionally the most impact on reducing these fluxes.
Current governance environment
The international governance of the Arctic is complex, involving nation States, territorial waters, EEZs, and the Central Arctic Ocean, the last of which is classified as high seas and belongs to no one. Nations are responsible for regulating their own territory, their territorial waters (up to 12 nautical miles from shore) and, in relation to economic activities, their EEZ (up to 200 nautical miles from shore) (UN Convention on the Law of the Sea) and so any response to plastic pollution will ideally be regional in nature but implemented primarily in domestic law a (PAME, 2021) cross multiple countries.
The primary intergovernmental forum within the Arctic is the Arctic Council which was established 1996 to provide an arena for the Arctic nations to negotiate at a ministerial level. Plastic pollution has been a recent focus of the council under the Icelandic chairmanship, and a regional action plan on marine litter was published in May 2021 (PAME, 2021). However, decisions of the Arctic Council are not binding and the organization has no authority to compel compliance with its regional action plan. Because the chairmanship rotates every two years, plastics may or may not be a priority of the Arctic Council in the future. All eight of the Arctic nations are members of the Council, and many other nations with interests in the Arctic have observer status.
Aside from the Arctic Council, there are various international treaties which already seek to regulate pollution within the marine environment, many of which apply to the disposal or release of plastics in the ocean. These treaties include the London Convention and Protocol, the UN Convention on the Law of the Sea, the International Maritime Organization’s MARPOL Annex V, and, specifically in the Arctic, the Polar Code. Details of the treaties and their provisions regarding plastic pollution are set out in Table 1.
Table 1. Governance tools/fora and applicable sections for addressing marine plastic pollution

Despite the existence of these treaties, the flow of plastic into the Arctic Ocean is continuing unabated. Identifying and quantifying plastic entry points to the Arctic in spite of these international treaties enables recommendations which target the source of the problem. Even with this apparent shortfall of the provisions of the current treaties, it is still recommended that these are the ideal platform on which to base any future policies. This is because such treaties provide a basis for legal enforcement, rather than relying on the good-faith effort of signatories to fulfill their commitments. Current efforts, such as the Regional Action Plan recently published by the Arctic Council, are notable in their attempts to seek a reduction in plastic pollution but have no binding authority nor enforcement mechanisms (PAME, 2021).
Another benefit of using the existing treaties as a platform for creating more effective plastic management tools is that these treaties tend to be signed by a large number of nations, not merely the Arctic States. The waters of the Arctic Ocean are used by more than just the Arctic coastal states and, as the sea ice melts and sea routes and fishing opportunities open up, an increasing number of non-Arctic nations will be exploiting opportunities in the Arctic. A response to plastic in the Arctic Ocean which effectively binds more parties than merely the Arctic states is far more likely to be successful than one which concentrates only on members of the coastal nations or the members of the Arctic Council. A good example of a treaty which works in this way is the Central Arctic Ocean Fisheries Agreement, which came into force in 2021. The agreement was reached under the auspices of UNCLOS and UNCLOS’s 1995 Agreement on Highly Migratory Fish Stocks and was signed by the Arctic Coastal States as well as Iceland, China, Japan, South Korea and the European Union.
Methods
In order to quantify the roles of ocean and ice in physically transporting microplastic into and out of the Arctic, we must define a series of gateways similar to those used in seminal freshwater budgets (Aagaard & Carmack, Reference Aagaard and Carmack1989; Carmack, Reference Carmack, Lewis, Jones, Lemke, Prowse and Wadhams2000; Serreze et al., Reference Serreze, Barrett, Slater, Woodgate, Aagaard, Lammers and Lee2006). Guided by the work of the Arctic-Subarctic Ocean Fluxes program (Dickson et al., Reference Dickson, Meincke and Rhines2008) and the availability of river outflow data, we exclude the Greenland-Iceland-Norwegian Seas from this calculation. Thus, our defined openings to the Arctic Ocean lie at the Bering Strait, the Fram Strait, and the Davis Strait, the last of which captures the majority of Arctic-Atlantic volume exchange in the Canadian Archipelago (Curry et al., Reference Curry, Lee, Petrie, Moritz and Kwok2014) (Fig. 1).

Figure 1. Summary map of study area and order of magnitude flux estimates. The red outline shows the total extent of the Arctic Ocean watershed, and red dots are monitoring stations for each of the eight principal watersheds in purple (Holmes et al., Reference Holmes, Shiklomanov, Tank, McClelland and Tretiakov2015). Plastic flux categories are coded by color: purple are river catchments, green ice/ocean principal flow pathways, and dark blue areas of highest frequency ship traffic (Eguíluz et al., Reference Eguíluz, Fernández-Gracia, Irigoien and Duarte2016). Gateways are abbreviated as: FS (Fram Strait), DS (Davis Strait), BS (Bering Strait), BSO (Barents Sea Opening). Flux order-of-magnitude estimates are presented in tonnes/year at lower right, with arrows in representing ocean, fishing, shipping, and rivers. Arrows out represent ocean and ice. Shown for reference are the Polar Code area (green) and the median June sea ice extent from 1981 to 2010 (nsidc.org, orange). Basemap generated with Antarctic Mapping Tools for Matlab (Greene et al., Reference Greene, Gwyther and Blankenship2017).
The three principal plastic sources we consider are rivers, ice/ocean fluxes, and shipping/fishing. Errors and decadal projections in each of these estimates are based on stated uncertainties in published data as well as published long-term trends; errors are propagated through these trends. Where there are no robust trends, we assume no trend. We opt to describe annual average plastic fluxes, since the substantial seasonal variations in fishing, shipping, and the hydrologic cycle are challenging to capture.
Rivers
Important at lower latitudes, river runoff (Jambeck et al., Reference Jambeck, Geyer, Wilcox, Siegler, Perryman, Andrady and Law2015) in the Arctic plays a slightly lesser role in plastic input to the ocean. While there is low population density, the watersheds draining into the Arctic Ocean are large, and waste management in many remote Arctic communities is limited relative to lower-latitude cities. To quantify Arctic rivers’ contributions to our plastic budget, we apply a global river model to the Arctic. This model estimates the empirical relationship between river plastic output and population density, municipal solid waste (MSW), and river outflow for 40,760 watersheds worldwide (Lebreton et al., Reference Lebreton, van der Zwet, Damsteeg, Slat, Andrady and Reisser2017).
Here we consider the eight largest Arctic watersheds, which constitute 70% of the pan-Arctic watershed (Holmes et al., Reference Holmes, Shiklomanov, Tank, McClelland and Tretiakov2015): the Yenisey, Lena, Ob, Mackenzie, Yukon, Kolyma, Pechora, and Severnaya Dvina. These data are collected by the Arctic Great Rivers Observatory (Shiklomanov et al., Reference Shiklomanov, Holmes, McClelland, Tank and Spencer2021). We also use stated uncertainties (Shiklomanov et al., Reference Shiklomanov, Yakovleva, Lammers, Karasev, Vörösmarty and Linder2006) and estimated annual trends in discharge (Blunden & Arndt, Reference Blunden and Arndt2019) to project decadal changes to 2050.
We use these data together with demographic information (Bogoyavlenskiy & Siggner, 2004; Kaza et al., Reference Kaza, Yao, Bhada-Tata and Van Woerden2018; Larsen & Fondahl, Reference Larsen and Fondahl2015). Because each river’s watershed lies within the USA, Canada, or Russia, we use national demographic data and scale by current watershed population to determine per capita plastic waste generation. Using 2016 adjusted data as well as projections for 2030 and 2050, we estimate the linear trend of decadal changes in watershed population and municipal solid waste generation (R 2 > 0.97). While this method does not capture intranational migration, especially in Russia’s rapidly urbanizing Arctic (Larsen & Fondahl, Reference Larsen and Fondahl2015), it provides a rough estimate for comparison between riverine and other sources of marine plastic pollution in the Arctic after proposed interventions (Table 2).
Table 2. Interventions by pathway

Ice & Ocean
To estimate the amount of plastic transported in and out of the Arctic Ocean by ice and liquid seawater movement, we combine flux estimates from four primary gateways—the Fram Strait, the Bering Strait, the Barents Sea Opening, and the Davis Strait—with field-based plastic concentration estimates selected for proximity to each flux gateway. Even with this consideration of sampling location, plastic (especially microplastic) concentration is acknowledged to vary widely within environments, so we present the calculated plastic fluxes as order-of-magnitude estimates (Table 3). The Litterbase tool from the Alfred Wegner Institute (litterbase.awi.de) is used to support this literature review. Cózar et al., Reference Cózar, Martí, Duarte, García-de-Lomas, van Sebille, Ballatore and Irigoien2017 report that the majority of plastics in their collected floating plastic debris range from 0.8 mm to 3.2 mm in length. When field-based plastic concentrations are stated by number, we use a logarithmic formula (Cózar et al., Reference Cózar, Fidel Echevarría, González-Gordillo, Irigoien, Úbeda, Hernández-León and Duarte2014) to convert items per area to mass per area, where the relationship between mass and numerical concentrations for plastic items is log(mass) = 1.21*log(number) – 3.99. In the event that plastic distribution is reported by area rather than volume, we use the reported height of collection method (e.g., the height of the Manta trawl net from Lusher et al. [Reference Lusher, Tirelli, O’Connor and Officer2015]) to convert to volume. In the event of ice concentrations, we use the reported height of ice cores (e.g., Peeken et al., Reference Peeken, Bergmann, Gerdts, Katlein, Krumpen, Primpke and Tekman2018).
Table 3. Plastic flux estimates in ice and ocean from multiple sources. Volume fluxes (1 Sv = 106 m3s−1) and trends for each gateway. A sampling of proximal plastic concentrations from field measurements is provided; when field-based plastic concentrations are stated by number, we use a logarithmic formula (Cózar et al., Reference Cózar, Fidel Echevarría, González-Gordillo, Irigoien, Úbeda, Hernández-León and Duarte2014) to convert items per area to mass per area. Sampling method of each study (for example, a 0.16 m-high Manta net by Lusher et al., Reference Lusher, Tirelli, O’Connor and Officer2015) is used to convert this quantity to per-volume; plastic flux is then calculated by multiplying the transport rate by this derived mass. Given the patchiness in plastic concentrations, annual plastic flux is presented as an order-of-magnitude estimate. We note that while the size range of plastics in studies may vary, and the majority of studies examined plastics on the scales of micrometers to millimeters, in this manuscript we consider all plastics under 2.5 cm, which encompasses both meso- and microplastic (GESAMP, 2019). Given that plastics of these size classes are typically highly buoyant, this approach serves our study of surface transports; we acknowledge that it may introduce error into our estimates if sampling studies on report plastics of a certain size. Standardization of plastic classification and reporting is necessary for future work in this realm; and indeed the majority of authors listed in the table uniformly define and examine microplastics smaller than 5 mm.

The Bering Strait oceanic inflow and Fram Strait ice export are the two fluxes that have statistically significant annual or decadal trends, and so future projections of the other gateways assume zero flux changes; any published uncertainties are propagated from concentration and flux estimates. In order to calculate flux estimates, we multiply volumetric ocean and ice fluxes by estimated plastic mass.
Shipping & fishing
We examine fishing and other shipping both by unique vessel traffic and by distance traveled within the Polar Code area, scaling global estimates of plastic pollution from shipping and fishing by the Arctic’s relative share of traffic. These two ways of quantifying marine plastic pollution allow us to target interventions per ship or per nautical mile, and to explore hypothetical situations after the expiry of the Central Arctic Ocean fishing moratorium in 2035. We use Arctic Ship Traffic summary data ( PAME – Arctic Shipping Status Report #1, n.d.) from 2013 to 2019 to estimate long-term trends in plastic waste from shipping and fishing.
Using summary data from PAME’s Arctic Ship Traffic Database, ( PAME- Arctic Shipping Status Report #1, n.d.) we calculate the linear trend in ship numbers and in distance from 2013 to 2019 (distance R 2 = 0.97, number R 2 = 0.60). Fishing constitutes 45% of distance traveled and 41% of ship numbers. ( PAME- Arctic Shipping Status Report #1, n.d.) Because the highest-density ship traffic is near to the coasts (Eguíluz et al., Reference Eguíluz, Fernández-Gracia, Irigoien and Duarte2016), we do not quantify the effect of the Central Arctic Ocean fishing moratorium. As traffic increases in the future and fisheries shift in a changing climate, this omission of the moratorium’s effects on our calculations may bear revisiting. To estimate plastic concentrations, we assume a constant value of 1.15 million tonnes per annum globally for fishing, 0.6 million tonnes per annum for other shipping, and 0.016 million tonnes per annum for marine paint (Sherrington, Reference Sherrington2016). Since Arctic fishing and shipping are estimated to represent 12.4% and 9.3% of global traffic (Eguíluz et al., Reference Eguíluz, Fernández-Gracia, Irigoien and Duarte2016), we scale plastic estimates accordingly. We then generate values of plastic pollution “per ship” and “per distance” and use the earlier calculated trends in ship numbers and distance to estimate plastic pollution from fishing and other shipping to 2050. Uncertainties are calculated for the linear fit and propagated forward in time.
Results
Comparison of calculated plastic fluxes (Fig. 1) shows clearly that fishing and other shipping represent the largest contributors of plastic pollution to the Arctic marine system, contributing an estimated 105 tonnes per annum. Ocean import and export are roughly balanced, favoring a slight export through the ocean, though export through sea ice is several orders of magnitude larger than that in the surface ocean, calculated at 10−3 tonnes per annum relative to 10−8 (Table 3). The magnitude of ice export points to the role that ice might play in “storing” plastic and removing it from the surface ocean through freezing; the substantially smaller amount of ocean and ice transport relative to river and shipping/fishing may be indicative of the role of diffuse sources relative to the “point sources” otherwise considered and of the high variance in ocean and ice plastic concentration field measurements.
Up to 12.7 × 10⁶ tonnes of plastic are estimated to have entered the ocean in 2010 from mismanaged waste worldwide (Jambeck et al., Reference Jambeck, Geyer, Wilcox, Siegler, Perryman, Andrady and Law2015). While the largest estimated annual input to the Arctic Ocean (from fishing; Fig. 3) is an order of magnitude lower, it does not diminish the importance of tackling this pollution problem in such a unique and vulnerable region as the far north.

Figure 2. Plastic export from Rivers including decadal projections. Plastic input to the Arctic Ocean from the eight largest rivers. Top: Each river’s current and projected plastic flux, based on trends in population, river flow, and mass of municipal solid waste. Bottom: Projections for the three largest riverine plastic contributors under reduced plastic scenarios. Here, “MSW” refers to municipal solid waste. Shading indicates projected uncertainty.
The estimated plastic fluxes of Jang et al. (Reference Jang, Lee, Hong, Mok, Kim, Lee, Choi, Kang and Lee2014) and Turrell (Reference Turrell2020) into the waters surrounding South Korea and Scotland, respectively, were nearly 104 tonnes per annum and 102–103 tonnes per annum. In each of these cases, riverine input is a major contributor to marine plastic pollution, likely owing in part to the regions’ high population density relative to that of the Arctic. We find that riverine plastic pollution entering the Arctic Ocean is on the order of 10−1 (Fig. 2), a figure greatly diminished by other direct sources such as shipping and fishing.
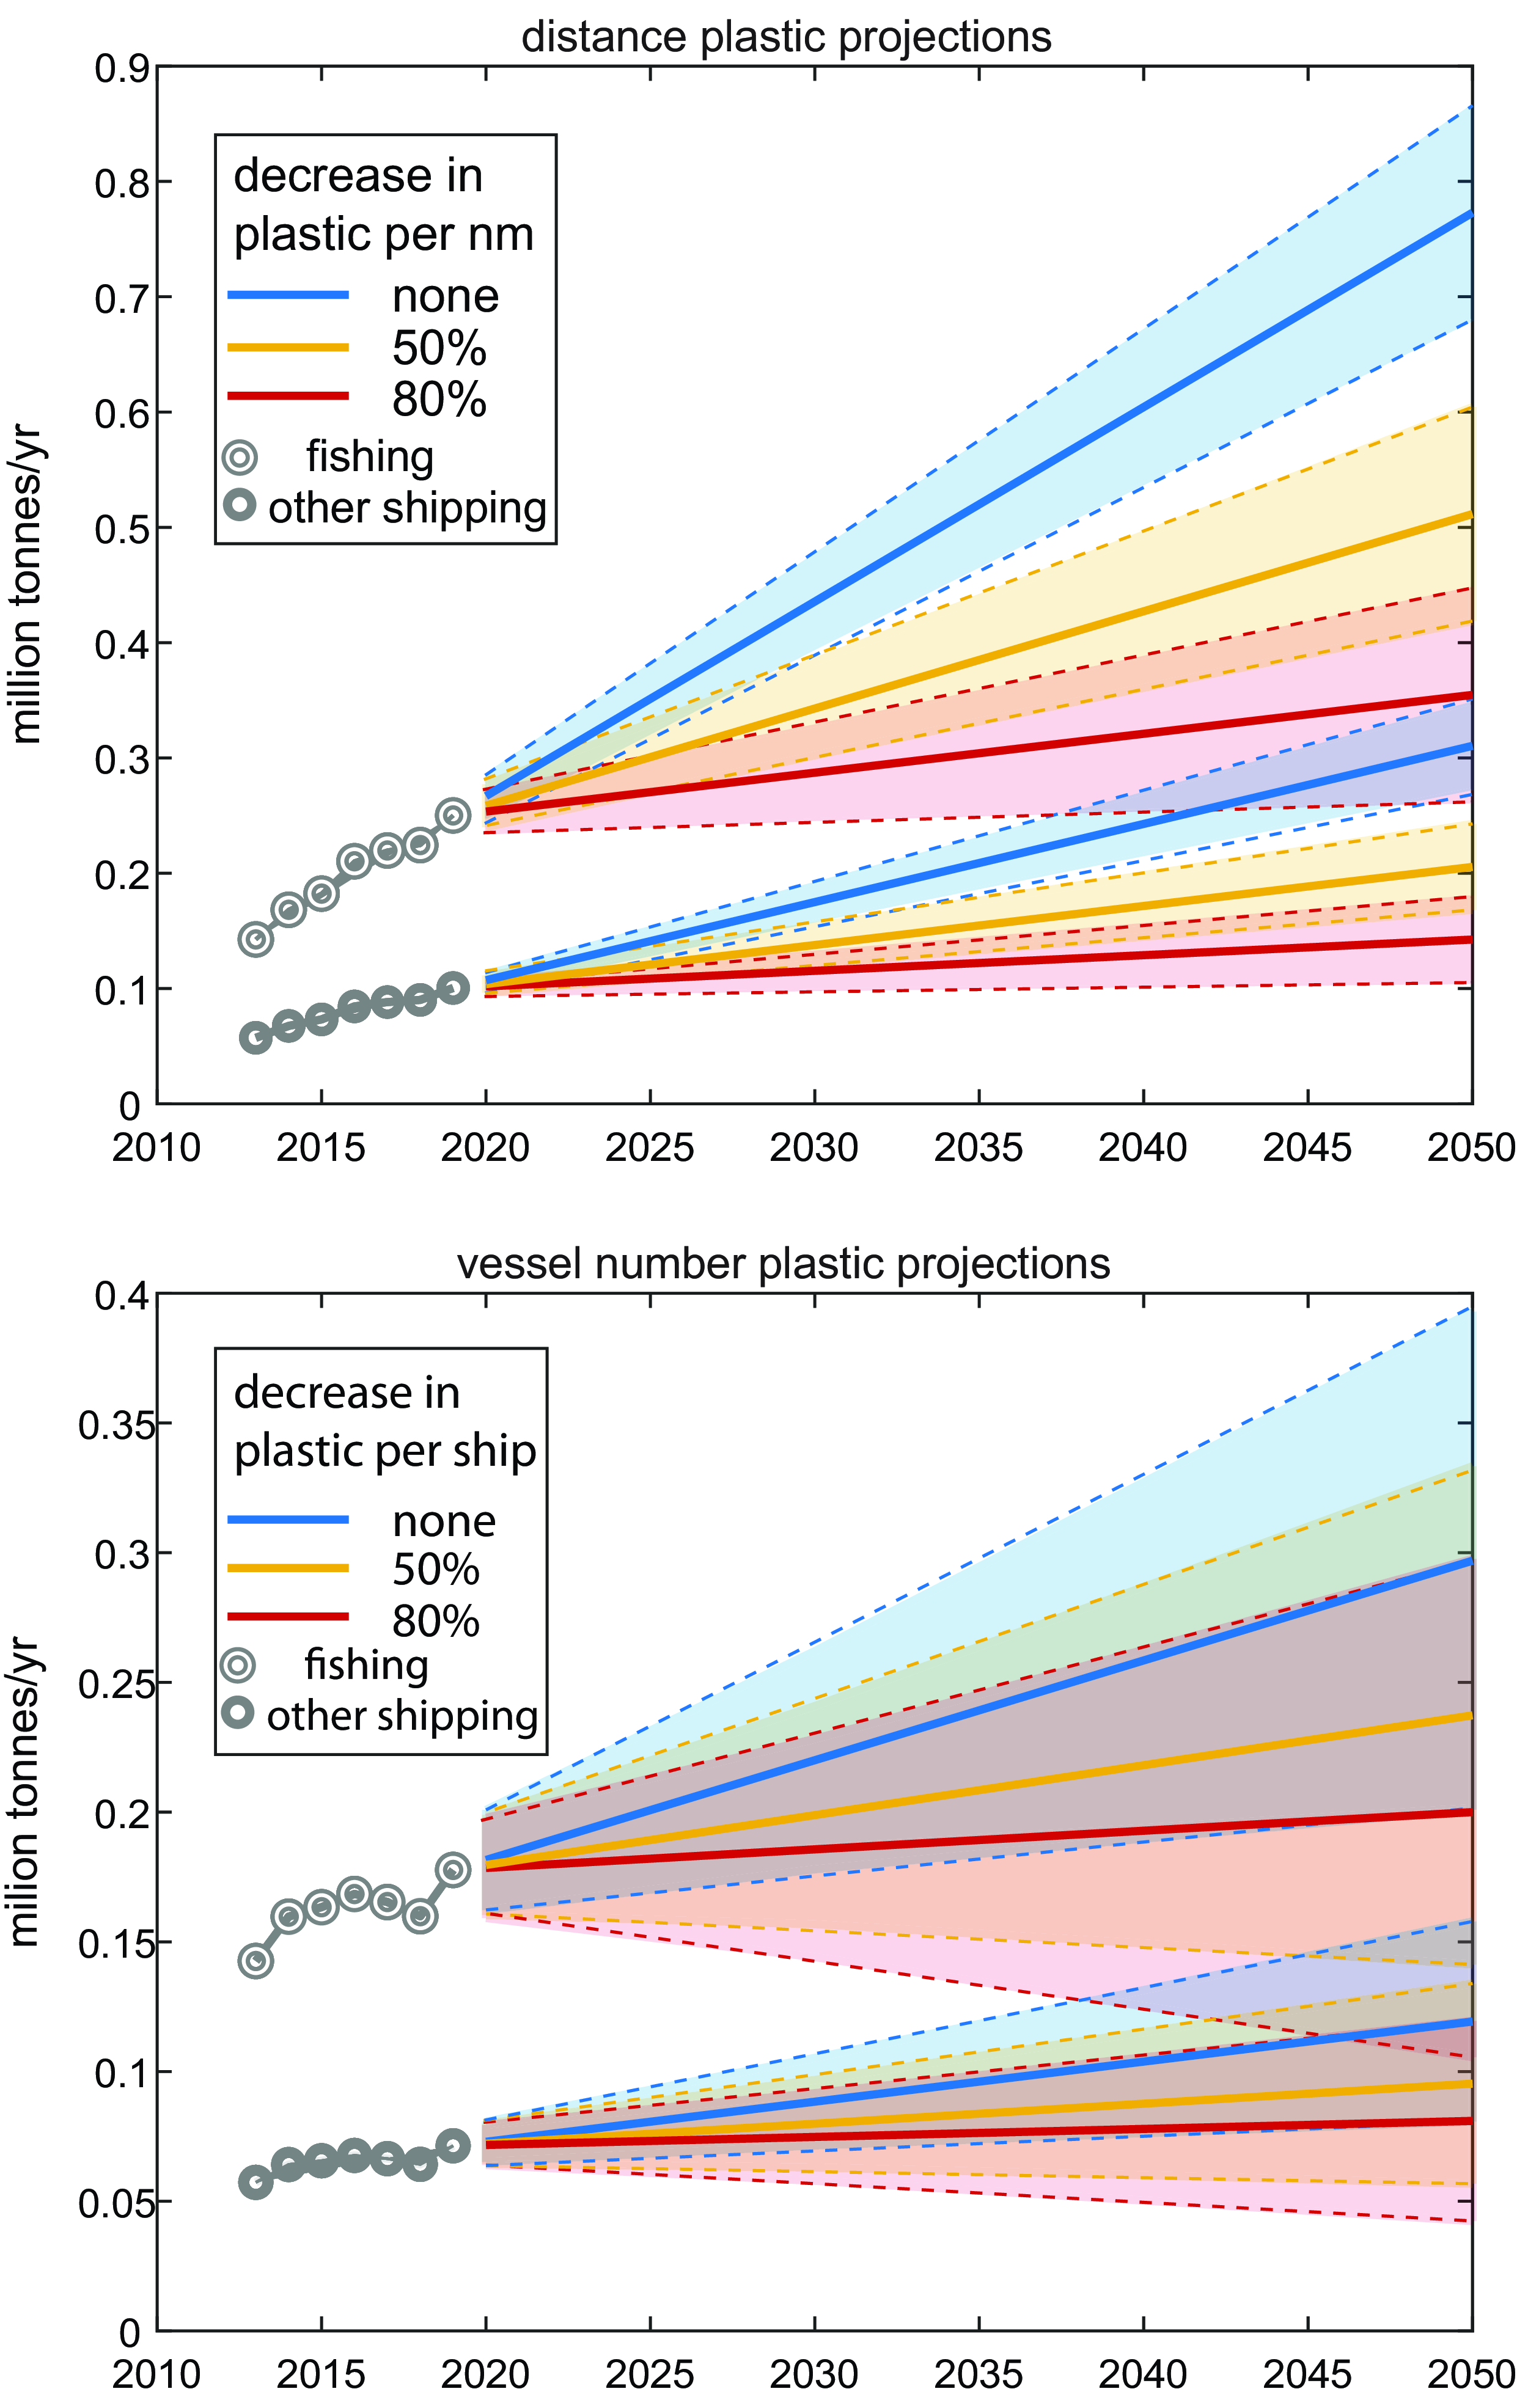
Figure 3. Shipping & Fishing plastic fluxes including decadal projections. Plastic input to the Arctic Ocean from fishing vessels and all other shipping vessels under reduced plastic scenarios. Projections are calculated both by distance (top; plastic per nautical mile traveled) and individual vessels (bottom). Shading indicates projected uncertainty.
Discussion
In order to understand the relative impacts of any proposed policies on each plastic pathway, ice/ocean, riverine, and shipping/fishing, we consider different plastic reduction scenarios: 10%, 20%, and 50% reduction. We later map these scenarios to each intervention.
Riverine plastic pollution poses an interesting challenge: As each river enters the Arctic Ocean, there is an opportunity for a “point source” intervention, such as booms or filtration. However, the changes in river plastic fluxes are smaller than the uncertainty in existing flux estimates (Fig. 2). Additionally, the amount of plastic entering the Arctic Ocean from rivers, on the order of 10−1 tonnes/year total, is at least six orders of magnitude lower than that from fishing and shipping (Fig. 3). Ocean and ice gateways are yet smaller by several orders of magnitude, owing in part to their dilute nature. Additionally, difference in the sizes of plastic particles considered by different studies may have contributed to a low bias in ocean and ice flows, dependent on the authors’ ability to detect or interest in examining extremely small plastic particles.
Unlike rivers, ice and ocean gateways do not offer easy cleanup solutions, but the flux numbers at these points provide important context for the other numbers considered because of their potential for long-term change and the high concentrations of plastic debris in ice and on the seafloor. Of the ocean gateways, only the Bering Strait ocean gateway has a statistically significant long-term trend (Woodgate, Reference Woodgate2018). However, ice export through the Fram Strait is also decreasing decadally (Spreen et al., Reference Spreen, Steur, Divine, Gerland, Hansen and Kwok2020). The high concentration of deposited seafloor plastics at Fram Strait, with a plastic litter density rivaling that of sea ice (Parga Martínez et al., Reference Parga Martínez, Tekman and Bergmann2020; Woodall et al., Reference Woodall, Sanchez-Vidal, Canals, Paterson, Coppock, Sleight and Thompson2014), 813 to 6717 items per km2 (41% plastic) and O[101] items per 50 ml of sediment compared to 108 to 4500 NL−1 in sea ice (Peeken et al., Reference Peeken, Bergmann, Gerdts, Katlein, Krumpen, Primpke and Tekman2018; Obbard et al., Reference Obbard, Sadri, Wong, Khitun, Baker and Thompson2014), suggests that this natural drain is substantial, and so its decline is noteworthy and should be quantified in future work.
The potential changes in shipping plastic pollution fall outside of uncertainty and are larger than rivers. An 80% decrease in fishing plastic results in a flux on the same order of magnitude as shipping under a business-as-usual scenario (Fig. 3). This change suggests that fishing is the area of highest potential impact for plastic pollution reduction efforts; it also underscores the importance of the Central Arctic Ocean fishing moratorium for constraining future pollution projections.
Recommended policy interventions
Following the modelling of where policy interventions could have the most impact, it is possible to come up with a number of recommendations of specific policies which, if adopted, could reduce the level of plastics by the levels identified as necessary to ensure there is no further increase of plastics in the Arctic. The recommendations are outlined here and are quantified below. For the most part, these recommendations are not seeking new treaties – the treaties outlined above already prohibit plastic being thrown into the ocean – but instead are mechanisms by which the various prohibitions on plastic could be implemented or enforced more effectively on a regional level.
Building a regional response using the authority of UNCLOS or the IMO: As the Arctic Ocean is the responsibility of so many different nations, a regional response to plastic pollution is necessary. Instead of relying on the Arctic Council, it would be better for a regional response on plastics to be created under the auspices of Article 210 of UNCLOS or as part of the work of the IMO. A regional response under UNCLOS or the IMO would have far more regulatory strength than the Arctic Council and a dedicated regional response to plastics is more likely to be successful than plastics becoming one of a long list of changing priorities in the Arctic Council. Using UNCLOS or the IMO would avoid difficulties with non-Arctic actors such as China and Japan which only have observer status in the Arctic Council but who are likely to play a large role in future activity within the Arctic area. The USA is not a signatory to UNCLOS but operates within its provisions for matters such as regional fishing management.
Reconciling diffuse vs. point-source pollution: Because the Arctic is fed by enormous river catchments that are sparsely settled, plastic may enter the water at many different points. Thus, one avenue for intervention is to make use of known points of entry. Because sea ports already have a role in compliance with MARPOL-V plastic disposal, they are the obvious place from which the implementation of plastic reduction policies can take place. Making it easier and cheaper for vessels to return to port with their plastic rather than to leave it in the ocean should be a key aim.
Introducing a permitting scheme for ships entering or passing through the Polar Code area: Ships would pay a significant deposit for their permit which would be refunded if either they lost no plastic overboard or, if they did lose plastic overboard, they collected the same weight of plastic from the water as they had lost. Plastic collection points would need to be made available at all Arctic and near-Arctic ports for the deposit of plastic. An example of this already occurs in Iceland, where fishing nets may be deposited at coastal collection stations for recycling (https://www.urvinnslusjodur.is/voruflokkar/#veidarfaeri). Any money forfeited by ships would be used to cover the cost of beach clean-ups, providing waste disposal for Arctic communities and other projects which will reduce the amount of plastic in the Arctic Ocean. This would work alongside the provisions of MARPOL Annex V, such as the requirement for garbage disposal at ports and the Polar Code, with ships requiring a plastic permit alongside, or as part of, their Polar Code registration.
Recommended conservation component to tourism: Tourism is already a growing industry within the Arctic and much of the tourist access to the Arctic is by way of cruise ships. It is recommended that all tourist and cruise ships over a certain (small) size should be encouraged, or ideally required, to include an element of conservation, with guests invited to take part in clearing beaches of plastic debris, similar to the Association of Arctic Expedition Cruise Operators’ Clean Up Svalbard Project, which removes tens of tonnes of waste from archipelago beaches annually (https://www.aeco.no/guidelines/cleanup-guidelines/). One of the benefits of using cruise ships is that they are able to access remote beaches beyond settlements. Tourists in the Arctic are increasingly aware of their impact on the environment and many would appreciate the opportunity to take practical action to protect the environment.
Working toward the prohibition of the use of certain plastics within the Arctic Ocean: One example would be a requirement that all fishing nets must be made from a material other than plastic. Biodegradable nets, in materials such as hemp, are being developed and while they will be expensive at first, Arctic fishing is predicted to be a lucrative industry which will be able to support the cost if compelled to do so. Money from the plastic permitting scheme mentioned above could be used to pay for biodegradable nets for small scale fishermen. As there is currently a moratorium on fishing in the Central Arctic Ocean which will not expire until 2035, as well as bans on commercial fishing in the Arctic territorial waters of the USA and Canada, there is an opportunity to put in place regimes which reduce the amount of plastic being introduced to the Arctic marine environment from the start rather than requiring an already established industry to change.
MSW handling: Improving sanitation infrastructure and waste management for remote communities will decrease riverine plastic input to the Arctic Ocean. While this source of plastic is dwarfed by other inputs, settlements are clear point sources at which to address the problem with high rates of success. Long a source of concern for public health and economic reasons, the dearth of sanitary infrastructure in many of these communities provides an opportunity for plastic pollution mitigation as well.
Intervention quantification
The international agreements discussed form the background of marine pollution interventions, yet the true test of their efficacy is how much plastic they would actually keep from the ocean. Here we map each intervention to its affected pathway, the order of magnitude of projected plastic flux change, and the expected efficacy of each intervention (Table 2).
Efficacies are sorted into high, medium, and low, based on anticipated community buy-in as well as enforceability under international law. While qualitative estimates, these efficacy levels are based on technical discussions of policy compliance across fishing, (Expert Consultation on the Marking of Fishing Gear & Food and Agriculture Organization of the United Nations, 2016; Technical Consultation on Marking of Fishing Gear & Food and Agriculture Organization of the United Nations, 2018) consumer behavior (Ajayi & Reiner, Reference Ajayi and Reiner2020; Zwicker et al., Reference Zwicker, Brick, Gruter and van Harreveld2021) and party States (Fritz, Reference Fritz2020). For example, beach cleanups may be popular but they are unenforceable and challenging due to remoteness, earning a medium rating. They also have a relatively small impact on the magnitude of plastic pollution. Thus we suggest that a future reduction scenario is the 20% pathway described in Fig. 2.
Conclusion
This manuscript is a first, simplified attempt to quantify plastic fluxes of and various interventions regarding plastic in the Arctic Ocean. While it is clear that more in-situ measurement of plastic concentrations are necessary to fully describe the movement of these pollutants into and out of the Arctic system, the calculations presented in this paper give an overview of the magnitude of the problem, describe the scale of the major inputs of plastic into the Arctic Ocean and, importantly, provide both suggestions for actions which could be taken to ameliorate the levels of plastic in the Arctic ocean and attempt to quantify the impact which each of these would have. Due to point sources such as ships and rivers, as well as variable mesoscale ice and ocean structure, the inherent patchiness in plastic concentration and the continued decline of the sea ice cover mean that the fundamental physical behavior of plastic in the Arctic Ocean will continue to evolve.
Despite the ubiquity of plastic pollution in the Arctic marine environment, the problem is not intractable. Existing governance structures and international agreements have the potential for effective use as tools to decrease the amount of plastic in the Arctic Ocean. These agreements are valuable because they solve a regional problem across national legal structures, and have a degree of enforceability lacking in such good-faith action plans as that of the Arctic Council. We have described a series of interventions built on the legal foundation of these treaties, and quantified their impact on plastic fluxes; given the outsized influence of shipping and fishing on the introduction of plastic pollution to the Arctic Ocean, we find interventions targeting these sectors to be most effective.
Acknowledgments
The authors wish to thank the Editor as well as two anonymous reviewers for giving their time and energy to the improvement of this manuscript.
Financial support
This work was supported by the Gordon and Betty Moore Foundation (grant number GBMF7965) and by the Schmidt Futures Initiative.
Competing interests
The authors declare no conflicts of interest.


 Open access