


Introduction
Fertile soil is a fundamental factor in ensuring we achieve food security for our continuously growing global population. Soil acidity is one of the major land degradation problems across the world (Kochian et al., Reference Kochian, Hoekenga and Pineros2004). In Ireland, the grass-based dairy production system is dependent on the conversion of grass to milk and meat to maximize profitability and efficiency (Hanrahan et al., Reference Hanrahan, Mchugh, Hennessy, Moran, Kearney, Wallace and Shalloo2018). Maximum grass utilization is largely restricted by soils with poor soil fertility and impeded drainage (Daly et al., Reference Daly, Tuohy, Peyton, Wall and Fenton2017). Low soil pH and inadequate soil test phosphorus (STP) and soil test potassium (STK) are major limiting factors as regards output potential on grassland farms and must be optimized in order to increase nutrient efficiency and availability, as well as improve soil structure and increase microbial activity (FAOI and Teagasc, 2016).
Lime application (addition of CaCO3) remains a common agricultural practice on acidic agricultural soils across the world (Paradelo et al., Reference Paradelo, Virto and Chenu2015). Lime helps increase nutrient availability and efficiency, it assists the growth of rye grasses and clover, it accelerates the activity of nitrogen-fixing bacteria and it increases earthworm activity which in turn improves soil physical structure (Wall and Plunkett, Reference Wall and Plunkett2020). FAOI and Teagasc (2016) reported that there is a 7:1 return on investment from liming through increased herbage production. The rate at which lime is removed from agricultural land from leaching is influenced by a soil drainage classification. Leaching can remove between 250 and 635 kg/ha lime per year, one finished beef animal or 10 000 litres of milk will remove approximately 30 kg of lime and 1 kg of chemical nitrogen will remove 2 kg/ha of lime (FAOI and Teagasc, 2016). Average lime usage in Ireland from the 1970s to early-1980s was 1.7 million tonnes per year, since the early 1980s lime usage has only exceeded 1 million tonnes in 4 years over a 30-year period (FAOI and Teagasc, 2016). Calcium ground lime (calcitic lime) is the most common form of lime used in Ireland. Ground lime used on agricultural land must comply with the Department of Agriculture Food and Marine (DAFM) specifications (SI 248). The standard for lime, as set out under commission regulation by the EU in 2013 states that fine lime product must have a minimum neutralizing value of not <50%. Ninety-seven per cent of the product must pass through a 2 mm sieve, 80% through a 1 mm sieve, 50% through a 0.3 mm sieve and 30% through a 0.1 mm sieve. The smaller particles are more rapidly made available, causing a greater change in soil pH in comparison to the coarser material which may take longer to break down (FAOI and Teagasc, 2016). Granulated lime is a finely ground lime (<0.16 mm) that is processed into granules. Granulated lime is more reactive than ground lime (Jones and Mallarino, Reference Jones and Mallarino2018), and is advised only to be used as a maintenance product to sustain soil pH at optimum levels (FAOI and Teagasc, 2016). Due to the higher proportion of fine particle size in granulated lime, it is much more reactive and has a high water-soluble proportion in comparison to ground lime. It is advised that ground lime:granulated lime products are applied to agricultural land at a ratio of 3:1, i.e. three tonnes of ground lime is equivalent to 1 tonne of granulated lime (FAOI and Teagasc, 2016), due to the proportion of reactive lime available in each lime product and also the cost difference associated with each liming product. Granulated lime application has shown to maintain or slightly increase soil pH at contrasting low rates and also shown to have no difference in herbage yield, soil pH and exchangeable cations when compared to ground lime (Higgins et al., Reference Higgins, Morrison and Watson2012). This suggests that granulated liming products should be used to maintain soil pH at optimum levels, largely due to the low required application rates, convenience and economic cost associated with large application rates of granulated lime to fix soil pH.
The aim of lime application is to raise soil pH into a range of 5.7–6.5 in temperate regions with a target soil pH for mineral grassland soils of 6.3 (Wall and Plunkett, Reference Wall and Plunkett2020). In 2019, it was reported that of the 30 466 soil samples tested in Ireland, 62% of samples were in the optimum pH range of >6.2, as opposed to 38% in 2014 across a range of soil types and agricultural enterprises (Wall and Plunkett, Reference Wall and Plunkett2020).
A soil's chemical environment is largely controlled by soil pH, which will determine plant nutrient availability (McKenzie et al., Reference McKenzie, Jacquier, Isbell and Brown2004). Soils become acidic due to the leaching of base metals from parent materials during soil formation, exchangeable protons from soil organic matter (SOM) and the application of nitrogen fertilizer. In regions where rainfall exceeds evapotranspiration, soils acidify naturally under vegetation (Connor et al., Reference Connor, Loomis and Cassman2011). A major factor influencing a soil's fertility is its cation exchange capacity (CEC). Of the mineral particles in soil (sand, silt and clay), clay-sized fractions have the highest CEC. This is related to mineralogical composition (Caravaca et al., Reference Caravaca, Lax and Albaladejo1999). Natural processes such as the leaching of cations and the decomposition of organic matter (OM) cause a change in soil pH. The lower the CEC of a soil the faster soil pH will increase or decrease with time and the lower the buffering capacity of the soil.
Soil physical structure has a major influence on overall agricultural productivity, as well as efficiency in responding to lime application. The level of structure within a soil influences tortuosity, porosity and the ability of soil to transmit water and air (Moore, Reference Moore2001). In both temperate and tropical regions, lime has shown to have conflicting effects on soil structure. In some instances, the addition of lime has shown to reduce infiltration rates and aggregate stability and increase clay dispersion (Castro and Logan, Reference Castro and Logan1991; Roth and Pavan, Reference Roth and Pavan1991), this however is a short-lived effect. Other research has shown that liming increases water holding capacity (Ayer and Hoyt, Reference Ayer and Hoyt1981) and decreases aggregate stability (Czeratzki, Reference Czeratzki1972), infiltration (Castro and Logan, Reference Castro and Logan1991) and surface cracking (Ayer and Hoyt, Reference Ayer and Hoyt1981). McDowell (Reference Mcdowell and Wallingford2008) showed that sward and soil damage causes a reduction in pasture production and utilization. Research carried out by Tran et al. (Reference Tran, Cui, Tang, Audiguier and Cojean2014) showed that lime applied to clay soils increased intra-aggregate pore size which in turn increased hydraulic conductivity. Good soil structure is a key soil physical property desired in soil, and lime application has shown to have a positive impact on aggregate structure (Blomquist et al., Reference Blomquist, Simonsson, Etana and Berglund2018). Lime application can improve soil chemistry to maximize agronomic output; it is important that soil structure is maintained or indeed improved in order to utilize increased herbage productivity. There was improved aggregate stability and hydraulic conductivity on sodic soils after the application of 5 tonne lime/ha (Bennett et al., Reference Bennett, Greene, Murphy, Hocking and Tongway2014). The effect of lime on soil structure has not yet been proven on Irish soils.
The objective of the current study was to firstly, compare two lime products with regards to their ability to counteract soil acidity and increase nutrient availability over time; secondly, to determine the rate of lime product required to counteract soil acidity and achieve optimum pH on three naturally acidic soil types and finally, analyse the soil physical properties over time across the contrasting lime products, treatment rates and soil types.
Materials and methods
Site description
A site was selected on each of the three commercial dairy farms, dominated by soils with high proportions of fine soil particles (silt and clay), high levels of rainfall (1298–1622 mm annually) and poor soil fertility in southwest Ireland (Table 1). Each site was in a continuous grazing system by dairy cows for milk production (Byrne et al., Reference Byrne, Gilliland, Delaby, Cummins and O'Donovan2018). Grazing frequency was uniform on each individual site with each site being grazed at 20–30 day intervals during the grazing season. All farms are participants in the Teagasc ‘Heavy Soils Program’, which aims to demonstrate methods to improve grassland productivity and utilization and sustain viable farm enterprises on poorly drained soils (O'Loughlin et al., Reference O'Loughlin, Maher, Courtney and Tuohy2012). Site 1 was located in Kiskeam, Co. Cork (52°12′N 9°08′W), site 2 was located in Athea, Co. Limerick (52°27N 9°19W) and site 3 was located in Castleisland, Co. Kerry (52°13N 9°28W). Grass varieties were sown at a seeding rate of 34.5 kg/ha. Site 1 was reseeded in 2014, site 2 was reseeded in 2009 and site 3 was reseeded in 2014.
Table 1. Initial soil properties and soil texture for all sites

a Morgan's soil test extractable concentration.
b Base Saturation percentage.
c A group of soils with similar profiles developed from similar parent material under comparable climatic and vegetational conditions.
Experimental treatments and design
A randomized complete block design was imposed on each of the three sites with four blocks, each having seven treatment plots. Treatment plots were 6 × 6 m (36 m2) in size. The experimental set up was a 2 × 3 factorial design + 1, namely ground lime at three rates (7.5, 5 and 2.5 tonnes/ha), granulated lime at three rates (7.5, 2.5 and 1.5 tonnes/ha) plus a control. Both lime products are derived from calcitic lime (CaCO3). Ground lime had a neutralizing value ≥50% and granulated lime had a neutralizing value ≥90%. At site 1, treatments were applied in March 2015 and at sites 2 and 3, treatments were applied in September 2015. Treatments were applied in a single application at the experimental set-up stage and no additional lime product was applied over the duration of the experiment.
Total nitrogen (N), P and K were applied across each site in the form of chemical and organic fertilizer in the form of animal manure. Nutrient application rates were uniform across each experimental plot within each site. The total mean annual application rate of inorganic and organic N, P and K fertilizer across sites was 332, 47 and 126 kg/ha, respectively.
Experimental measurements
Soil chemical and physical analysis was carried out prior to treatment application at the experimental setup in each plot and at 6-month intervals thereafter until March 2018.
Chemical analysis
Twelve soil cores were taken at random to form one composite sample from each plot using a 4 cm radius × 10 cm height soil corer at each time point. Soil core samples were taken from the central 5 × 5 m area of the plot to negate edge effects. The soil cores were prepared by oven drying at 40°C for 1 week and sieving through a 2 mm sieve. All soil samples were analysed at Teagasc, Johnstown Castle, Co. Wexford.
SOM was determined using a 5 g subsample of the original soil samples taken across each individual experimental site by the loss on ignition method. This method quantifies the proportion of oxidizable OM by weight, determined as the weight loss of a given sample following high-temperature oxidation in a muffle furnace at 500°C (Gavlak et al., Reference Gavlak, Horneck, Miller and Kotuby-Amacher2003). Soil texture analysis was determined using the pipette method (Standard, 1989).
Soil pH was determined using a ratio 1:2 (soil: water) with a pH probe (WTW, Germany).
The Mehlich III method (Ziadi and Tran, Reference Ziadi and Tran2007), a modification of the Mehlich II test (Mehlich, Reference Mehlich1984), was employed to analyse soil extractable nutrients. A 1.5 g subsample was added to a 50 ml tube. Mehlich III reagent (a dilute acid-fluoride-EDTA solution with a pH of 2.5) was added to the tube in a 1:10 (soil:solution) ratio and placed on a gyratory shaker for 5 min at 180 rpm. The solution was filtered through Whatman no. 42 filter paper. The filtrate was analysed for P, K, Al, Ca, Fe, Mg and Mn using inductively coupled plasma-optical emission spectroscopy (ICP-OES) (0.2 m CH3COOH + 0.25 m NH4NO3 + 0.015 m NH4F + 0.013 m HNO3 + 0.001 m EDTA).
Morgan's test was carried out using Morgan's extracting solution (Morgan, Reference Morgan1941). A 3 g subsample of each soil sample was added to a round bottom flask and Morgan's reagent was added in a 1:5 (soil:solution) ratio and placed on a gyratory shaker for 30 min at 180 rpm. The solution was poured into Whatman no. 2 filter paper and the filtrate was analysed by a Lachat continuous flow analyser for extractable P, K and Mg. Morgan's test gives an indication of plant and crop nutrient availability.
CEC and percentage base saturation were determined on initial soil samples, pre-treatment application. CEC was determined using the ammonium acetate method that is a measure of soil's ability to retain exchangeable cations, neutralizing the negative charge of soil (Gavlak et al., Reference Gavlak, Horneck, Miller and Kotuby-Amacher2003). Percentage base saturation is calculated based on the percentage of CEC occupied by base cations. Base cations are distinguished from acid cation at a soil pH of 5.4 or less (Mehlich, Reference Mehlich1984).
Physical analysis
Soil physical analysis was carried out to measure the effect of each lime product and its corresponding treatment rates on the physical characteristics of the soil. Soil penetration resistance (PR) was measured in megapascals (MPa) using a penetrologger (Eijkelkamp, Agrisearch Equiptment, Giesbeek, The Netherlands) (Arvidsson and Keller, Reference Arvidsson and Keller2011). Each plot was measured at four locations selected randomly. A cone penetration index was calculated from readings taken at 0, 5, 10 and 15 cm depth at each sampling time.
Soil shear strength (SS) was measured in kilopascals (kPa) using a standard shear vane (Eijkelkamp, Agrisearch Equipment) (Arvidsson and Keller, Reference Arvidsson and Keller2011). SS is the magnitude of shearing stress a soil can sustain. SS was measured at four locations selected within each plot and at three soil depths of 5, 10 and 15 cm at each sampling time.
Soil bulk density (BD) is the mass of soil per unit volume (g/cm3). The core sampling method was used to determine the quantity of pore space as well as soil solids in a given volume. A single soil core sample was taken at the centre of each plot at each sampling date using a 5 cm (depth) by 7.5 cm (diameter) soil corer. BD was analysed using standard methods (Tuohy et al., Reference Tuohy, Fenton, Holden and Humphreys2015).
Meteorological data
Meteorological data [air and soil temperature (10 cm) (°C), rainfall (mm), solar radiation (J/m2), wind speed and direction (m/s) and relative humidity (%)] were measured on each site by an automated weather station every 15 min.
Statistics
The data were analysed by multiple analysis of variance using mixed models, implemented using PROC MIXED and GLM procedures in the statistical analysis systems (SAS) version 9.3 (SAS inst. 2011). The dependant variables were analysed using a linear mixed model (PROC MIXED). The model for soil test results included the factors of site, sampling date, product and rate; and including interactions between factors. Site, sampling date, product and rate were included as fixed effects. The model for change in soil test included the factors of site, sampling date, product and rate. The interaction between factors was also included.
Soil pH, Mehlich III soil test, Morgan's soil test and soil physical tests were analysed and presented as the change in soil test, which is defined as the difference between the initial soil sampling test (T 0) and the final soil sampling test (T f): T f–T 0. Mean change in soil test is defined as a mean of the difference between the initial soil sampling test (T 0) and the soil sampling test at each individual sampling date (T 1–6):
Mean [(T 1 – T 0) + (T 2 – T 0) + (T 3 – T 0) + (T 4 – T 0) + (T 5 – T 0) + (T 6 – T 0)]
Results
Chemical analysis
Soil pH
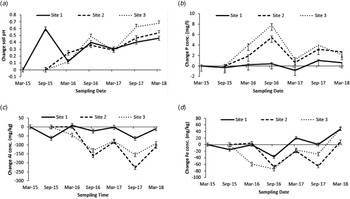
There was no difference between lime products in their ability to increase soil pH across individual sites. The high treatment rate gave the greatest response and was significantly more effective (P < 0.001) at increasing soil pH than the other rates on sites 1 and 2, and as a mean across all sites (Fig. 1). Site 1 was significantly different (P < 0.001) from the other two sites in initial soil pH, there was no significant difference between sites 2 and 3 (Table 2). Site 3 showed the greatest change in soil pH and was significantly different (P < 0.001) from the other two sites (Table 2). There was a significant effect (P < 0.001) of sampling dates across individual sites (Fig. 2(a)). The high treatment rate was significantly greater (P < 0.001) than the other treatment rates in the mean sampling time change in soil pH across each individual site.

Fig. 1. Mean change in soil test pH across lime products and treatment rates. (H, high; M, medium; L, low; C, control) – mean change in soil pH across all sites. abcValues not sharing a common superscript are significantly different from each other across all product and rate interactions.

Fig. 2. Change in (a) soil test pH; (b) soil test phosphorus; (c) soil test aluminium and (d) soil test iron concentration as a mean of treatment rates and products across sampling dates at each individual site. Site 1 was established in March 2015; sites 2 and 3 were established in September 2015.
Table 2. Change in soil test pH between ground and granulated lime across all sites and individual sites at each treatment rate

abcValues not sharing a common superscript across individual sites are significantly different from each other across all rates.
Phosphorus
Morgan's Test: There was a significant effect (P < 0.001) of lime products in increasing STP on site 1, change in STP between products on site 1 was 1.11 and 0.02 mg/l (±0.337) for ground and granulated lime, respectively. There was no effect of lime products on STP at sites 2 and 3. Treatment rates did not affect change in STP (Table 3). Each individual site had a similar initial STP (Table 3) with no significant difference between them. Site 1 showed the smallest change in STP and was significantly different (P < 0.001) from the other two sites (Table 3). There was a significant effect (P < 0.001) of sampling date across each individual site (Fig. 2(b)).
Table 3. Change in Morgan's soil test phosphorus concentration between ground and granulated lime across all sites and individual sites at each treatment rate

abcValues not sharing a common superscript across individual sites are significantly different from each other across all rates.
Mehlich III Test: There was a significant effect (P < 0.001) of lime products at site 1 on the change in STP. Change in STP on site 1 was −7 and −16 mg/kg (±2.8) for ground and granulated lime, respectively; there was no effect of products on sites 2 and 3. Treatment rates had no effect on change in STP across individual sites. Initial STP was 57 mg/kg (±1.3), 65 mg/kg (±2.1) and 64 mg/kg (±2.5) at sites 1, 2 and 3, respectively. Site 1 was significantly lower (P < 0.001) than the other two sites. Change in STP was −11, 2 and −6.3 mg/kg (±2.0) at sites 1, 2 and 3, respectively. Site 2 had a significantly greater change (P < 0.001) in STP; there was no significant difference between sites 1 and 3. There was a significant effect (P < 0.001) of sampling dates across each individual site and the change in Mehlich III STP followed the same trend as Morgan's P as shown in Fig. 2(b).
Potassium
Morgan's Test: There was no effect of product or treatment rate in changing Morgan's STK across individual sites or as a mean across all sites. Initial STK was 276, 220 and 142 mg/kg (±8.4) at sites 1, 2 and 3, respectively. All sites were significantly different (P < 0.001). Change in STK was 28, −16 and −21 mg/kg (±7.7) at sites 1, 2 and 3, respectively, being significantly greater at site 1. There was a significant effect (P < 0.001) of sampling date between sites 1 and 2 (P < 0.001) and site 3.
Mehlich III Test: The results indicate no significant interaction between lime products and treatment rates in the rate of change in STK concentration as a mean across all sites. Initial STK was 365, 271 and 169 mg/kg (±11.5) at sites 1, 2 and 3, respectively. All sites were significantly different (P < 0.001) in initial STK. Change in STK was 121, 57 and 21 mg/kg (±5.5) at sites 1, 2 and 3, respectively. Site 1 was significantly different (P < 0.001) from the other two sites. There was a significant effect (P < 0.001) of sampling time in the mean change in STK at each individual site.
Aluminium
There was no interaction between product and treatment rate on the change in soil test aluminium (STAl). The high treatment rate showed the greatest change in STAl and was significantly different (P < 0.001) from the other rates on site 1 and as a mean across all sites (Table 4). Initial STAl was significantly higher at site 2 (P < 0.001) than at the other two sites (Table 4). Site 1 showed the smallest change in STAl and was significantly different (P < 0.001) from the other two sites (Table 4). There was a significant effect (P < 0.001) of sampling date across each individual site (Fig. 2(c)).
Table 4. Change in soil Aluminium concentration (mg/kg) across all sites, individual sites and treatments rates

abcValues not sharing a common superscript are significantly different from each other.
Iron
Analysis showed no difference between lime products or treatment rates in changing soil test iron (STFe) across individual sites or as a mean across all sites. Initial STFe was 378 mg/kg (±4.5), 428 mg/kg (±6.4) and 423 mg/kg (±7.9) at sites 1, 2 and 3, respectively, being significantly lower (P < 0.001) at site 1. Change in STFe was −46, −7 and −49 mg/kg (±7.0) at the three sites, respectively, site 2 being significantly different (P < 0.001) from the other two sites. There was no significant interaction between lime products and treatment rates as a mean across all sites. There was a significant difference in STFe between sampling dates at individual sites (Fig. 2(d)).
Calcium
The high treatment rate showed the greatest (P < 0.001) change in soil test calcium (STCa) on sites 1 and 2 and as a mean across all sites. Change in STCa as a mean across all sites was 889, 450, 428 and 227 mg/kg (±62.2) across high, medium, low and control rates, respectively. There was no interaction between product and treatment rate as a change in STCa, across sites. Initial STCa were 2670 mg/kg (±66.5), 2036 mg/kg (±90.8) and 1622 mg/kg (±45.6) at sites 1, 2 and 3, respectively, and were significantly different from each other. Change in STCa was 368, 766 and 362 mg/kg (±58.5) at each individual site 1, 2 and 3, respectively. Change in STCa was significantly higher (P < 0.001) at site 2. There was a significant effect (P < 0.001) of sampling date across each individual site. At each individual site, change in STCa concentration at the first September sampling date post-treatment application was significantly higher (P < 0.001) than at the other sampling dates.
Magnesium
There was no significant interaction between product and treatment rate in the change in soil test magnesium (STMg). The high treatment rate showed the greatest reduction in STMg and was significantly different (P < 0.05) from the control as a mean across all sites. Initial STMg was 154, 207 and 134 mg/kg (±3.6), at sites 1, 2 and 3, respectively. Individual sites were significantly different (P < 0.001) from each other in initial STMg. Change in STMg was −8, −11 and −13 mg/kg (±3.6) at sites 1, 2 and 3, respectively There was no significant difference between sites in the change in STMg over the experimental period.
Manganese
There was no interaction between product and treatment rate in change in soil test manganese (STMn). Initial STMn was 20, 22 and 13 mg/kg (±0.8) at sites 1, 2 and 3, respectively, being significantly lower (P < 0.001) at site 3. There was a significant difference (P < 0.001) between sampling dates in the change in STMn over the experimental period. Change in STMn was −5, −10 and −5 mg/kg (±0.7) at sites 1, 2 and 3, respectively, site 2 was significantly different (P < 0.001) from the other two sites.
Physical analysis
Bulk density
Initial soil BD was 1.4, 1.3 and 1.5 g/cm3 (±0.03) at sites 1, 2 and 3, respectively, being significantly lower (P < 0.001) at site 2. There was no effect of lime products or treatment rates on the change in soil BD as a mean across all sites or within each individual site. Change in BD was 0.0, 0.1 and −0.1 g/cm3 (±0.03) at sites 1, 2 and 3, respectively. Change in BD was significantly different (P < 0.001) at site 3 compared to the other two sites. There was a significant effect (P < 0.001) of sampling date on the change in soil BD at site 3; there was no effect of sampling date on site 1 or 2.
Shear strength
Initial soil SS was 74, 114 and 111 kPa (±1.8) at sites 1, 2 and 3, respectively. Site 1 was significantly lower (P < 0.001) than the other two sites in initial soil SS. Initial soil SS at 15 cm was significantly higher (P < 0.001) than the other two depths as a mean across all sites. There was no effect of product or treatment rate in changing soil SS across sites. There was a significant difference between all sites in the change in soil SS; change in soil SS was 54, −1 and −20 kPa (±2.3) at sites 1, 2 and 3, respectively. There was a significant effect of depth on the change in soil SS at site 1. Change in soil SS at 5 cm was higher than the other two depths. Change in soil SS at site 1 was 74, 46 and 43 kPa (±3.9) at soil SS depth 5, 10 and 15 cm, respectively. There was a significant difference (P < 0.001) between sampling dates at each individual site.
Penetrometer
Initial soil penetrometer resistance (PR) was 80, 110 and 103 MPa (±2.2) at sites 1, 2 and 3, respectively. Initial soil PR was significantly lower (P < 0.001) at site 1. The change in soil PR across sites was 41, 13 and 4 MPa (±3.3) at sites 1, 2 and 3, respectively. Site 1 had a significantly higher (P < 0.001) change than the other two sites. There was no significant difference between treatment rates or lime products in changing soil PR across individual sites. Initial PR was 46, 90, 121 and 134 MPa (±2.5) at 0, 5, 10 and 15 cm, respectively, as a mean across all sites. Initial soil PR across different depths was significantly different (P < 0.001) as a mean across all sites. There was no significant change in soil PR between soil depths, indicating lime application had no impact on soil PR to 15 cm from the soil surface. There was a significant difference (P < 0.001) in the change in soil PR between sampling dates across individual sites. Soil PR increased on site 1 and persisted for the duration of the experiment with a variation between seasons; PR on sites 2 and 3 increased 1-year post-treatment application and continued to decline thereafter, below initial soil PR values. Differences in PR between sites seem to be largely dictated by climate and variations in soil texture proportions.
Discussion
Chemical analysis
Soil acidity
Rengel (Reference Rengel, Singh, Cowie and Chan2011) reported that clay soils have a larger buffering capacity than sandy soils and therefore require more lime to achieve a desirable pH. In a study carried out by Kamprath and Adams (Reference Kamprath and Adams2003), it was found that 2:1 clays had to be 80% base saturated to give the same pH change as soils with 1:1 clays at 40% base saturation, which was determined by the sum of cations. This is reflected in the current study in the change in soil pH over the experimental period between sites. Change in pH was greatest at site 3 which had the lowest clay content, followed by sites 2 and 1, which had the highest clay content. A study carried out in Iowa by Acosta-Martínez and Tabatabai (Reference Acosta-Martínez and Tabatabai2000) showed a 1.5-unit change in soil pH at a treatment rate of 6.7 tonnes/ha effective calcium carbonate equivalent on a fine loamy soil. This highlights the effect of CEC on soil pH. In the current study, the high lime application rate caused a smaller increase change in soil pH despite a larger lime application rate in comparison to the study carried out by Acosta-Martínez and Tabatabai (Reference Acosta-Martínez and Tabatabai2000).
The high rate of both lime products had a similar effect on soil pH over the experimental period. The medium and low rates of both products resulted in a similar change in soil pH, thus indicating that the lower rates of lime were more efficient at increasing soil pH per unit of product applied. The low rate of ground lime was 2.2 times more efficient at increasing soil pH, per tonne of lime applied, compared to the high rate. The low rate of granulated lime was 2.9 times more efficient at increasing soil pH, per tonne of lime applied, compared to the higher rate (change in soil pH divided by tonnes of product applied per hectare). On average across treatment rates within both lime products, granulated lime showed a 29% greater increase change in soil pH on average across the trial period. The average change in soil pH was 0.21 and 0.15 per tonne of product applied per hectare for granulated and ground lime products, respectively. The cost per tonne associated with each liming product is approximately 8:1, granulated:ground lime. Therefore, in order to increase soil pH by 1 pH unit, the cost ratio is 5.7:1 for granulated:ground lime; based on the ability of 1 tonne of each lime product to alter soil pH. Ground lime is more applicable to an agronomic situation as it is economically viable in comparison to granulated lime and has a long-term neutralizing effect due to its proportion of particle size.
September sampling dates showed a greater increase change in soil pH from initial soil pH values in comparison to March sampling dates in each individual year. This trend was evident across lime product and treatment rates and is largely caused by soil acidification from elevated rainfall over the winter period. As a mean across all sites, 58.6% of the increase in soil pH occurred in year 1, with an additional 12.0% increase change in year 2 and 29.4% increase change in year 3, accounting for the total change over the experimental period. Year 2 had a lower increase change in soil pH in comparison to year 3 due to the delayed breakdown of ground lime product which evidently comes into effect in year 3 post-treatment application.
Soil test phosphorus
The high buffering capacity of clay and OM soils makes nutrient retention and build-up slow and more difficult, especially P build-up. High concentrations of Al and Fe in soil bind to P, making it unavailable. FAOI and Teagasc (2016) found that the addition of 5 tonne/ha of ground lime across 16 acidic mineral soils increased P availability by 5.7 mg/l. All sites in the current study had a mean initial Morgan's STP of 4.3 mg/l (index 2). The desirable STP on mineral grassland soils is 5.1–8.0 mg/l (index 3) (Wall and Plunkett, Reference Wall and Plunkett2020). The results of the current study indicate that the application of lime increased P availability, 1 tonne/ha of each lime product increased P availability by 0.51 and 0.64 mg/l between ground lime and granulated lime, respectively. Lime products and treatment rates had no differing effect on P availability on sites 2 and 3. Site 1 showed the smallest change in STP over the experimental period, primarily due to the higher initial STP on site 1 as well as the high P buffering caused by a high clay and OM content in comparison to the other two sites. Much research suggests that the addition of lime increases phosphorus availability by stimulating mineralization of soil organic phosphorus (Haynes, Reference Haynes1982); Grover et al. (Reference Grover, Butterly, Wang and Tang2017) however showed that initially liming increased soil organic carbon mineralization but over time had little effect. Lime treatment rates had no effect on the rate of change in P availability over the experimental period across individual sites due to the threshold soil pH being achieved (≥5.7 pH) (Wall and Plunkett, Reference Wall and Plunkett2020). This change in STP is a result of increased mineralization at each individual site. In fact, there was a reduction in STP concentration at the high lime treatment rates (7.5 tonnes/ha) on site 3 due to the excessive STCa concentration and soil test pH. The high STCa concentration in the soil binds to P, making it unavailable on alkaline soils (Andersson et al., Reference Andersson, Tighe, Guppy, Milham and Mclaren2016). Lime products and treatment rates showed similar changes in P availability with no difference between them. The change in Morgan's STP concentration on sites 2 and 3 showed a similar trend over sampling dates with the greatest increase in STP concentration for the two sampling dates post-treatment application. The first September sampling date post-treatment application gave the greatest response in both STP tests, declining and maintaining thereafter for the remainder of the experimental period. As a mean across sites, STP concentration increased by 165% from the initial STP concentration in year 1; by 37% from the initial STP concentration in year 2; and by 48% from initial STP concentration in year 3. September sampling dates on any given year achieved a higher P availability concentration compared to the March sampling date at sites 2 and 3 for both STP tests.
Metallic cations
The availability and solubility of important nutrients to plants are closely linked to soil pH (Marschner, Reference Marschner2011). Shortages of extractable P, K, Ca and Mg; and excess Al, Fe, Mn and other metallic ions are effects of high acidity (Agegnehu and Sommer, Reference Agegnehu and Sommer2000). Clay type affects soil pH buffering capacity, 2:1 clays have a higher concentration of Al and Fe sesquioxides and have a greater capacity to absorb or provide protons, whereas 1:1 clays have little pH buffering capacity (Thomas and Hargrove, Reference Thomas and Hargrove1984). Phosphorus fertility poses a major problem on the farms in question due to their high buffering capacity. It is evident from the current study that different soil types are dominated by different metallic ions.
Daly et al. (Reference Daly, Styles, Lalor and Wall2015) showed that Al had a strong influence on soil's ability to make P plant available. Acid soils are defined as having toxicity by metals, such as Mn, Fe and Al and a deficiency in nutrients (Bose et al., Reference Bose, Babourina, Ma, Zhou, Shabala, Rengel, Kumar Panda and Baluska2015). A soil's ability to absorb and store P is dictated by the presence of ions such as Al and Fe, which have an affinity for P (Daly et al., Reference Daly, Jeffrey and Tunney2001). When P sorption capacity is large, P reserves will build in the soil. In an experiment carried out by Maguire et al. (Reference Maguire, Foy, Bailey and Sims2002), it was observed that P sorption was strongly correlated with Al and Fe, and weakly but positively correlated with OM. On average, across 16 acidic mineral soils, the addition of 5 tonnes/ha of ground lime reduced Al concentration by 175 mg/kg over a 12-month period (FAOI and Teagasc, 2016).
The current study found that 1 tonne/ha of each lime product reduced Al concentration by 18 and 24 mg/l between ground and granulated lime, respectively. The application of lime did not significantly change STAl concentration across treatment rates on site 1. Site 1 began at a high initial soil pH which means a large proportion of Al, which causes soil acidity, had already been buffered. High clay content soils pose a high pH buffering capacity which poses a resistance to change in soil pH. There was a 1.3% reduction in Al concentration over the experimental period on site 1, compared to an 11% reduction on sites 2 and 3.
The application of lime showed an increase in soil Fe concentration over the trial period. There was no difference between lime products or treatment rates in changing STFe concentration. The low initial soil pH and large mean change in STAl and STFe across sampling dates at sites 2 and 3 suggest that lime was required to reduce acidity and evidently increase soil pH and P availability. Analysis showed a slight increase (0.7%) in the mean change in STFe concentration on site 1 over the trial period compared to a 6% reduction on the other two sites.
Each individual site reached peak reduction in STAl concentration on the September sampling date, 2 years post-treatment application. Individual sites reached peak reduction in STFe on the September sampling date, 1-year post-treatment application. Soil Fe concentration increased thereafter, above initial STFe concentration at the final experimental sampling date. It is evident that September sampling dates experience the greatest reduction in STAl and STFe in any given year across all sites. STFe returned to a higher concentration than the initial STFe across all sites, indicating the threat STFe poses to soil acidity on these soils.
Base cations
On the surface of clay mineral and organic soils, there are negatively charged sites that absorb and hold positively charged cations through electrostatic force, which is critical for the supply of nutrients to plants as many nutrients exist as cations. Soils with large areas of negative charge have a high CEC and based on base saturation percentage and soil pH, they have a large capacity to retain cations (Rawal et al., Reference Rawal, Chakraborty, Li, Lewis, Godoy, Paulette and Weindorf2019). Mg, Ca, K and Na are the main exchangeable ions associated with CEC and are referred to as base cations (Rayment and Higginson, Reference Rayment and Higginson1992). As soils become more acidic (<6.3), they become replaced by hydrogen (H), Al, Fe and Mn (McKenzie et al., Reference McKenzie, Jacquier, Isbell and Brown2004). It is evident from the current experiment that there was a different response between sites in their ability to replace metallic ions with base cations.
Site 2 showed the greatest increase change in STCa over the experimental period and was significantly different to the other two sites. Increase in soil Ca concentration was 13.8, 37.6 and 22.3% over the experimental period at sites 1, 2 and 3, respectively. The high treatment rate on sites 1 and 2 yielded a significantly greater increase in STCa concentration than the other treatment rates.
All sites were above index 4 for STMg at the initial sampling date. There was little change in STMg over sampling dates and there was no influence of product or treatment rate on STMg concentration. The reduction in STMg was due to the substitution of Mg ions for Ca ions and the leaching of Mg ions. At sites 1 and 3, the high rate of lime gave a greater reduction in STMg and was significantly different from the other rates. STK was not affected by lime products or treatment rates. All sites started at index 4 for STK. There was a minimal reduction in STK at sites 2 and 3, and an increase at site 1.
Physical analysis
Minimal literature is available on the effects and impact of lime on soil physical structure. Research carried out in the UK showed that the addition of lime to both grassland and arable land had an impact on community composition and abundance of all types of soil micro-organisms (Holland et al., Reference Holland, Bennett, Newton, White, Mckenzie, George, Pakeman, Bailey, Fornara and Hayes2018), which are essential for soil function (Lees et al., Reference Lees, Mckenzie, Newell Price, Critchley, Rhymer, Chambers and Whittingham2016). Moore (Reference Moore2001) stated that a soil with a clay content of 10–35% has a BD of between 0.9 and 1.5 g/cm3. Gao et al. (Reference Gao, Qian, Li, Chen and Jia2018) studied the effects of lime on hydraulic conductivity and microstructure of silt and found that a lime treatment rate of 9% in mass percentage increased a soil's pore size and hydraulic conductivity. It has been shown by Quirk and Schofield (Reference Quirk and Schofield1955) that increasing ionic strength in a soil will improve hydraulic conductivity and drainage. Calcium and magnesium cations have the ability to improve soil structure through cationic bridging with soil organic carbon and clay particles. In a study carried out by Zhang and Norton (Reference Zhang and Norton2002), it was shown that Ca was more effective in improving soil structure, Mg caused greater soil dispersion and reduced ability of soils to flocculate. In the current study, it is evident that the Ca to Mg ratio was relatively high across sites at initial values (Table 1). This high initial Ca to Mg ratio is largely due to the high proportion of SOM and clay content, which dictates soil aggregation (Dalal and Bridge, Reference Dalal, Bridge, Carter and Stewart1996). It is evident from the current study that site 3, which had the lowest Ca to Mg ratio, reduced in soil BD and SS, and experienced the smallest increase change in PR over the experimental period of all three sites; therefore, suggesting that the addition of calcium carbonate had an effect on improving soil structure. Site 1 experienced a high initial Ca to Mg ratio and an increase in soil SS and PR over the experimental period in comparison to the other two sites, suggesting site 1 experienced dispersion of aggregates following the addition of calcium carbonate.
The current study found no effect of lime products or treatment rates in altering soil BD, SS or PR. Although there were notable differences between sites in their response to lime application, differences in soil physical structure measurements were evident across sampling dates, suggesting season, climate, soil texture and initial soil physical measurements had a much greater influence on the physical structure than the application of lime.
Conclusion
The current study allows us to draw specific conclusions about the impact of contrasting lime products (CaCO3) and treatment rates across differing soil types. Similar rates of each lime product (ground:granulated lime) were required to achieve equivalent changes in soil acidity at all three sites. There was a difference between sites in the ability of lime to alter soil acidity and nutrient availability. September sampling dates experienced the greatest increase in soil pH and STP and reduction in STAl and STFe in comparison to March sampling dates at each site. Soil pH and STP showed the largest response to lime application 1-year post-treatment application. There was no negative impact of lime application on soil physical structure; in fact, lime application evidently reduced soil compaction, as indicated by the reduction of soil BD and SS on site 3 which had elevated initial values. Ground lime showed the greatest economic value (1:5.7, ground:granulated lime) in terms of counteracting soil acidity.
Additional long-term research would be required to examine the longevity of these lime products and treatment rates regarding soil acidity and nutrient availability. It is evident from the current study that as soil acidity is counteracted, there is an increase in nutrient availability, particularly P availability. Further research is required to assess the rate of chemical P fertilizer required to increase soil phosphorus concentration on these high P buffering soils.
Acknowledgements
The authors wish to thank the farmers of the HSP, in particular S. O'Riordan, Kishkeam, Co. Cork; J. Leahy, Athea, Co. Limerick and J. O'Sullivan, Castleisland, Co. Kerry for the time, effort and resources they contributed to this study and also J. O'Loughlin for his invaluable assistance and expertise in relation to the experimental design and data collection process.
Financial support
The authors wish to acknowledge the financial support of the Dairy Research Levy, the Teagasc Walsh Scholarship Programme and Kerry Agribusiness.
Conflict of interest
None.
Ethical standards
Not applicable.


 Open access