In the Sahelian region of West Africa, it is anecdotally known that people who consume foods made from pearl millet (Pennisetum glaucum) feel especially ‘full’, allowing them to go for a long period of time without feeling the need to eat. Thus, these millet foods appear to affect ingestive behaviour by prolonging satiety. We previously conducted a human trial in Mali, West Africa, to assess the gastric emptying rate of traditional Sahelian West African foods (couscous and thick porridges made from millet and sorghum) compared with non-traditional carbohydrate foods (white rice, boiled potatoes, pasta) to determine if gastric emptying might be a physiological basis for this apparent satiety property(Reference Cisse, Erickson and Hayes1). Traditional viscous and non-viscous millet and sorghum foods (millet and sorghum thick porridges, and millet couscous (precooked agglomerated flour particles)) had markedly longer gastric half-emptying times compared with the Western foods (about 5 v. about 3 h, respectively). Viscosity might be one explanation for the slow gastric emptying times of the thick porridges, as high viscosity pudding in one study(Reference Zhu, Hsu and Hollis2) and a high viscosity locust bean gum paste in another(Reference Marciani, Gowland and Spiller3) were shown to slow gastric emptying rate. For millet couscous, we further investigated the reason behind its slow gastric emptying rate using the Human Gastric Simulator, a dynamic model of human gastric digestion(Reference Hayes, Swackhamer and Mennah-Govela4). Breakdown and digestion properties of millet and wheat couscous were determined in relation to their physicochemical characteristics. Contrary to our thinking that millet couscous particles would be resistant to stomach breakdown and, in turn, slow gastric emptying, they instead broke down into smaller and more numerous particles than wheat couscous and produced a paste-like consistency, perhaps even generating viscosity in the stomach that could delay gastric emptying rate(Reference Hayes, Swackhamer and Mennah-Govela4). Moreover, the remaining smaller millet couscous particles were found to exhibit lower starch digestibility per unit surface area than wheat couscous particles, supporting that millet has a slow digestion property and may digest locationally into the distal small intestine to trigger the ileal brake(Reference Poppitt, Shin and McGill5,Reference Jain, Boivin and Zinsmeister6) . Related to this, we have found that slowly digestible carbohydrates activated the gut–brain axis and reduced food intake in rats(Reference Hasek, Phillips and Zhang7). Either one or both of these special properties of millet foods could explain the slower gastric emptying rates observed in the Mali trial.
Here, we examined the potential satiety and glycaemic aspects of pearl millet in a US population by testing primary outcomes of glycaemic response and gastric emptying rate, and secondary outcomes of appetitive response and breath hydrogen following consumption of millet couscous v. wheat couscous matched for particle size, along with millet thick porridge and white rice. We gained insight on the role of real-time viscosity of millet couscous in the stomach using the TIM-1 gastrointestinal digestion system equipped with the advanced gastric compartment (TIMagc). Our hypothesis tested, in a US population, was whether millet couscous and/or millet thick porridge modulates postprandial glycaemia and produces a satiety response, as well as slows gastric emptying rate.
Methods
Participants and study design
Participants were recruited from the Purdue University area (West Lafayette, IN, USA). Inclusion criteria were as follows: between 18 and 50 years in age, normal weight (18·5 kg/m2 ≤ BMI ≤ 25·0 kg/m²) and normal fasting blood glucose (<100 mg/dl). Participants were excluded if they had any of the following: diabetes (any type); allergy to millet, wheat and/or gluten allergy or sensitivity; history of or currently experiencing gastrointestinal diseases/disorders; or if pregnant or nursing. Interested potential participants underwent pre-screening. Those that fit the inclusion criteria and agreed to participate gave written informed consent to be enrolled in the study. Participant recruitment and study participation proceeded as shown in Fig. 1.
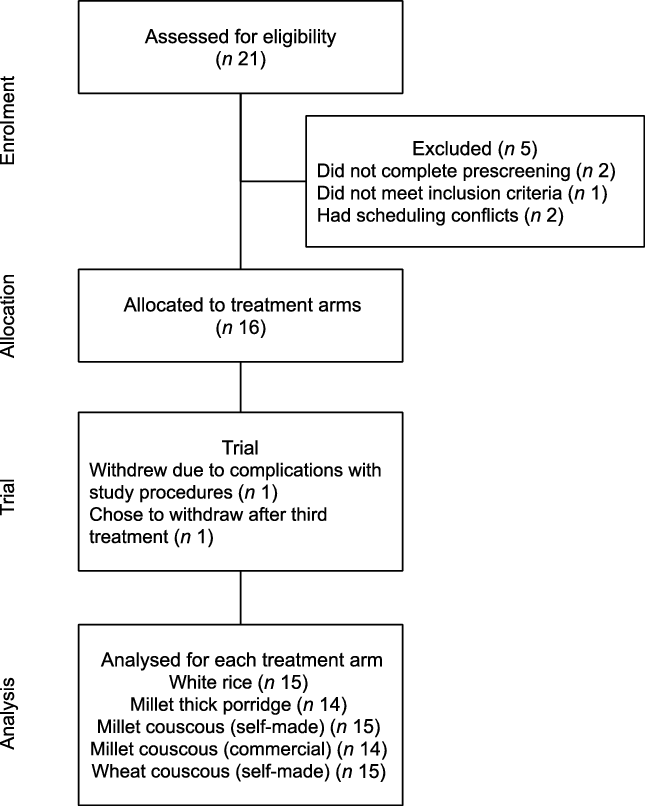
Fig. 1. Participant recruitment and participation flow diagram.
Following recruitment, enrolled participants participated in a crossover trial with five treatment arms, with one arm taking place per week to allow for a 5–7 d washout period. The order of the treatment arms was randomised to form one sequence, and all participants received the same sequence (millet couscous (self-made), white rice, wheat couscous, millet couscous (commercial), millet thick porridge). Each arm consisted of two consecutive days. On day 1, the continuous glucose monitors (CGM) were equilibrated and, on day 2, one test meal food was consumed as the morning meal with glycaemic response, appetitive sensations, gastric emptying and breath hydrogen measured over 4 h postprandially. The five test meal foods (one per arm) were millet couscous that had been self-made at Purdue University, a commercially available millet couscous from Senegal, wheat couscous that had been self-made at Purdue University, millet thick porridge and white rice. Couscous were self-made to match for particle size. While participants’ familiarity with the test meal foods was not formally assessed, it can be reasonably assumed that all were more familiar with rice and wheat couscous and less familiar with millet thick porridge and millet couscous. Approximately 5–7 d washout periods were implemented between arms, and the order in which arms were assigned was determined using a random number generator (Microsoft Excel, version 1808). Neither participants nor experimenters were blinded due to the difficulty in masking the nature of the foods. The present study was conducted according to the guidelines laid down in the Declaration of Helsinki and procedures involving human participants were approved by the Institutional Review Board at Purdue University under protocol no. 1706019348. Written informed consent was obtained from all participants. The study was registered at ClinicalTrials.gov with identifier NCT03630458.
Pre-preparation of test meal foods
Descriptions of the test meal foods are provided in Table 1. Whole millet grain (Pennisetum glaucum) as intact kernels and commercially available refined millet couscous were obtained from Senegal (grain from Alif Group; couscous from Mme. Deme of Free Work Services). Refined wheat flour (Bob’s Red Mill) and medium grain white rice (Nishiki Brand Rice; JFC International Inc.) were obtained commercially. The self-made millet and wheat couscous foods were processed and prepared as in Hayes et al. (Reference Hayes, Swackhamer and Mennah-Govela4), with minor modifications.
Table 1. Test meal foods
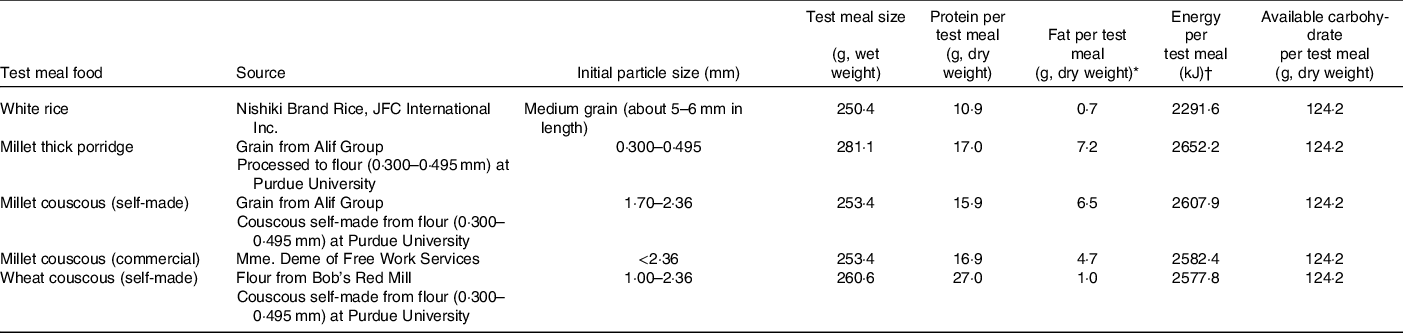
* Including 0·5 g butter.
† Including kJ from 0·5 g butter.
Briefly, for self-made millet couscous, millet grain was decorticated (15 % mass removal by wet weight, indicating removal of bran) using an abrasive decorticator. The resulting kernels were milled into flour using a pin mill (6·5 rpm, Alpine). Millet flour particles between 0·3 and 0·5 mm were collected using a sieve shaker (Model RX-24, W.S. Tyler Inc.). Self-made millet couscous was prepared from the resulting flour as in Hayes et al. (Reference Hayes, Swackhamer and Mennah-Govela4), with the exception that couscous particles were made in the size range of 1·0 and 2·4 mm. Couscous was prepared via rolling and steaming, dried at 50°C for 4 h, vacuum sealed and stored at −20°C until test day preparation.
Millet thick porridge was made from millet flour particles between 0·3 and 0·5 mm obtained from the same processing and collection techniques described above for self-made millet couscous. This resulting flour was reserved, vacuum sealed and stored at −20°C until test day preparation.
For self-made wheat couscous, flour particles (obtained commercially) between 0·3 and 0·5 mm were collected via sieve shaker separation, and couscous (1·0 and 2·4 mm) was prepared as described above for self-made millet couscous. Commercial millet couscous and white rice were acquired and stored until test day preparation. Available carbohydrate for each test meal food was based on total starch determination using an assay kit (Total Starch Assay Kit (AA/AMG), K-TSTA-50 A; Megazyme).
Test day preparation of test meal foods
On the morning of the second test day of each arm, the final preparation steps were carried out for each test meal food. For all couscous samples, pre-hydration (0·9 g dry weight couscous : 1 ml water) was achieved by gradual incorporation of water with mixing. Couscous samples were then steamed in a couscoussier for 14 min over boiling water (100°C) from a gas stove and weighed into individual portions.
Millet thick porridge was prepared from millet flour according to a traditional method(Reference Cisse, Erickson and Hayes1,Reference Scheuring, Sidibe and Kante8) . Specifically, one portion of flour (690 g dry weight) was added to water (933 ml) and mixed to make a homogeneous slurry. The slurry was then gradually added to boiling water (2555 ml; 100°C) on a gas stove and heated for 8 min with continuous stirring at reduced heat to make a thin porridge, traditionally referred to as ‘bouillie’. A portion (about 500 g wet weight) of the resulting thin porridge was removed and reserved. Another portion of flour was gradually added to the remaining thin porridge with continuous stirring until completely incorporated, yielding thick porridge that was paste-like. Intermittent additions of the reserved thin porridge were also made as the dry flour was being added until it was all re-incorporated, in order to ensure the resulting porridge did not become too dry to mix. The final porridge was covered, cooked for 30 min and then weighed into individual portions.
For the rice preparation, white rice (1116 g dry weight) and water (1674 ml) were placed in a pressure cooker (NESCO PC8–25; Two Rivers) and cooked for 10 min. Cooked rice was weighed into individual portions.
All test meals were served at 55–65°C. Total moisture content was held constant across all test meals by adjusting the amount of water served (130–150 ml) according to estimates of final moisture contents of cooked test meals (about 290 ml total water content). Test meal sizes were based on 124 g dry weight available carbohydrate to approximately match the carbohydrate amount in the Mali study(Reference Cisse, Erickson and Hayes1). A small amount (0·5 g) of butter was added to each test meal before serving to increase palatability. The nutrient and energetic contents of the test meals are shown in Table 1. 13C-octanoic acid (100 mg) was mixed into each test meal immediately prior to serving as a tracer for gastric emptying assessment.
Test day procedures
Participants arrived at the testing facilities at 08.00–08.30 hours on both consecutive test days per arm. On the first test day, a CGM sensor (G4 Platinum; Dexcom) was first inserted on the lower left abdomen of each participant. The CGM transmitter (G4 Platinum; Dexcom) was then installed and the CGM receiver (G4 Platinum; Dexcom) was turned on for an initial equilibration period during which participants were free to leave the testing facilities. Approximately 2 h later (10.00 hours), participants returned and two blood finger pricks (Microlet lancing device, Contour glucometer and Contour blood glucose test strips; Ascensia Diabetes Care; ReliOn Lancets) were taken to calibrate the CGM. Participants were then free to leave the testing facilities for the remainder of the day. No test meal foods were provided on the first test day. Participants were instructed to consume similar foods that were low in fibre the evening of the first test day for each of the study arms as well as to maintain a consistent exercise level for the duration of the study.
On the second test day, participants arrived at the testing facilities after an overnight fast (>10 h). One finger prick blood sample was collected from each participant for CGM calibration. Thereafter, baseline breath samples for gastric emptying (two – 1·5 litre bags, Cambridge Isotope Laboratories) and breath hydrogen (one – 0·25 litre bag, QuinTron Instrument Company, Inc.) were collected for each participant and each completed a baseline appetitive sensation survey (visual analogue scale, described below). Following completion of all initial steps, participants were provided one test meal and water, prepared as described above, according to the assigned arm of the study. Participants were instructed to consume the test meal in entirety within 20 min. No other food or drink was allowed for the remainder of the test session. Following test meal consumption, participants completed the following: (1) breathed into 0·30 litre bags (Cambridge Isotope Laboratories) every 15 min in the initial 2 h postprandial period and every 30 min in the 2–4 h postprandial period for assessment of gastric emptying, (2) breathed into 0·25 litre bags (QuinTron Instrument Company, Inc.) every 15 min in the initial 2 h postprandial period and every 30 min in the 2–4 h postprandial period for assessment of breath hydrogen and (3) completed appetitive sensation surveys (visual analogue scale) every 30 min for the entire 4 h postprandial period. Glucose level was measured every 5 min by the CGM. Following completion of all breath collections and assessments during the 4 h postprandial period, CGM were removed and participants were free to leave the testing facilities.
Glycaemic response
Postprandial interstitial glycaemia was measured as a primary outcome by CGM (G4 Platinum, Dexcom) to represent glycaemic response(Reference Li, George and Hunter9,Reference Hall, Ayuketah and Brychta10) . Glucose values during the 4 h postprandial period were corrected by subtracting each participant’s baseline glucose value on test day 2 (for each study arm) from the following values to obtain change in glucose (ΔGlucose) and then also expressed as glucose incremental AUC (iAUC, mg×min/dl, including values below baseline). Glycaemic response characteristics of peak glucose values (mg/dl; ΔPeak glucose value) and time of peak glucose value (min) were also calculated.
Appetitive sensations
Visual analogue scales were used to assess participants’ subjective feelings of hunger and fullness (in mm, secondary outcome) at baseline and every 30 min in the 4 h postprandial period using an online questionnaire (Qualtrics, Provo). Participants were sent an email link to the questionnaire at each timepoint, which they promptly completed on the same interface (i.e. personal laptop or cell phone) for all arms of the study.
Gastric emptying
The 13C-octanoic acid breath test was used to assess gastric emptying rate as has been previously done in our group(Reference Cisse, Erickson and Hayes1,Reference Pletsch and Hamaker11) according to the method from previous researchers(Reference Sanaka, Yamamoto and Anjiki12–Reference Sanaka and Nakada16), with adjustment for body surface area calculations from Haycock et al. (Reference Haycock, Schwartz and Wisotsky17). Breath samples collected for gastric emptying assessment were analysed within 48 h of collection using a 13CO2 breath analyser (POCone; Otsuka Electronics Co., Ltd.). Gastric half-emptying time, the time required for half of the 13C dose to be metabolised(Reference Perri, Pastore and Annese18), was calculated as a primary outcome.
Because millet is a C4 plant, it has a higher 13C to 12C ratio and possesses more endogenous 13C than C3 plants (e.g. wheat and rice)(Reference Sage and Monson19). Additional testing proceeded with a subgroup of participants (n 4) to determine a corrective factor for 13C inherent to millet in a similar manner as in Cisse et al. (Reference Cisse, Erickson and Hayes1). On three separate test days, participants came to the testing facilities after an overnight fast (>10 h) and consumed one of three test meals (self-made millet couscous, self-made wheat couscous, white rice) that did not contain tracer. Breath samples for gastric emptying were collected in the same manner as above. The resulting values obtained from the breath samples for gastric emptying represented endogenous 13C in the foods at each timepoint. These values were averaged for the subgroup and subtracted from the corresponding timepoint values for each participant for test meals of the same grain source during the study (online Supplementary Table 1). Thereafter, the corrected values representing 13C at each timepoint were used for modelling percentage dose recovery and cumulative percentage dose recovery of the tracer, which were then used to calculate gastric half-emptying time (online Supplementary Fig. 1, example of modelling).
Data for modelling the percentage dose recovery and cumulative percentage dose recovery of 13C (corrected for endogenous 13C) are shown in online Supplementary Table 2. An R 2 of 0·80 for the model fit for percentage dose recovery of the 13C octanoic acid tracer was considered acceptable for data to be included. Lag phase and gastric emptying coefficient values were also calculated for the test meals (online Supplementary Table 3).
Analysis of relationship between gastric emptying and glycaemic response
The relationships between gastric half-emptying time and three different glycaemic response characteristics (glucose iAUC0–120 min, ΔPeak glucose value and time of peak glucose value) were analysed using one-way ANOVA with repeated measures per participant (PROC MIXED, SAS version 9.4; SAS Institute).
Breath hydrogen
Breath samples collected at baseline and in the 4 h postprandial period on test day 2 were analysed for breath hydrogen within 24 h as in Pletsch & Hamaker(Reference Pletsch and Hamaker11). A BreathTracker Digital Microlyzer (Quintron Instrument Company) was used to determine the hydrogen content (parts per million), a secondary outcome, in each breath sample.
In vitro gastric compartment pressure profiles
To complement the trial in humans, in vitro experiments were performed using a multi-compartmental, computer-controlled gastrointestinal digestion system, TIM-1(Reference Minekus, Marteau and Havenaar20), equipped with the advanced gastric compartment (TIMagc)(Reference Bellmann, Lelieveld and Gorissen21). Pressure profiles over time, related to real-time viscosity within the gastric compartment, were measured for millet couscous (self-made), millet thick porridge, wheat couscous and white rice. Experiments for test meals (44 g dry weight available carbohydrate, based on a three-times down-scale) were conducted in duplicate for 6 h. Test meals were prepared immediately prior to experimentation in a similar manner as above. Experimental procedures followed those used by Bellmann et al. (Reference Bellmann, Krishnan and de Graaf22).
Statistical analysis
A power calculation to determine sample size was conducted based on iAUC for glycaemic response, because the calculated sample size was larger than for the gastric half-emptying time. The minimum detectable difference was set at 600 mg/dl with 414 mg/dl sd as observed by Wolever et al. (Reference Wolever, van Klinken and Bordenave23). For five treatment arms and power of 0·8, it was determined that a minimum of 13 participants was required (n 13).
Statistical analyses were conducted using SAS version 9.4 (SAS Institute). Two-way ANOVA (PROC MIXED) with test meal as a fixed effect and participant as a random effect was used to determine statistical significance of differences in glycaemic response characteristics and gastric emptying parameters (iAUC0–120 min, iAUC0–240 min, ΔPeak glucose value, time of peak glucose value, gastric half-emptying time, gastric lag phase, gastric emptying coefficient). Two-way ANOVA with repeated measures (PROC MIXED) with meal and time as fixed effects was conducted for glycaemic response (ΔGlucose), appetitive sensations (hunger and fullness) and breath hydrogen. For all repeated measures analyses (ΔGlucose, hunger, fullness, breath hydrogen), baseline values were included as a covariate in the model according to Blundell et al. (Reference Blundell, de Graaf and Hulshof24). Residuals of all models were plotted and visually assessed for homoscedasticity and normality using histograms and quantile–quantile plots. Breath hydrogen was not normally distributed and was transformed using Box–Cox (λ = −0·04). All other data did not require transformation. Significance was considered at P < 0·05, and Tukey’s post hoc test for multiple comparisons was conducted when the overall model was significant (P < 0·05 for F value).
Results
Participant characteristics
Sixteen healthy participants were originally enrolled in the trial, and one participant withdrew after initial assignment to treatment arms, leaving fifteen participants. Baseline participant characteristics (n 15) are shown in Table 2. One enrolled male participant no longer wished to participate in the study after the third treatment and thus was withdrawn; this participant’s data from the three completed treatment arms were included in the analyses. In the end, fourteen participants (seven males, seven females) completed the full trial (Fig. 1).
Table 2. Participant baseline characteristics (n 15)*
(Mean values with their standard errors)
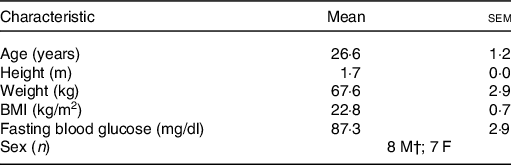
M, male; F, female.
* One participant withdrew after completion of the third treatment arm, but this participant’s characteristics have still been included.
† One male participant withdrew after completion of the third treatment arm, leaving a final of seven males completing the entire trial.
Glycaemic response
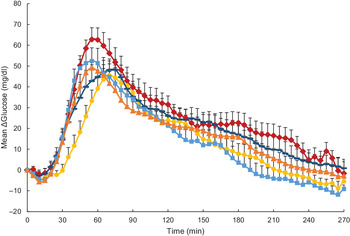
Glycaemic response was expressed as mean changes in glucose from baseline over different timepoints in 5 min increments as assessed by CGM (ΔGlucose; Fig. 2). Statistical analysis revealed ΔGlucose was significantly influenced by both time and test meal (P < 0·001) but not their interaction (P = 0·90). Overall, for the main effect of test meal, all millet foods as well as wheat couscous had significantly lower glycaemic response than white rice (P < 0·0001 for millet couscous (commercial), millet thick porridge, wheat couscous v. white rice; P = 0·05 for millet couscous (self-made) v. white rice). Millet thick porridge was also significantly lower than both types of millet couscous (commercial and self-made; P = 0·01 and < 0·0001, respectively) and wheat couscous (P < 0·0001). The significantly higher glycaemic response of millet couscous (self-made) compared with millet couscous (commercial) and wheat couscous (P < 0·0001) may be explained by its visually blunted and extended ΔGlucose profile (Fig. 2), although a treatment-by-time interaction was not observed.
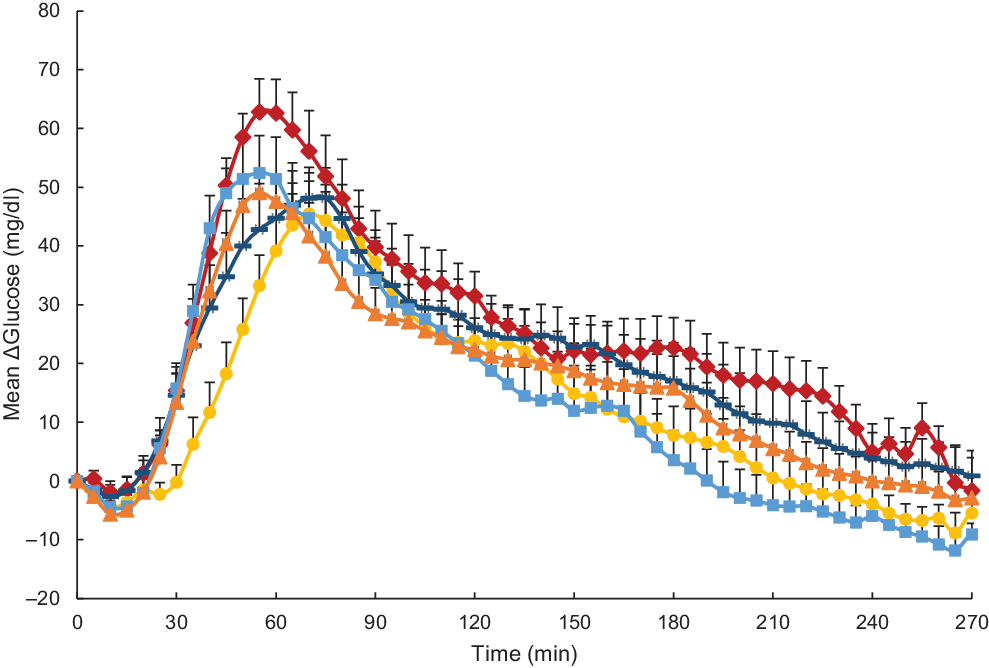
Fig. 2. Mean glucose expressed as mean ΔGlucose (glucose difference from baseline) for carbohydrate-based test meals. Error bars represent standard errors. Means with unlike letters are significantly different (P < 0·05) in main effects: All millet foods and wheat couscous had significantly lower glycaemic response than white rice (P < 0·0001 for millet couscous (commercial), millet thick porridge, wheat couscous v. white rice; P = 0·05 for millet couscous (self-made) v. white rice). Millet thick porridge had significantly lower glycaemic response than both types of millet couscous (commercial and self-made; P = 0·01 and < 0·0001, respectively) and wheat couscous (P < 0·0001). Millet couscous (self-made) also had significantly higher glycaemic response than millet couscous (commercial) and wheat couscous (P < 0·0001). A significant effect for time was also evident (P < 0·0001). ![]() , White ricea;
, White ricea; ![]() , millet thick porridged;
, millet thick porridged; ![]() , millet couscous (self-made)b;
, millet couscous (self-made)b; ![]() , millet couscous (commercial)c;
, millet couscous (commercial)c; ![]() , wheat couscous (self-made)c.
, wheat couscous (self-made)c.
Glycaemic response characteristics are shown in Table 3. For iAUC in the 0–240 min postprandial period (iAUC0–240 min), millet thick porridge was significantly lower than white rice (4755·7 v. 6943·7 mg × min/dl; P = 0·03). iAUC between 0 and 120 min in the postprandial period (iAUC0–120 min) was also analysed, and significant differences were observed between test meal foods (P = 0·03). Again, millet thick porridge had significantly lower iAUC0–120 min than white rice (2296·3 v. 4353·0 mg × min/dl; P = 0·02). Change in peak glucose values (ΔPeak glucose) and mean peak times were also calculated for each test meal food (Table 3). For mean ΔPeak glucose value, significant differences emerged between test meal foods (P = 0·03), with millet thick porridge exhibiting a significantly lower ΔPeak glucose value than white rice (52·8 v. 69·9 mg/dl; P = 0·02). For mean peak times, no statistically significant differences were observed between different test meal foods (P = 0·24).
Table 3. Glycaemic response characteristics
(Mean values with their standard errors)
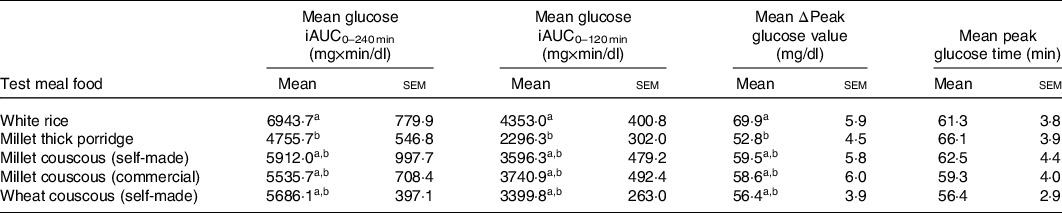
iAUC, incremental AUC; ΔPeak glucose value, change in peak glucose value from baseline.
a,bMean values in a column with unlike superscript letters are significantly different (P < 0·05).
Appetitive sensations
Appetitive sensations were expressed as visual analogue scale ratings (Figs. 3 and 4). Hunger was significantly influenced by both time and test meal food (P < 0·0001; Fig. 3), but not their interaction (P = 0·91). Additionally, there were statistically significant differences between mean values of hunger in the postprandial period for different test meals (main effects). Notably, millet couscous (self-made) had significantly lower overall hunger ratings than white rice (P < 0·0001), wheat couscous (P = 0·02), millet thick porridge (P = 0·008) and millet couscous (commercial) (P = 0·002). Fullness was significantly influenced by both time and test meal foods (P < 0·0001; Fig. 4), but not their interaction (P = 0·90). Statistically significant differences between mean values of fullness for different test meal foods in the postprandial period were observed. Specifically, millet couscous (self-made) had significantly higher overall fullness ratings than white rice (P < 0·0001), millet thick porridge (P = 0·0004) and millet couscous (commercial) (P < 0·0001).
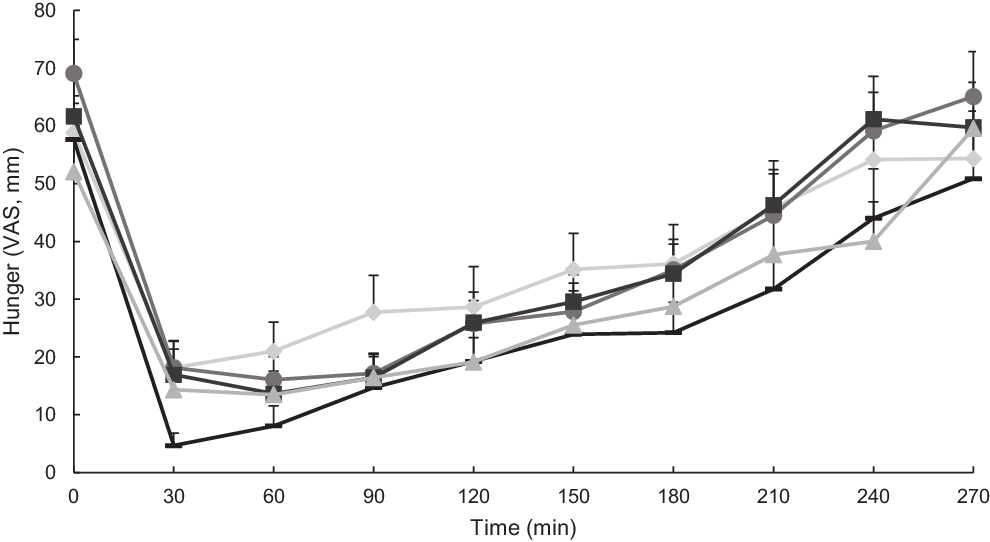
Fig. 3. Mean hunger ratings (visual analogue scale; VAS) immediately prior to and 4 h following consumption of carbohydrate-based test meal foods. Error bars represent standard errors. Means with unlike letters are significantly different (P < 0·05) in main effects: Millet couscous (self-made) was significantly lower than white rice (P < 0·0001), wheat couscous (P = 0·02), millet thick porridge (P = 0·008) and millet couscous (commercial) (P = 0·002). A significant effect for time was also evident (P < 0·0001). ![]() , White riceb;
, White riceb; ![]() , millet thick porridgeb;
, millet thick porridgeb; ![]() , millet couscous (self-made)a;
, millet couscous (self-made)a; ![]() , millet couscous (commercial)b;
, millet couscous (commercial)b; ![]() , wheat couscous (self-made)b.
, wheat couscous (self-made)b.
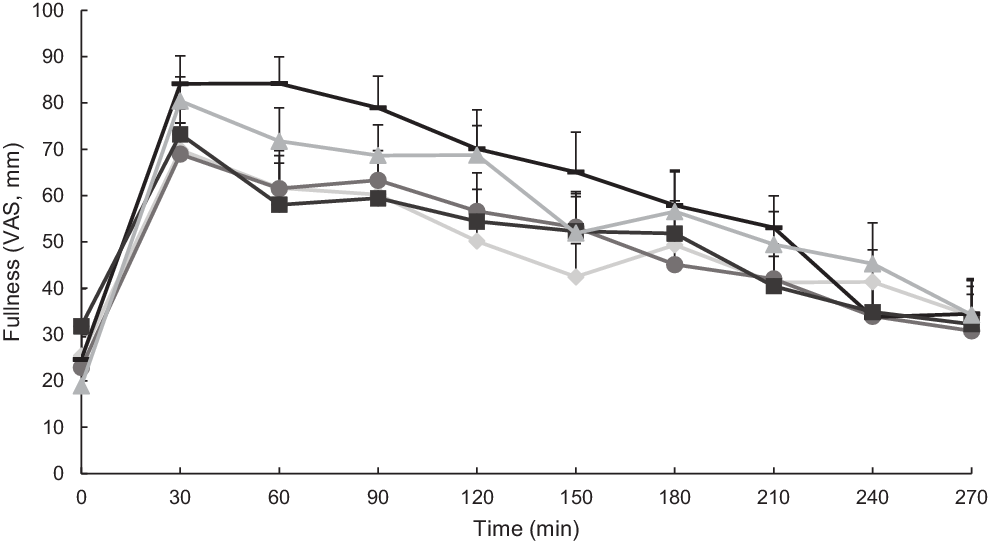
Fig. 4. Mean fullness ratings (visual analogue scale; VAS) immediately prior to and 4 h following consumption of carbohydrate-based test meal foods. Error bars represent standard errors. Means with unlike letters are significantly different (P < 0·05) in main effects: Millet couscous (self-made) was significantly higher than white rice (P < 0·0001), millet couscous (commercial) (P < 0·0001) and millet thick porridge (P = 0·0004). A significant effect for time was also evident (P < 0·0001). ![]() , White riceb;
, White riceb; ![]() , millet thick porridgeb;
, millet thick porridgeb; ![]() , millet couscous (self-made)a;
, millet couscous (self-made)a; ![]() , millet couscous (commercial)b;
, millet couscous (commercial)b; ![]() , wheat couscous (self-made)b.
, wheat couscous (self-made)b.
Gastric emptying
Of the seventy-three 13C-octanoic acid breath tests measured, there were four gastric half-emptying times that were unusually high and did not work well with the established modelling approach(Reference Sanaka, Yamamoto and Anjiki12–Reference Schadewaldt, Schommartz and Wienrich14,Reference Sanaka and Nakada16) (modelling parameters shown in online Supplementary Table 2). In one other instance, the R 2 model fit for percentage dose recovery was lower than the 0·80 cut-off (R 2 0·69), and thus the accompanying gastric half-emptying value was not included in the subsequent analysis. With this value excluded, the average R 2 for the model fit to percentage dose recovery was 0·94 ± 0·04, and the average R 2 for the model fit to cumulative percentage dose recovery was 0·9997 ± 0·0003. When examined as a box-plot, a range in half-emptying times per test meal food was apparent (online Supplementary Fig. 2). Gastric half-emptying times visualised by participant and averaged across all test meal foods revealed four instances of very long gastric half-emptying times (12·0, 13·8, 16·5 and 34·7 h) in a subset of three participants (online Supplementary Fig. 3). These four instances were deemed to be outliers, because the percentage dose recovery of the 13C tracer plateaued and did not decrease by more than 1 % of its peak value during the monitoring period. Even though the model fit was good (R 2 ≥ 0·93 for percentage dose recovery), the sustained elevation of 13C percentage dose recovery resulted in an overestimation of gastric half-emptying times (see online Supplementary Fig. 4 for an example of acceptable compared with excluded percent dose recovery curves).
In the end, no significant differences were found among mean gastric half-emptying times for the different test meal foods with outliers removed (P = 0·18; Fig. 5). No significant differences were found for lag phase (P = 0·89). Millet thick porridge had a significantly higher gastric emptying coefficient than white rice (P = 0·01) and wheat couscous (P = 0·02). The gastric emptying coefficient parameter is an overall indicator of gastric emptying, though it is worth noting that it lacks a meaningful definition(Reference Sanaka and Nakada16).
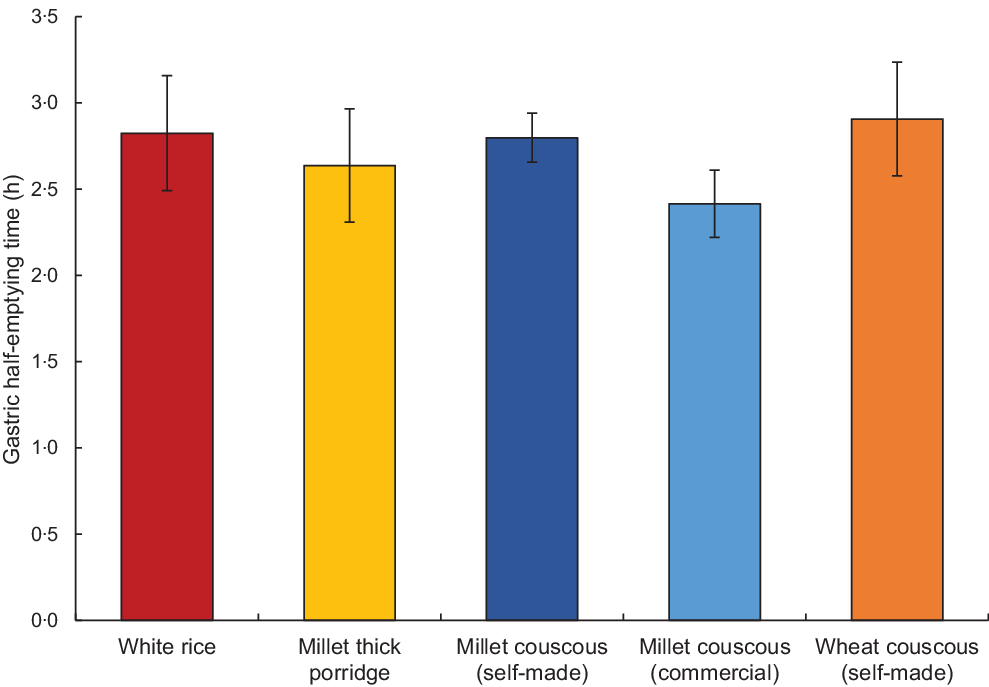
Fig. 5. Mean gastric half-emptying time for each carbohydrate-based test food (excluding four outlier values) as determined using the 13C-octanoic breath test. Error bars represent standard errors. No statistically significant differences were found (P = 0·18).
Analysis of relationship between gastric emptying and glycaemic response
No significant effects of gastric half-emptying time on glycaemic response characteristics (iAUC0–120 min, ΔPeak glucose value and time of peak glucose value) were observed, both with and without outliers included (without outliers: P = 0·37, 0·38 and 0·69, respectively; with outliers: P = 0·39, 0·40 and 0·73, respectively; online Supplementary Fig. 5).
Breath hydrogen
Breath hydrogen, as an indicator of fermentation of indigestible carbohydrates in the large intestine(Reference Simren and Stotzer25), was measured during the postprandial period to determine if carbohydrate fermentation occurred, which could affect glycaemic response and gastric emptying. As breath hydrogen values never rose above baseline for any of the treatments, it was concluded that fermentability was not a confounding factor in the study (online Supplementary Fig. 6).
In vitro gastric compartment pressure profiles
Gastric pressure profiles from in vitro experiments using the TIMagc showed millet couscous had an initial increase in pressure (about 2·5 bar) that was reduced to nearly 0 bar within the first 1 h (Fig. 6). Millet thick porridge exhibited high pressure (exceeding 10 bar at certain times) at later times than other test meal foods. Pressure profiles for wheat couscous and white rice showed slight initial increases in pressure and remained somewhat elevated (about 1 bar) until about 1·5 and 2 h, respectively. All samples exhibited negligible pressure after 2·5 h, because the gastric compartment emptied over time. Pressure values are reflective of viscosity in the stomach.
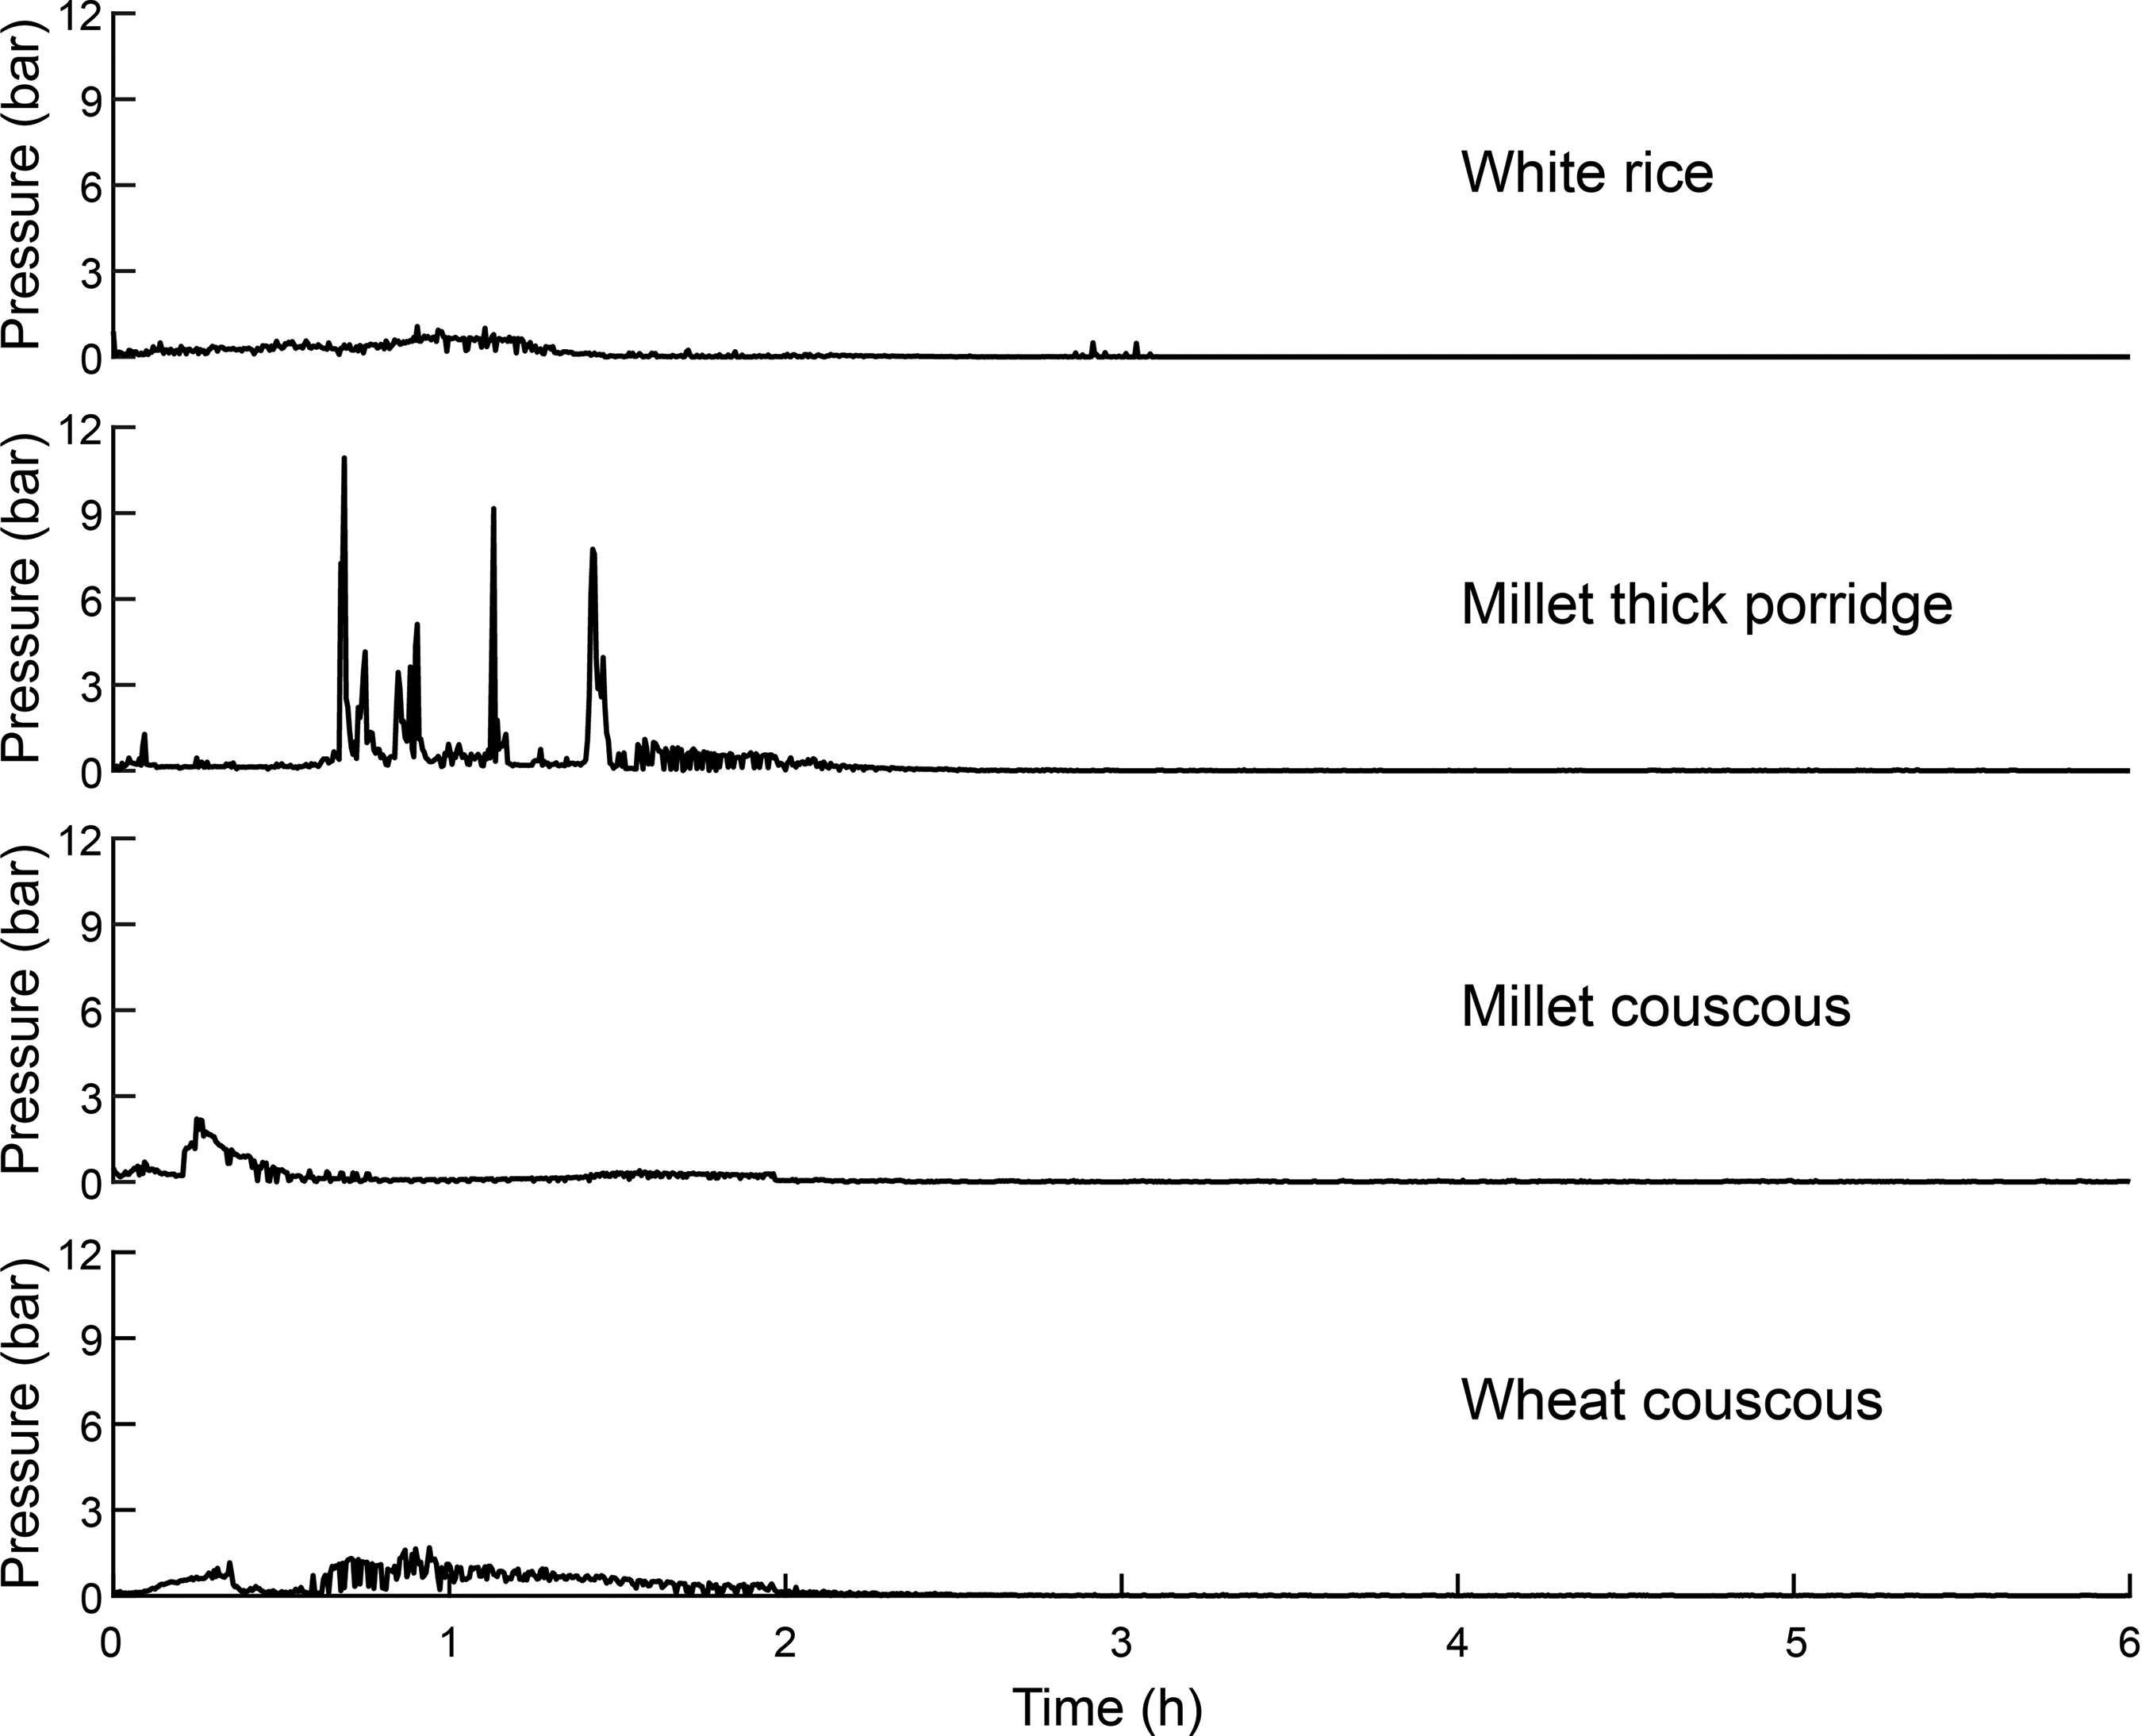
Fig. 6. Mean pressure values within the gastric compartment during in vitro gastrointestinal experiments for white rice, millet thick porridge, millet couscous (self-made) and wheat couscous. Means represent values from duplicate runs from experiments lasting 6 h.
Discussion
Pearl millet foods had moderately low glycaemic response compared with white rice, and millet couscous (self-made) had comparably high satiety relative to the other foods, with the exception of not having different fullness ratings from wheat couscous. This was despite a lack of difference in gastric half-emptying times that had been an original hypothesis of the study, since our previous work had shown very slow gastric emptying in millet foods in Malian participants. Nevertheless, millet foods may be a viable source of slowly digestible carbohydrate to moderate postprandial glycaemia and possibly food intake.
In the current trial, all millet-based foods and wheat couscous had significantly lower glycaemic response than white rice (P ≤ 0·05). Our initial thinking was that high viscosity itself was the cause of the lower postprandial glycaemia values for the two types of millet products, because the millet porridge was a thick, viscous one and, as mentioned above, millet couscous was shown in a gastric simulator to break down quickly and form a kind of paste. However, glycaemic effects for viscous starchy foods like the millet thick porridge are different from the low glycaemic response effect shown by other researchers for viscous soluble fibres(Reference Repin, Kay and Cui26,Reference Repin, Cui and Goff27) , as starch is degraded fairly rapidly in the small intestine with a parallel drop in viscosity. Mlotha et al. (Reference Mlotha, Mwangwela and Kasapila28) indeed showed that thick maize porridge in Malawi had a high glycaemic index. Thus, thick starchy porridges do not necessarily have low glycaemic response. For the millet couscous, our postulate that its rapid breakdown in the stomach may result in formation of a viscous paste to slow starch digestion was not borne out in experiments using the TIMagc gastric compartment, where millet couscous had lower pressure at later timepoints than the other foods. Also, the idea that thick pastes in the stomach would delay gastric emptying rate thereby lowering postprandial glycaemia was not supported. We conclude that viscosity was unlikely to be the cause for the lower glycaemia of millet foods, and reason that it was caused by a slow carbohydrate digestion property, which has been reported in some millet foods related to retention of intact millet cell wall structures(Reference Hayes, Swackhamer and Mennah-Govela4), increased intermolecular interactions leading to formation of denser matrices(Reference Hayes, Swackhamer and Mennah-Govela4,Reference Jane and Chen29,Reference Zhang, Dhital and Gidley30) or the presence of phenolic compounds(Reference Bora, Ragaee and Marcone31). Furthermore, previous studies have found that meal volume can affect gastric emptying rate(Reference Doran, Jones and Andrews32,Reference Hunt, Smith and Jiang33) . Although not measured in the present study, from observation, the couscous and rice samples were of a similar volume and the porridge had slightly less volume (though contained more water).
Notably, millet couscous (self-made) had overall lower hunger and higher fullness ratings compared with the other test meal foods (Figs. 3 and 4), which supports the anecdotal feelings of ‘fullness’ reported in West African populations consuming millet foods. However, why millet foods did not consistently promote higher satiety compared with other starchy foods matched in available carbohydrate remains unclear. Related to the anecdotal feeling of promoted satiety reported among individuals in the West African Sahel, it is possible that habitual consumption of millet impacts feelings of satiety through a physiological adaptation or cultural expectation of satiety.
No significant differences in gastric half-emptying times were observed among treatments, which was in contrast to our previous study in Mali showing millet couscous and thick porridge had much slower gastric emptying than non-traditional carbohydrate-based foods including white rice(Reference Cisse, Erickson and Hayes1) (Fig. 5). Millet foods have been reported to have a slow carbohydrate digestion property(Reference Hayes, Swackhamer and Mennah-Govela4,Reference Sandhu and Siroha34,Reference Annor, Marcone and Corredig35) , and we recently linked slow and ileal digestion of carbohydrates to slowed gastric emptying rate in rats(Reference Hasek, Phillips and Hayes36). Furthermore, we showed ileal digesting carbohydrate activated gut–brain axis signalling to decrease food intake in rats(Reference Hasek, Phillips and Zhang7). Although the digestive systems of rodents and humans differ in some ways(Reference Kararli37,Reference Dolenšek, Rupnik and Stožer38) , the small intestine has common structure and function features for the perception, digestion and absorption of nutrients(Reference Furness, Cottrell and Bravo39,Reference Hryn, Kostylenko and Yushchenko40) . It was an unexpected result that millet foods did not have long gastric half-emptying times, even though this was a primary outcome hypothesis of the study. It is notable that half-emptying times for foods in the current trial were approximately 3 h, which is comparable to times for white rice, potatoes and pasta in the Mali study(Reference Cisse, Erickson and Hayes1). This suggests that the Malian population had the same ‘baseline’ response to foods, but was more sensitive or prone to respond to millet. We speculate that usual consumption of millet-based foods may condition the body to respond by delaying gastric emptying rate, perhaps through a proliferation of ileal enteroendocrine L-cells, as has been observed in the colon in response to fermentable carbohydrates(Reference Cani, Hoste and Guiot41).
Our findings differ to some degree from two recent studies conducted with pearl millet porridge by Alyami et al. (Reference Alyami, Ladd and Pritchard42,Reference Alyami, Whitehouse and Yakubov43) in populations in the UK. Notably, we observed differences in glycaemic response but not gastric half-emptying time for pearl millet foods, whereas these previous studies did not find differences in glycaemic response but instead observed differences in gastric volume as assessed by MRI. However, both studies by Alyami et al. (Reference Alyami, Ladd and Pritchard42,Reference Alyami, Whitehouse and Yakubov43) incorporated porridges with particle sizes that were not matched, while our study also involved couscous matched for particle size (millet couscous (self-made), wheat couscous (self-made)); these differences may contribute to our different findings for glycaemic response, as particle size of starch-based meals has been shown to affect postprandial glucose levels(Reference Heaton, Marcus and Emmett44). Lower hunger was reported in one of the previous pearl millet studies(Reference Alyami, Ladd and Pritchard42), which aligns with our present findings. Intriguingly, Alyami et al. (Reference Alyami, Whitehouse and Yakubov43) observed a marked decrease in glucose-dependent insulinotropic polypeptide for pearl millet porridge compared with oat porridge; investigating the hormonal responses for millet couscous may be a promising area of future research.
Our study had some strengths as well as limitations. We precisely controlled the preparation of the test meal foods in terms of matching particle sizes of couscous, and cooking and time of cooling prior to serving. Test meals were matched on the amount of available carbohydrate. We also did in vitro experiments to gain insight into the potential role of viscosity within the stomach. However, we did not collect blood to measure hormone levels (e.g. glucagon-like peptide 1) that would directly indicate whether or not the ileal brake or gut–brain axis feedback systems were triggered, and we also did not measure insulin. From the food side, although we were unable to obtain commercial millet couscous from exactly the same grain source as used for the self-made millet couscous, both millets were grown locally in Senegal and used in the Dakar market. Still, these different millet grain sources could have somewhat influenced differences in glycaemic responses and appetitive sensations. The test meals differed in contents of fat, protein and energy, but these did not impact gastric half-emptying times. Other potential limitations include lack of blinding, randomisation and palatability measurements. Lastly, for the 13C-octanoic acid breath test, an assumption made is that the tracer is emptying from the stomach at the same rate as the test meal.
In conclusion, pearl millet-based foods and wheat couscous had lower glycaemic responses than white rice in a healthy normal weight US population. In addition, millet couscous (self-made) had lower overall hunger ratings than white rice, millet thick porridge, millet couscous (commercial) and wheat couscous, as well as higher fullness ratings than white rice, millet thick porridge and millet couscous (commercial). These findings demonstrate the potential of some millet-based foods to enhance satiety and aid in the control of blood glucose. Gastric half-emptying times did not differ among these foods, which was contrary to our previous finding that millet couscous and thick porridge markedly delayed gastric emptying rate in a Malian population(Reference Cisse, Erickson and Hayes1), and warrants further investigation. Overall, millet-based foods appear to be a source of slowly digestible carbohydrate.
Acknowledgements
We thank Dr Djibril Traore of the Institut de Technologie Alimentaire in Dakar, Senegal for obtaining and shipping the millet grain and commercial couscous, and for his guidance in this project.
This research was supported by the Whistler Center for Carbohydrate Research and made possible in part by the support of the American People provided to the Feed the Future Innovation Lab for Collaborative Research on Sorghum and Millet through the United States Agency for International Development (USAID). The contents are the sole responsibility of the authors and do not necessarily reflect the views of USAID or the United States Government. Program activities are funded by USAID under Cooperative Agreement No. AID-OAA-A-13-00047.
A. M. R. H. and B. R. H. designed clinical trial research; S. B., A. M. R. H. and B. R. H. designed in vitro research; A. M. R. H., F. G. and A. D. conducted clinical trial research; T. G. and A. M. R. H. conducted in vitro research; A. M. R. H., T. G. and S. B. analysed in vitro data; A. M. R. H., C. S. and B. R. H. analysed clinical trial data; A. M. R. H. and B. R. H. wrote the paper. B. R. H. had primary responsibility for final content. All authors read and approved the final manuscript.
The authors declare that there are no conflicts of interest.
Supplementary material
To view supplementary material for this article, please visit https://doi.org/10.1017/S0007114520005036