


Introduction
It is well known that anthropogenic activity in the subsurface locally perturbs the regional stress field and can induce earthquakes (Lasocki & Orlecka-Sikora, Reference Lasocki and Orlecka-Sikora2020). McGarr et al. (Reference McGarr, Simpson, Seeber, Lee, Jennings, Kisslinger and Kanamori2002) published a first overview of case histories. More recently, Suckale (Reference Suckale2009) assembled 70 cases related to hydrocarbon fields, Nicol et al. (Reference Nicol, Carne, Gerstenberger, Christophersen, Gale, Hendriks and Turkenberg2011) listed 75 cases of (subsurface) operations related to human-induced events, and Davies et al. (Reference Davies, Foulger, Bindley and Styles2013) assessed a list of 198 cases. An extensive overview of many cases was also given by the National Research Council (2013). Foulger et al. (Reference Foulger, Wilson, Gluyas, Julian and Davies2018) published the most comprehensive review of global, human-induced seismicity. The corresponding database HiQuake contains 1196 projects, for which induced seismicity is postulated (Wilson et al., Reference Wilson, Foulger, Gluyas, Davies and Julian2017; www.inducedearthquakes.org). The projects range from mining- and dam-induced earthquakes to shale-gas fracking, waste-water injection, geothermal energy and hydrocarbon production.
These reviews provide important information on current and historic cases of induced seismicity to better understand the phenomenon of anthropogenic earthquakes and manage existing and future subsurface operations. Furthermore, these reviews provide context for the debate around anthropogenic earthquakes in terms of an assessment of the frequencies and magnitudes of induced or triggered earthquakes.
Dost and Haak (Reference Dost, Haak, Wong, Batjes and de Jager2007) published an overview of natural (0 ≤ ML ≤ 5.8) and induced seismicity (0 ≤ ML ≤ 3.5) in the Netherlands. The study reported 280 gas production induced events between 1986 and December 2002. Since, the induced seismicity catalogue, published by the Royal Dutch Meteorological Institute (KNMI) (http://www.knmi.nl/kennis-en-datacentrum/dataset/aardbevingscatalogus), expanded tremendously to 1733 recorded events on 1 January 2021. The actual extent of the induced seismicity is wider as observations from several local seismic networks are not included in the KNMI catalogue. In addition, some of the seismicity in the south of the Netherlands is most likely induced by post-mining water ingress (Projectgroup GS-ZL, 2016) but is categorised as tectonic by the KNMI.
In this paper, we expand the overview of induced earthquakes in the Netherlands provided by Dost and Haak (Reference Dost, Haak, Wong, Batjes and de Jager2007). We incorporate all additional observations from both the KNMI national network as well as local, project-specific networks. We categorise the events with respect to anthropogenic activity: gas extraction, underground gas storage (UGS), geothermal heat extraction, salt solution mining and post-mining water ingress. Finally, we comment on related issues of project-specific hazard and risk assessment, risk governance and monitoring requirements.
Data and method
The bulk of our data came from the KNMI induced seismicity catalogue. The catalogue contained 1733 events recorded for the period 1986–2021 (Fig. 1). The catalogue provides epicentre locations and local magnitudes (ML) for all events. In the catalogue, the hypocentre depths of the events were by default fixed at 3 km. The KNMI allocated events as induced based on (a combination of) the following criteria:
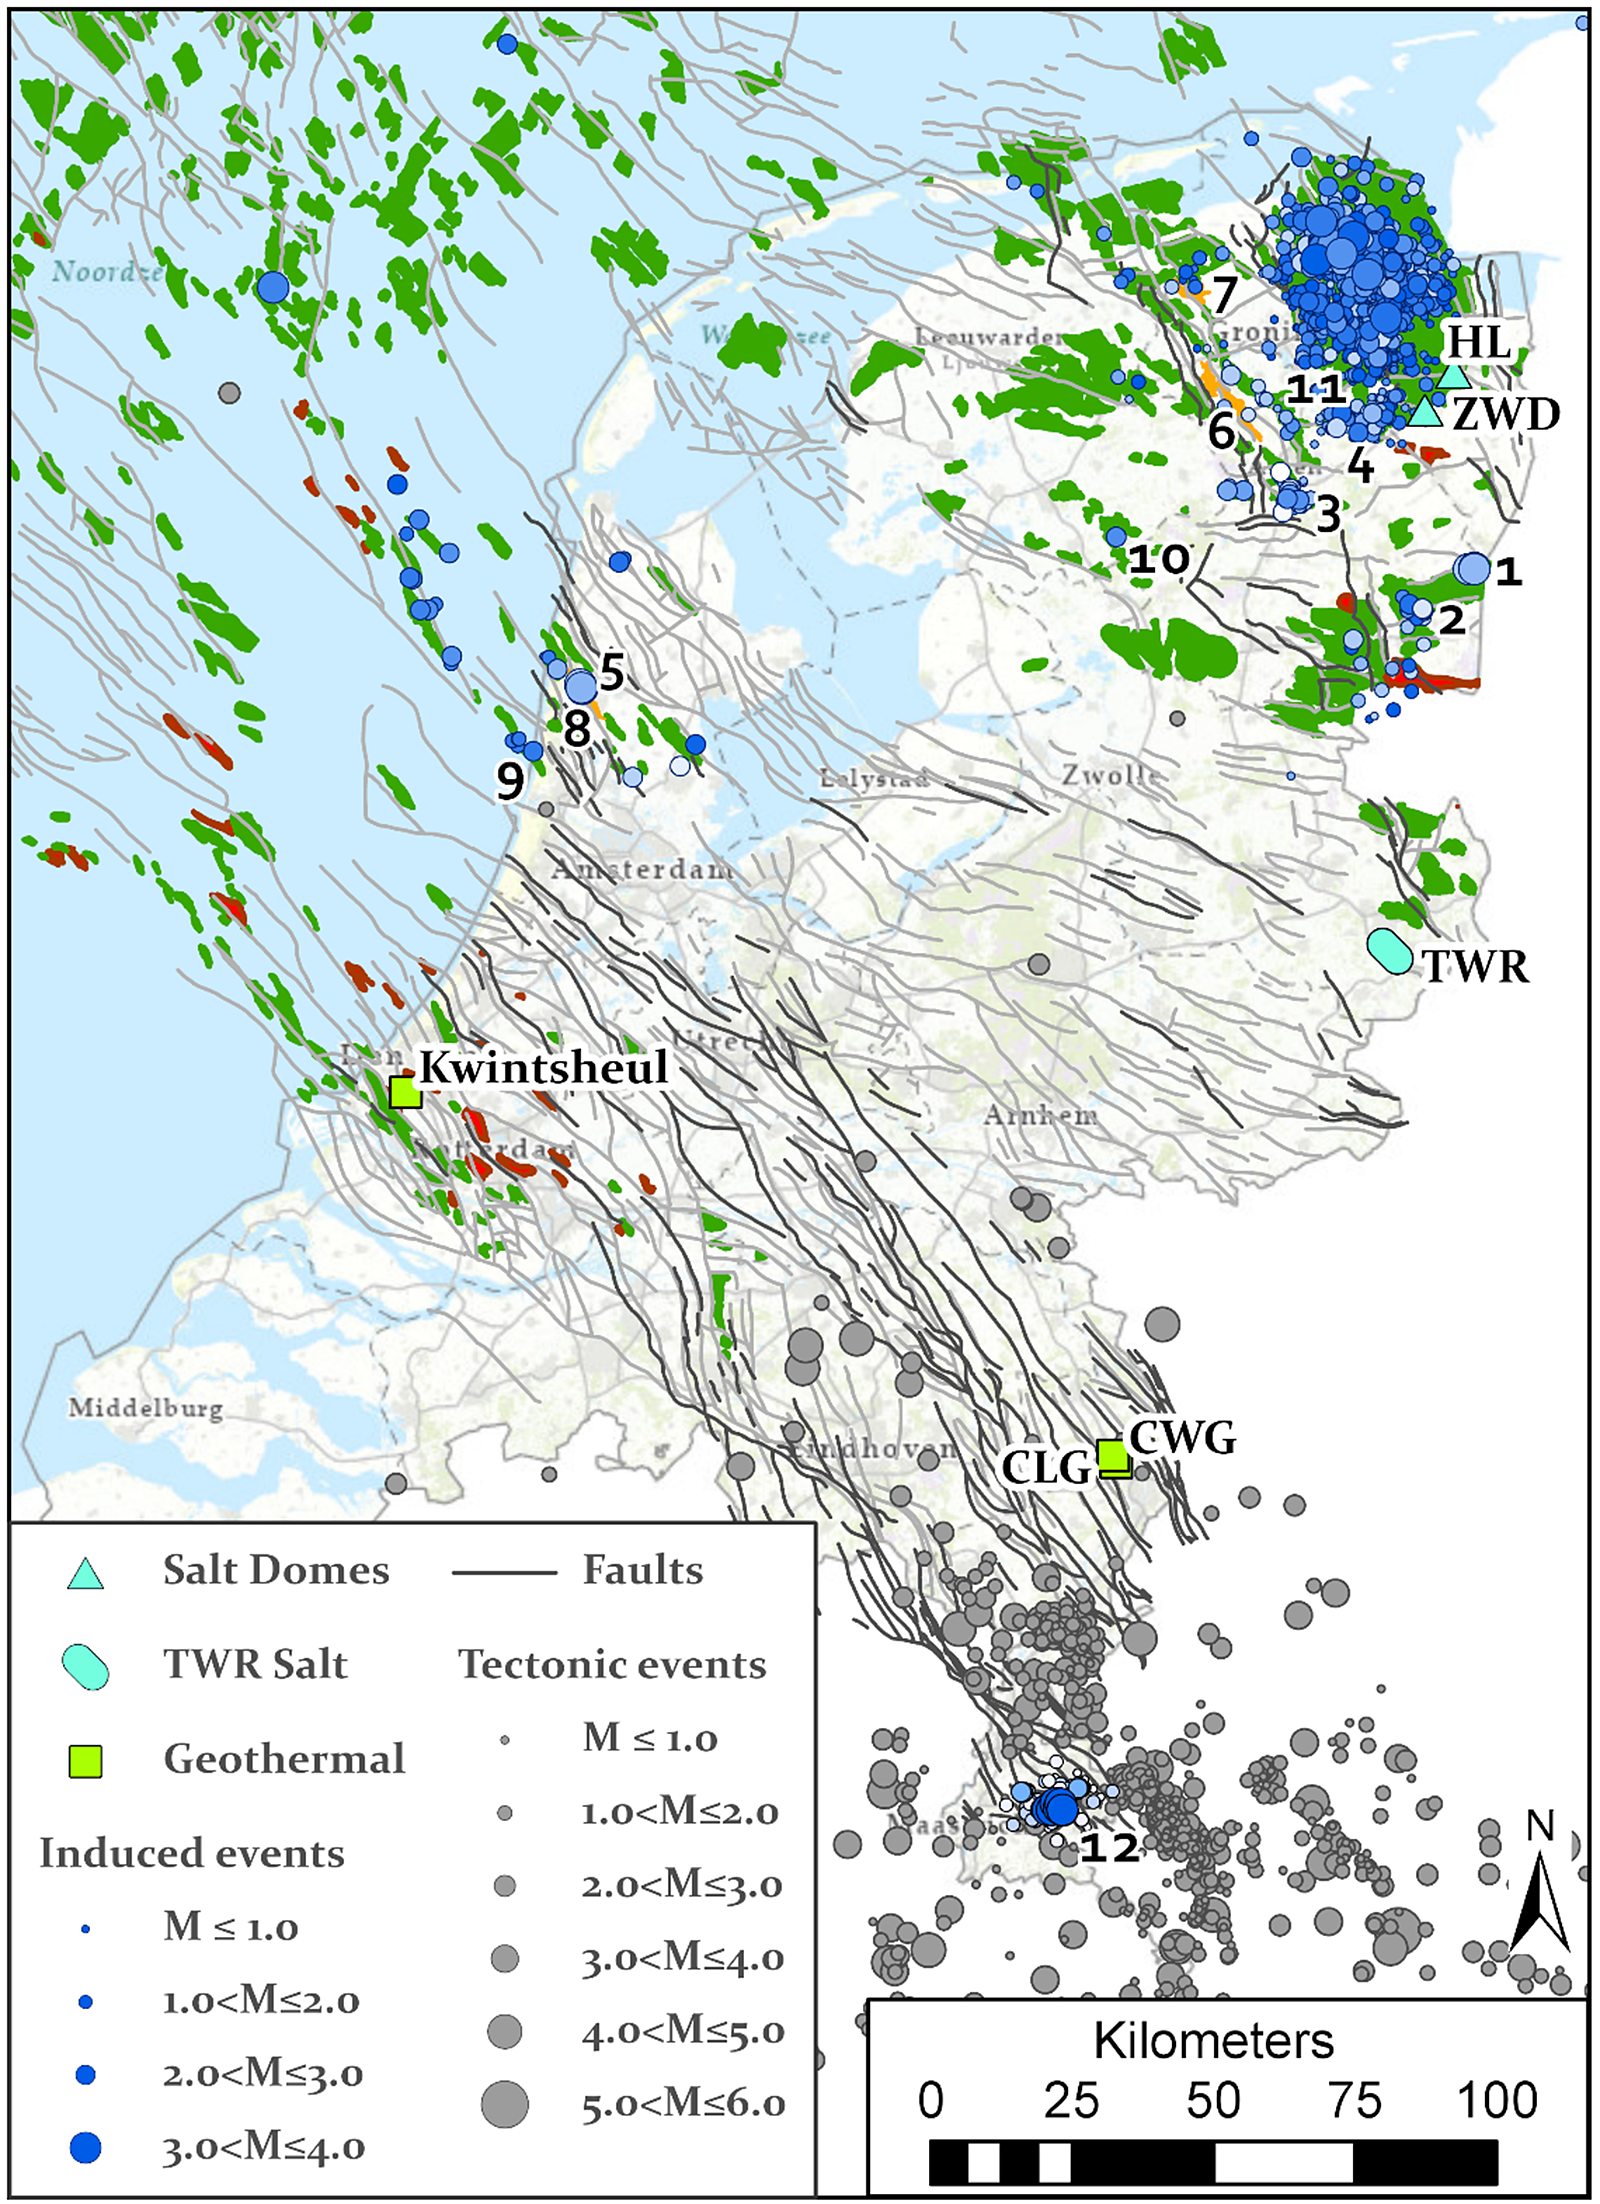
Fig. 1. Overview of seismicity in the Netherlands. The natural seismicity is indicated by grey circles, induced seismicity as recorded by the national KNMI network by blue circles (www.knmi.nl, January 1, 2021). The dark grey lines indicate potentially tectonically active faults; the light grey lines indicate faults in the Permian formations (www.nlog.nl). Oil and gas fields are denoted in red and dark green, respectively; the underground gas storage (UGS) gas fields in orange (www.nlog.nl): 1-Roswinkel, 2-Emmen, 3-Eleveld, 4-Annerveen, 5-Bergermeer, 6-Norg, 7-Grijpskerk, 8-Alkmaar, 9-Castricum Sea; 10-De Hoeve earthquake; 11-Midlaren seismic swarm; 12-post-mining water ingress induced seismicity. Geothermal doublets associated with seismicity are shown as bright green squares, salt domes with large solution mining caverns by cyan triangles, and the shallow solution mining area of Twente-Rijn by a cyan ellipse (www.nlog.nl). CWG: Californië Wijnen Geothermie; CLG: Californië Lipzig Gielen; HL: Heiligerlee salt dome; TWR: Twente-Rijn; ZWD: Zuidwending salt dome.
-
1. Location: in the north or the south of the Netherlands;
-
2. Preliminary hypocentre depth estimate: shallow (< 5 km) versus deep (>5 km);
-
3. Proximity to current subsurface operations.
Based on the first criteria, KNMI included all events in the south of the Netherlands in the tectonic seismicity catalogue. Therefore, we also include the tectonic seismicity catalogue of KNMI in our analysis.
Our dataset is further extended by publicly available data from local, project-specific monitoring networks at Bergermeer, Californie, Heiligerlee, Kwintsheul and Twente-Rijn (Fig. 1). All local catalogues provided hypocentre locations of the recorded events. Except for the data from Kwintsheul, local magnitudes are reported. The data from Kwintsheul are reported in duration magnitude (Md).
In this paper, we only distinguish between natural, tectonic and induced, anthropogenic events. Natural, tectonic events are those earthquakes that occur without any evidence of anthropogenic influence. Any event with an anthropogenic contribution, whether small or substantial, is considered an induced event.
We base our categorisation on the following criteria, which relate to the generally accepted criteria of Davis and Frohlich (Reference Davis and Frohlich1993) for injection-induced seismicity and the considerations of Wilson et al. (Reference Wilson, Foulger, Gluyas, Davies and Julian2017) for categorising anthropogenic earthquakes in the United Kingdom (UK):
-
1. Are the events the first known earthquakes of this character in this region?
-
2. Is there a clear temporal correlation between the seismicity and the subsurface activity or post-mining act?
-
3. Is there a spatial coincidence between the event and the subsurface activity or post-mining act?
-
4. Is there a coincidence between the reported hypocentre depth and the subsurface activity or post-mining act?
For attributing the induced events of the KNMI database to individual gas fields, the categorisation is critically dependent on the accuracy of the earthquake epicentres. In case of neighbouring or stacked gas fields, a unique association of an earthquake to a specific gas field is often not possible. In order to avoid bias, we used the classification scheme of Qcon (2018) to distinguish between reservoirs which have most likely produced seismicity (A-fields), reservoirs associated with seismicity in the main database (B-fields) and reservoirs for which a possible association with seismicity, given the location uncertainties of the seismic events, cannot be excluded (C-fields).
Applying these considerations provide us with an initial estimate of events that are anthropogenic in origin. Because of the paucity of detailed information, some events are classified as ‘undefined’. An overview of all Dutch events categorised as induced, as well as specifics of all the cases listed, is provided in the supplementary information of this paper. Where available, the hypocentre location uncertainties have been listed in Table 1 of the supplementary information.
Table 1. Overview of the threshold values for the pressure drop (dP), relative pressure drop (pressure drop (dP) divided by initial pressure (Pini)), Young modulus ratio (F) and fault density (S) and probabilities for the occurrence of seismicity (P) as derived in Van Eijs et al. (Reference Van Eijs, Mulders, Nepveu, Kenter and Scheffers2006) for the situation in 2004 and Van Thienen-Visser et al. (Reference Van Thienen-Visser, Nepveu and Hettelaar2012) for the situation in 2010

The Dutch seismic monitoring network
KNMI started seismological observations in 1904 with a single station at De Bilt. Since 1908, an historical archive of analogue seismograms has been kept and maintained. In 1926, the second station was installed in Heerlen (Limburg), followed by a third station near Witteveen (Drenthe) in 1951. In the 1970s, the network in the south was extended by multiple stations.
In 1986, unexpected seismic activity was recorded near a producing gas field in Drenthe, a province in the north of the Netherlands. Up to this first seismic event, the northern provinces were considered to be aseismic, although it is generally accepted that minor earthquakes did already occur in 1976, 1981 and 1984 (Van der Voort and Vanclay, Reference Van der Voort and Vanclay2014). In 1988, KNMI installed a small dedicated network of six seismic stations with an estimated detection threshold of ML 1.7 covering an area of 400 km2. In 1994, two ML≥3 events occurred in the Bergermeer gas field, some 100 km to the west. This led to the realisation that the problem was more widespread and more effective monitoring was necessary. In 1995, KNMI installed a seismic network with a magnitude of completeness of ML 1.5 and a 1-σ location uncertainty of approximately 1 km. An extension of the network in the north of The Netherlands in 2010 allowed for the detection of more smaller magnitude events since.
Between 2014 and 2016, a total of 70 stations were added to improve the hypocentre accuracy of the Groningen gas field lowering the local detection threshold over the field to ML 0.5 (Dost et al., Reference Dost, Ruigrok and Spetzler2017). Over the last years, additional stations were installed in Twente to monitor possible activity due to the injection of production water from the Schoonebeek oil field in old Carbonate gas fields, and in The Hague – Rotterdam area to monitor geothermal operations. Figure 2 shows an overview of the current national seismic network and its thresholds (status June 2020). The current network consists of 200 m deep borehole stations consisting of four seismometers at 50 m depth intervals (blue triangles); (near) surface broadband stations (green triangles) and surface accelerometers (red crosses).

Fig. 2. Overview of the station locations (triangles) and location thresholds (annotated red lines) of the national seismic network in the Netherlands (status June 2020; courtesy KNMI). Blue triangles denote the 200 m deep borehole stations consisting of four seismometers at 50 m depth intervals; green triangles denote the (near) surface broadband stations; red stars denote the surface accelerometers.
For monitoring low-magnitude events outside the Groningen region (ML < 1.5) and (near) real-time monitoring, several local, project-specific networks were installed over the past years. Data from these networks are publicly available, but these local networks were not integrated in the national network operated by the KNMI and the data are not reported in the national earthquake catalogue for induced seismicity.
Tectonic setting and natural seismicity
Tectonic setting
The extensive presence and exploitation of oil and gas in the Dutch subsurface led to a wealth of subsurface data. Over 5000 deep exploration and production wells were drilled and 3D seismic surveys cover about 60% of the country. Based on these data, the present-day lithostratigraphic and structural framework of the Dutch onshore and offshore was mapped in detail (TNO-NITG, 2004; Duin et al., Reference Duin, Doornenbal, Rijkers, Verbeek and Wong2006; Kombrink et al., Reference Kombrink, Doornenbal, Duin, Den Dulk, Van Gessel, Ten Veen and Witmans2012) and maps and datasets are freely available at www.nlog.nl and www.dinoloket.nl. This mapping reveals a structure of Mesozoic and Cenozoic basin elements with sediment thickness of up to 5 km, platforms and highs.
Four main tectonic phases affected the structure and stratigraphy of the area: i) the Caledonian and Variscan orogenies of the Palaeozoic, which resulted in the assembly of the Pangea supercontinent; (ii) the break-up of Pangea during the Mesozoic rifting; (iii) Alpine inversion of the Late Cretaceous and Early Tertiary; and (iv) Oligocene extension of the Rhine Graben rift system (Wong et al., Reference Wong, Batjes and De Jager2007). Apart from the ongoing extension of the Rhine Graben to the south-east of the Netherlands, no tectonic activity occurred since the Cenozoic (Houtgast et al., Reference Houtgast, Van Balen, Brouwer, Brand and Brijker2002).
For most of its geological history, the Netherlands was located at the southern edge of large basins (Geluk, Reference Geluk2000). This affected the facies distribution of the deposited sediments. This difference is clearly visible in, for example, the Permian Zechstein Group which is only present in the northern half of the country with thin clastics at its southern extend and evaporates in the north. The successive structural development in the north was influenced by the movement of the salt which created salt structures of large thickness.
A sequence of unconsolidated sediments of the North Sea group overlies the Mesozoic sequence. This North Sea sequence is mainly composed of sand and clay and varies in thickness from 250–1500 m. The upper 30 m of the shallow subsurface consists of heterogeneous sediments (sand, clay and peat) of Holocene age. The relatively low shear wave velocities of these sediments amplify the propagating seismic energy resulting in increased surface ground motions (Kruiver et al., Reference Kruiver, Wiersma, Kloosterman, De Lange, Korff, Stafleu, Busschers, Harting, Gunnink, Green, Van Elk and Doornhof2017).
The source of the gas contained in the Dutch gas fields (dark green contours in Fig. 1) is the coal layers of the Carboniferous formation (Wong et al., Reference Wong, Batjes and De Jager2007). The generated gas migrated upward and was successively trapped in the sandstones of the Carboniferous Limburg formation, the Rotliegend sandstones, the Z2 and Z3 Zechstein Carbonate layers, the Lower and Upper Triassic sandstone layers, and the Lower Cretaceous sandstones.
Natural earthquakes
The majority of the natural earthquakes in the Netherlands are located in the Roer Valley Graben (red dots in Fig. 1). This graben is located in the Lower Rhine Graben, which forms the north-eastern extend of the active Rhine Graben (Houtgast et al., Reference Houtgast, Van Balen, Brouwer, Brand and Brijker2002). Two large active faults bound the Roer Valley Graben: the Peel Boundary fault to the north-east and the Feldbiss fault to the south-west. The earthquakes are generally limited in magnitude (ML<4.0) and occur at depths of around 10 km (Hinzen et al., Reference Hinzen, Reamer and Fleischer2020). Occasionally the earthquakes are powerful enough to cause damage.
The largest recorded earthquake had a local magnitude of 5.8 (moment magnitude 5.4) and occurred on 13 April 1992 just south of Roermond (Paulssen et al., Reference Paulssen, Dost and Van Eck1992). The total damage estimate was approximately €128 million (Berz, Reference Berz1994). The earthquake was attributed to the Peel Boundary fault. The second largest earthquake in the Netherlands, in November 1932 with a local magnitude of 5.0, also occurred along the same fault 64 km northwest of the Roermond epicentre near Uden (Van Dijk, Reference Van Dijk1934; Gees, Reference Gees1937). Activity appears to terminate to the northwest of Uden (Dost and Haak, Reference Dost, Haak, Wong, Batjes and de Jager2007). The natural events in the south of Limburg occurred slightly deeper than the Roer Valley Graben events (10-20 km depth; Hinzen et al., Reference Hinzen, Reamer and Fleischer2020). Outside these regions, only a few incidental events were recorded near Nijmegen, ca. 70 km north of Roermond, and on the Netherlands continental shelf.
Induced seismicity in the Netherlands
Gas extraction
Gas fields (excluding Groningen)
The Dutch onshore and offshore assets consist of over 450 gas fields, of which 263 are still producing (87 onshore and 176 offshore) (Fig. 1). The total cumulative gas production in the period 1960–2021 was 3548.5 billion Nm3, of which 2202 billion Nm3 (62%) from the Groningen gas field. The majority of these gas fields are found in a zone where the Rotliegend Sandstone is overlain by thick Zechstein salt deposits (up to 2000 m thick). This zone stretches from England through the northern provinces of the Netherlands and Germany all the way into Poland. The other gas fields are located in Carbonate layers within the Zechstein formation and in sandstone layers within the younger Triassic and Lower Cretaceous formations.
The first induced seismic event recorded by the KNMI network was on 26 December 1986, near the town of Assen and had a magnitude of ML 2.8. The event was recorded by the KNMI network monitoring natural seismicity far away in the south-east of the Netherlands. The analysis located the event near the Eleveld gas field. Initially, it was unclear what caused this earthquake but a relation with gas production was suggested. As a quickly installed local network recorded more and more events near gas fields in the area, a causal relationship was acknowledged in the early 1990s (BOA, 1993; Roest and Kuilman, Reference Roest and Kuilman1994). In fact, Roest and Kuilman (Reference Roest and Kuilman1994) first demonstrated that due to poro-elastic stress changes induced by pressure depletion in a gas reservoir, the effective vertical stresses could increase much faster than the effective horizontal stresses, enabling local normal faulting reactivation of sub-vertical faults within the gas reservoirs.
Thirty-eight gas fields are associated with induced seismicity. Most of the events are small in magnitude (ML < 2.5) but still pose a hazard of ground motion nuisance, particularly to a population unfamiliar with seismic events and unprepared for earthquake shaking. The larger earthquakes occasionally caused minor non-structural damage to buildings. So far, only three fields are characterised as having had induced seismic events with magnitudes above ML 3.0: Bergermeer (up to 3.5), Groningen (up to 3.6) and Roswinkel (up to 3.4). The level of seismic activity in the gas fields varied significantly. Most fields (30) experienced less than five events. Besides Groningen, only the gas fields Annerveen (94), Eleveld (45), Roswinkel (38) and Emmen (15) are associated with more than ten events (Fig. 1).
Until recently, the detection and location thresholds showed a lot of spatial variation within the Netherlands. Consequently, events with ML ≤ 1.5, as observed in the northern part of the Netherlands, may well have gone unnoticed in the western and south-western part of the Netherlands where the magnitude of completeness exceeded ML2.0 until 2020 (Dost et al., Reference Dost, Ruigrok and Spetzler2017).
Van Eijs et al. (Reference Van Eijs, Mulders, Nepveu, Kenter and Scheffers2006) conducted an elaborate statistical assessment of correlations between reservoir properties and induced seismicity. Van Thienen-Visser et al. (Reference Van Thienen-Visser, Nepveu and Hettelaar2012) updated the study. These studies concluded that besides the pressure depletion, the ratio between the overburden’s Young’s modulus and the reservoir’s Young’s modulus (the stiffness ratio) as well as the fault density could be key parameters for distinguishing seismically active from seismically inactive fields. Based on the observed correlation, a probability for the occurrence of seismicity was derived (Table 1). Assessing the results discussed in Van Eijs et al. (Reference Van Eijs, Mulders, Nepveu, Kenter and Scheffers2006) and Van Thienen-Visser et al. (Reference Van Thienen-Visser, Nepveu and Hettelaar2012), we observed a large number of fields that did not show any recorded seismicity but had similar key parameter values to those of the seismically active fields (Fig. 3). The discriminative capability of the derived key parameters for differentiating between active and inactive fields falls short for fields with parameter values exceeding the threshold values. This could be due to the fact that (i) seismicity occurred at levels below the detection threshold of the seismic network, (ii) the studies were biased by using ‘characteristic’ values for the reservoir properties ignoring the uncertainty bandwidth of these properties and heterogeneity, or (iii) the statistical assessment was unable to properly identify the actual geomechanical characteristics responsible for induced seismicity.

Fig. 3. (A) The relative depletion versus the total seismic moment released for 180 Dutch gas fields. For displaying purposes, fields without any recorded induced seismicity have been plotted at a seismic moment of 109 Nm. The dotted line indicates the minimum value for the seismically active fields. Fields with a relative depletion below this minimum have not been associated with induced seismicity. (B) The stiffness ratio versus the fault density for the gas fields with a relative depletion exceeding the threshold value (dotted line in A). The dotted lines indicate the minimum values of both parameters for the seismically active fields (cyan dots).
Qcon GmbH (2018) developed a framework for numerically simulating poro-elastic stresses in producing (small) onshore gas fields in the Netherlands and predicted the occurrence of seismicity based on the onset of slip on the faults. Similar to the statistical approach, the physics-based model results showed a mismatch between predicted failure and observed seismicity for approximately 50% of the non-seismically active gas fields. The authors argued that the approach of making global assumptions for model parameters (e.g. initial subsurface stress estimates) that are typically not known, tends to oversimplify the analysis. On the other hand, it is just as likely that the physical processes considered were oversimplified or an important discriminating process was not incorporated. Clearly, the knowledge of the Dutch subsurface and the physical processes, inducing seismicity, is currently insufficient to properly explain the (non)occurrence of induced seismicity due to gas production.
The Groningen gas field
The large Groningen gas field in the north-east of the Netherlands is the seismically most active field in the Netherlands with 1396 registered events (−0.8 ≤ ML ≤ 3.6) to date (January 1st 2021, Fig. 4a). The first recorded event (ML = 2.4) in the Groningen gas field occurred in December 1991.

Fig. 4. An overview of the seismicity in the Groningen gas field. (A) Seismicity as reported by the Royal Dutch Metrological Institute (KNMI) on a map of the region. The colour coding of the seismicity indicates the temporal evolution of the seismicity: light blue – early events; dark blue – events later in time. The sizes of the seismicity indicate the local magnitude of the events. The grey lines indicate the faults as mapped by the operator (De Jager and Visser, Reference De Jager and Visser2017). (B) The temporal evolution of the Groningen seismicity. The dark solid line shows the 5-year moving average of all ML ≥ 1.5 events plotted at the centre of each time window. The dark dashed line shows the annual gas production from the Groningen field in billion cubic metres (bcm). The colour bars denote the annual number of earthquakes in different magnitude classes.
Initially, the annual number of events was relatively constant (two to seven events of ML ≥ 1.5 per year) and magnitudes remained relatively low (ML < 3). Between 2000 and 2013, the seismicity increased significantly from two ML ≥ 1.5 events in 2001 to 29 ML ≥ 1.5 events in 2011 and 2013 (Fig. 4b). Concurrently, larger-magnitude events started to occur, with the first ML ≥ 3.0 events recorded in 2003 and the first ML ≥ 3.5 in 2006. The largest event to date with ML = 3.6 occurred on 16 August 2012. The event caused significant non-structural damage throughout the region and led to anxiety among citizens and substantial public turmoil (Van der Voort and Vanclay, Reference Van der Voort and Vanclay2014).
The Groningen gas reservoir is located at a depth of 3 km within the Rotliegend sandstone (De Jager and Visser, Reference De Jager and Visser2017). The reservoir overburden consists of Zechstein halite and anhydrite salt deposits varying in thickness from ∼100 m to >1000 m. Within the reservoir, over 1100 faults were identified (De Jager and Visser, Reference De Jager and Visser2017). The induced events are mainly located in the central and south-western parts of the field on the faults of two NNW-SSE orientated graben systems within the field. The majority of the seismic events occurs within the reservoir layer (NAM, Reference NAM2015; Spetzler and Dost, Reference Spetzler and Dost2017; Willacy et al., Reference Willacy, van Dedum, Minisini, Li, Blokland, Das and Droujinine2019). The focal mechanisms derived for a subset of the events show predominantly normal faulting mechanisms with occasionally a minor strike-slip component (Willacy et al., Reference Willacy, van Dedum, Minisini, Li, Blokland, Das and Droujinine2019, Dost et al., Reference Dost, Van Stiphout, Kühn, Kortekaas, Ruigrok and Heimann2020).
Based on an analysis of the seismicity, estimates were made of the largest magnitude that could be expected to occur. In 1993, the BOA study came to an initial estimated value of ML 3.3. KNMI later increased this estimate to ML 3.5 in 1995 (de Crook et al., Reference De Crook, Dost and Haak1995). The ML 3.4 event at the Roswinkel gas field in 1994 caused KNMI to reconsider their prediction and based on a Monte Carlo assessment the estimate for the largest magnitude likely to be expected was adjusted to ML 3.7 in 1998 (de Crook et al., Reference De Crook, Dost and Haak1998) and finally to 3.9 in 2006 (van Eck et al., Reference Van Eck, Goutbeek, Haak and Dost2006). Muntendam-Bos and De Waal (Reference Muntendam-Bos and De Waal2013) showed that an upper magnitude bound could not be derived with a statistical analysis of the Groningen seismicity data of that time. They concluded that events with magnitudes as large as ML = 5 could not be excluded. Studies carried out by the operator (NAM, Reference NAM2013a; Bourne et al., Reference Bourne, Oates, van Elk and Doornhof2014) confirmed the latter results.
In March 2016, the operator NAM assembled 36 experts for a workshop to establish the maximum magnitude Mmax that could possibly occur in the Groningen gas field (NAM, Reference NAM.2016). The workshop was held in accordance with the level three guidelines of the SSHAC method (USNRC, 2012). A Senior Seismic Hazard Analysis Committee (SSHAC) Level 3 or 4 process provides regulatory assurance that the hazard or risk assessment considers all data and models proposed by members of the technical community and the associated uncertainties have been properly quantified. Based on all the proponent presentations, the expert panel derived a conditional Mmax distribution (Table 2; NAM, Reference NAM.2016). The weighted mean of the distribution is about ML 5.0. The panel noted that events nucleating within the gas reservoir should be assumed to have magnitudes of ML 5.0 and smaller. Magnitudes lager than ML 5.0 can nucleate at any depth within the seismogenic crust. Many of the studies taken into consideration at the workshop were later published (e.g. Zöller and Holschneider, Reference Zöller and Holschneider2016; Dempsey and Suckale, Reference Dempsey and Suckale2017; Shapiro et al., Reference Shapiro, Dinske and Krueger2017).
Table 2. Assessed discrete Mmax distribution with relative weight of each of the branches (NAM, Reference NAM.2016)

Following the publication of the report of Muntendam-Bos and De Waal (Reference Muntendam-Bos and De Waal2013), the Dutch government decided to reduce the production offtake from the Groningen gas field. In six consecutive ministerial decisions, the offtake decreased from 54 billion cubic metres (bcm) in 2013 (Kamp, 2014) to 21.6 bcm in April 2017 (Kamp, 2017). In March 2018, the Dutch government decided to further reduce the production annually by as much as possible, aiming at terminating all production from the Groningen gas field in 2030 (Wiebes, 2018). At this moment, the termination of production is anticipated already in 2022 (Wiebes, 2019).
Along with the reduction in production, the seismic activity in the gas field decreased as well (Fig. 4b). Larger-magnitude events (ML ≥ 3.0) and surges of lower-magnitude events (0.5 ≤ ML ≤ 2.5) are still observed, though (Muntendam-Bos, Reference Muntendam-Bos2020). This is due to the fact that stresses on the faults keep increasing with ongoing gas production although at a lower rate. This loading of the faults occurs relatively homogeneously throughout the large field. Hence, regionally various but similarly orientated fault patches can be close to failure at the same time and induce a sequence of events or larger-magnitude events, within a limited region in a relatively short time frame (Muntendam-Bos, Reference Muntendam-Bos2020).
Underground gas storage (UGS)
Natural gas reservoirs
The Netherlands have four operating underground gas storage (UGS) systems which utilise former natural gas reservoirs: Norg, Grijpskerk, Bergermeer and Alkmaar. Three of these UGS systems (Fig. 1) were associated with seismicity during gas production prior to conversion to a storage system. Only the peak gas installation (PGI) in the Alkmaar gas field with a working gas capacity (wgc) of 0.5 billion cubic metre (bcm) has never registered any seismic activity.
The Alkmaar gas storage operates as a PGI, which means it provides gas only at times of high demand during the winter (BP Nederland, 2003). During the summer months, the total volume of gas extracted during the winter is reinjected. Its total gas volume is 3.6 bcm. The PGI is located in the Platten dolomite, which is part of the Z3 Zechstein Carbonate formation. The Platten Dolomite is characterised by high permeabilities, making it highly suitable for high rate peak production and is relatively stiff with a Young modulus of 40 GPa. Hence, the field is associated with relatively little compaction. On the south-west side, the reservoir is bounded by a major normal fault (dip closure).
The UGS Norg (wgc ∼6 bcm), UGS Grijpskerk (wgc ∼2.4 bcm) and UGS Bergermeer (wgc ∼6 bcm) are all located in the Rotliegend sandstone. Both Norg and Grijpskerk are located within the Lauwerssea Trough at depths of 2700 m and 3300 m, respectively (Fig. 1; NAM, Reference NAM2013b; Reference NAM2018). During initial gas production, an ML 1.5 earthquake was recorded by the national KNMI network at Norg in 1993. Norg experienced a single additional event of ML 1.1 in June 1999 at the end of its initial injection to full capacity (NAM, Reference NAM2018). At UGS Grijpskerk, an event was observed during production in 1997 (ML 1.3). Fifteen years after conversion and start of UGS operation, a second event (ML 1.5) was recorded by the national KNMI network in 2015 during cyclic operation.
The Bergermeer gas storage system is located within a previously depleted gas field in the west of the Netherlands (Muntendam-Bos et al., Reference Muntendam-Bos, Wassing, Geel, Louh and van Thienen-Visser2008). During gas production, four seismic events were induced, which were all recorded by the national network: events of ML 3.0 and ML 3.2 in 1994 and events of ML 3.5 and ML 3.2 event in 2001. In 2007, production from the gas field terminated and a conversion of the field to an UGS system was prepared. The injection of cushion gas commenced in 2010 and the storage system has been fully operational since the spring of 2015.
To closely monitor induced seismicity in the Bergermeer gas storage system, a 6-level borehole geophone string was deployed in an existing production well close to reservoir depth (Taqa, 2017; Qcon GmbH, 2016). The monitoring array is capable of detecting ML −1.5 events throughout the storage reservoir. Locally around the array, events of even lower magnitudes were observed. In total, 366 induced events were recorded by the downhole geophone string (Fig. 5). The strongest event recorded since the conversion had a magnitude of ML 0.7. This event was recorded by both the local and the national array. Generally, the events are located either within or above the reservoir layer. Most seismicity occurred on the central and eastern bounding faults (Qcon GmbH, 2016). Through time, a north-south migration of the seismicity was observed (Fig. 5a; Qcon GmbH, 2016).
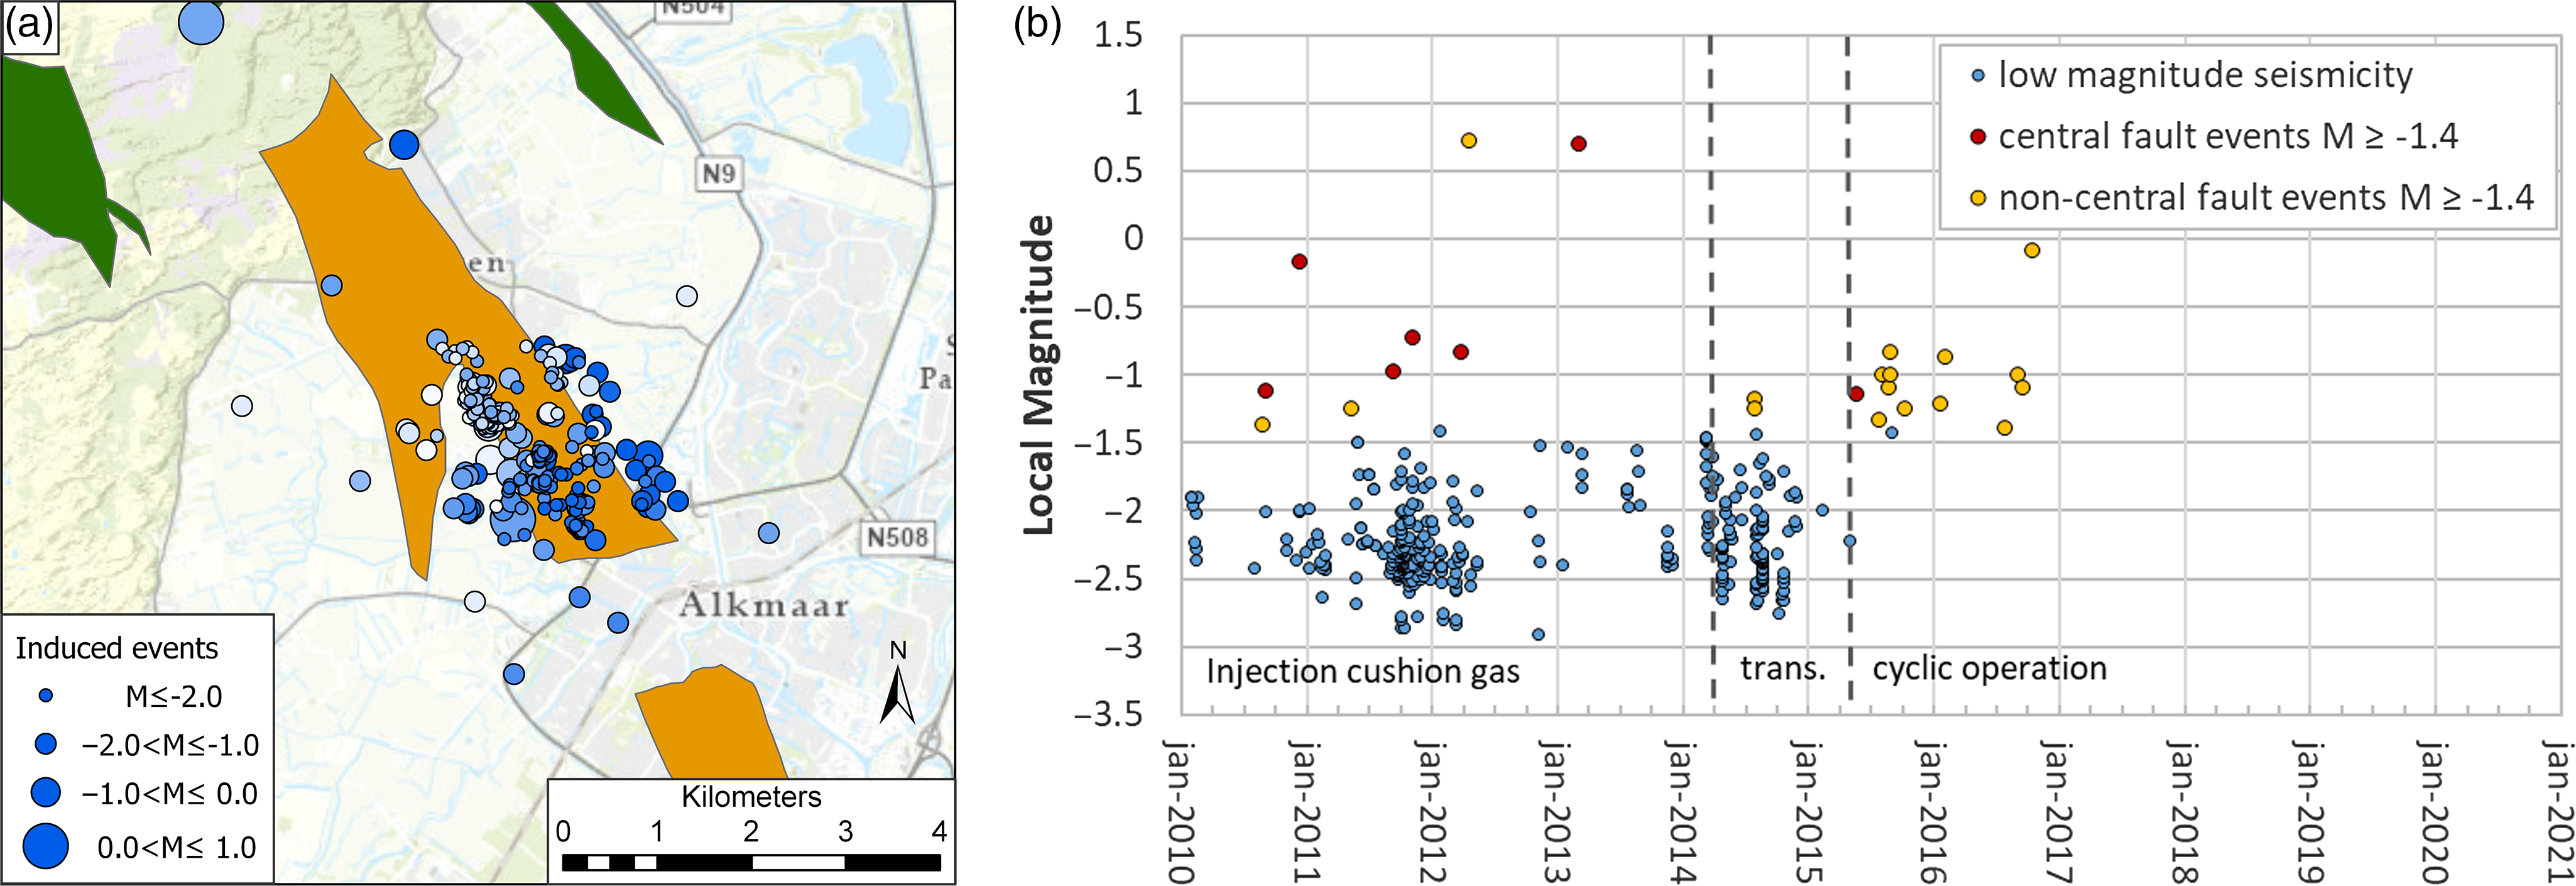
Fig. 5. (A) Spatial overview of the seismicity recorded at the Bergermeer gas storage reservoir (www.taqainnederland.nl). The colour coding of the seismicity indicates the temporal evolution of the seismicity: light blue – early events; dark blue – events later in time. (B) Temporal evolution of the seismicity recorded at the Bergermeer gas storage reservoir (www.taqainnederland.nl). The vertical dotted lines indicate the transition between the periods of cushion gas injection, and the storage period with cyclic operation.
Figure 5b shows the development of the seismicity in the Bergermeer UGS through time (Taqa, 2017). Initially, during the injection of the cushion gas, a number of clusters of small events occurred on previously undiscovered baffles or small faults within the reservoir. Events with magnitudes above ML −1.5 predominantly occurred on the large central ’scissor’-fault (Qcon GmbH, 2016). Since late 2014, the seismic activity on the central fault disappeared. The timing of this coincided with a significant reduction of the pressure differential over the central ’scissor’-fault. Subsequently, the ML > −1.5 events occurred incidentally only on the eastern bounding fault. Since October 2016, no further events have been observed in the UGS.
The relation between induced seismicity and gas storage operations in Dutch gas reservoirs has been studied extensively (Nagelhout & Roest, Reference Nagelhout and Roest1997; Muntendam-Bos et al., Reference Muntendam-Bos, Wassing, Geel, Louh and van Thienen-Visser2008; Van den Bogert et al., Reference Van den Bogert, van Eijs, Solano Viota and Doornhof2016; Fenix Consulting Delft B.V., Reference Fenix Consulting Delft2018a, b; Ferronato et al., Reference Ferronato, Franceschini, Isoton, Janna, Teatini, Tosatto and Zoccarato2018). The general consensus of the studies is that induced seismicity in the Rotliegend sandstone reservoirs is feasible during the (re-) injection of cushion gas and the cyclic storage phase in which only the volume of working gas is produced and reinjected. However, magnitudes are expected to remain well below the level observed during depletion.
This conclusion contradicts the observations at the Castor project in the old Amposta field, Spain, where a cluster of events was observed during gas injection while no induced seismicity was previously recorded during production. This project aimed to convert the old, depleted oil field into a gas storage. Similar to the observations at Bergermeer, induced seismicity commenced shortly after the onset of cushion gas injection (Cesca et al., Reference Cesca, Grigoli, Heimann, Gonzalez, Buforn, Maghsoudi, Blanch and Dahm2014). In contrast to Bergermeer, events up to magnitude 2.6 occurred during the injection, and after 12 days, injection was stopped. Still, the earthquakes continued and magnitudes increased. The largest event had a moment magnitude of 4.3. In total, over 1000 earthquakes with moment magnitudes between 0.0 and 4.3 were observed (Cesca et al., Reference Cesca, Grigoli, Heimann, Gonzalez, Buforn, Maghsoudi, Blanch and Dahm2014).
There are a few important differences to consider between Amposta and the Dutch storage fields. First of all, the Amposta field is located in fractured and brecciated Lower Cretaceous dolomitic limestone (Gaite et al., Reference Gaite, Ugalde, Villaseñor and Blanch2016). The Dutch seismically active storage sites are located in the Rotliegend sandstone. Secondly, the Amposta field was characterised by a strong water drive during depletion, rendering enhanced oil recovery unnecessary. None of the Dutch storage fields showed substantial water drive during depletion. Finally, the hypocentre depths of the Amposta earthquakes ranged from the injection depth to several kilometres deeper (Cesca et al., Reference Cesca, Grigoli, Heimann, Gonzalez, Buforn, Maghsoudi, Blanch and Dahm2014; Gaite et al., Reference Gaite, Ugalde, Villaseñor and Blanch2016). Considering that the field is located in the active Catalon-Valencian normal faulting extensional region (Perea et al., Reference Perea, Masana and Santanach2012), this may indicate that these earthquakes also contain a tectonic component. In the Dutch studies, a non-critical subsurface stress state prior to depletion is assumed.
Salt cavern systems
The Netherlands has one storage operation where natural gas is stored in salt caverns. These caverns were leached specifically for this purpose. The Zuidwending UGS facility consists of five caverns located at a depth of 1–1.5 km (Energystock, 2017). The caverns have radii between 50 and 80 m and are 300–400 m high. The five caverns contain flexible gas supplies, which can absorb short-term differences in natural gas supply and demand. The storage caverns are located in the Zuidwending salt dome (Fig. 1), where the Zechstein evaporates rose (due to diapirism, e.g. van Gent et al., Reference Van Gent, Urai and De Keijzer2011; Harding and Huuse, Reference Harding and Huuse2015) to depths as shallow as 200 m. Adjacent to the gas storage, a salt mining cavern field is in operation within the same salt dome.
On 9 January 2019, an ML 1.1 event occurred on the southern flank of the salt dome at a depth of 1275 m (Ruigrok et al., Reference Ruigrok, Spetzler, Dost and Evers2019). KNMI was unable to establish the mechanism by which the seismic energy was generated. They hypothesised that the brittle rock overlying the salt might have moved due to salt creep (Ruigrok et al., Reference Ruigrok, Spetzler, Dost and Evers2019). In the fall of 2020, the two operators within the Zuidwending salt dome installed a local (micro-)seismic monitoring array of six seismometers with 2 geophones (at 60 m and 90 m depth) to assess any possible future seismicity in more detail.
Geothermal heat production
Porous sandstone reservoirs
In the Netherlands, geothermal heat production commenced in 2006 and has since predominantly been used to heat greenhouses (Mijnlieff, Reference Mijnlieff2020). Most geothermal doublets are located in relatively shallow, porous, sedimentary aquifers at 2–2.7 km depth with fluid temperatures of 60–100 °C. A case study review (Buijze et al., Reference Buijze, van Bijsterveldt, Cremer, Paap, Veldkamp, Wassing, van Wees, van Yperen and ter Heege2019) concluded that these systems are unlikely to generate felt seismic events (M > 2.0). The study suggested that especially geothermal operations in the shallow porous sandstones of the West Netherlands Basin (Lower Cretaceous and Upper Jurassic sandstones) are unlikely to generate seismicity. The study investigated 85 cases in various geothermal plays world-wide to assess the seismogenic potential of these systems. Their assessment showed no cases of geothermal doublet projects in shallow, porous sandstone formations with reported seismicity of M > 2.0. The authors related this absence to the fact that these systems are 1) far away from the seismogenic basement, which is prone to seismicity, 2) the pressure changes are very limited spatially as no stimulation is required, and 3) the intercalation of the sandstone formations with clay and shale layers would hydraulically isolate the formations from deeper layers.
Between July and October 2019, a special seismic monitoring array was installed by Delft University of Technology, in collaboration with Seismotech (Greece), at the geothermal operation of Nature’s Heat at Kwintsheul, the Netherlands (Weemstra, Reference Weemstra2019; Fig. 1). The seismic array consisted of 30 seismological stand-alone systems equipped with three-component short-period sensors, installed along two crossing lines, with an average inter-station distance of approximately 150 m (Fig. 6). As expected in this very populated and urban part of the Netherlands, the level of the background noise recorded by the sensors was very high (Fig. 7). Anthropogenic noise with frequencies higher than 2 Hz dominates the spectrograms. In order to detect any low magnitude seismicity in such a high noise level environment, utilisation of a dense monitoring array is inevitable.

Fig. 6. Layout of the dedicated seismic monitoring array (orange triangles) at the geothermal project of Nature’s Heat, Kwintsheul, the Netherlands. The red and blue line indicate the trajectories of the production and injection well, respectively. The blue dot indicates the epicentre location of the ML0.0 seismic event detected on July 14, 2019.

Fig. 7. Overview of the background noise at Kwintsheul as measured at a representative (surface) station. The observations at Kwintsheul were between June 22, 2019 and July 19, 2019. In the graphs, the upper and lower limits of the average global background noise level are indicated by the black lines. The top, middle, and bottom rows show the noise measured at the vertical (V), East (E), and North (N) components, respectively. The noise level at Kwintsheul exceeds the upper limit for nearly all frequencies. This means the background noise level in this urban area is very high.
Despite the significant level of background noise present in this part of the Netherlands, a seismic event of ML=0.0 (duration magnitude Md 0.16) was observed on 14 July 2019. The signal was recorded by all seismometers of the array. Using a 1D P- and S-wave velocity profile, a preliminary analysis of the event yielded a hypocentre relatively close to the tip of the injector (Fig. 6) with a depth estimate of 2.46 km. We note that the depth estimate is subject to large uncertainty (more than a kilometre) as it strongly depends on the vp/vs ratios used in the analysis. Consequently, the event cannot unambiguously be attributed to the geothermal operation, particularly because causality and the underlying physical cause have not been established, that is it cannot be excluded that the event is tectonic. At the same time, a relation with the geothermal operation can, at this point, not be excluded either.
Fractured and karstified carbonate reservoirs
In the vicinity of Venlo, at Californië, Limburg (Fig. 1), two geothermal doublet systems were realised within the seismically active Roer Valley Graben system to supply greenhouses with heat (Californië Wijnen Geothermie (CWG) and Californië Lipzig Gielen (CLG)). The reservoir formation is the Carboniferous Limestone Group but fluid was produced from the Tegelen fault zone, which intersects the reservoir formation (see also Mijnlieff, Reference Mijnlieff2020). The two systems are located just a few kilometres away from each other.
Natural earthquake activity was observed in the vicinity of the systems. Ten events of magnitudes below ML = 2.2 were recorded within a radius of 20 km (Fig. 1), of which the closest an ML = 1.1 event on 21 May 2007 at approximately 3.5 km distance (Fig. 8a). Numerical simulations indicated that the stress impact of the CWG system could induce seismicity due to thermal cooling, provided the Tegelen fault deforms seismically (Qcon GmbH, 2015), while for the CLG system the stress impact would be too small to cause seismicity (Qcon GmbH, 2019a). Nevertheless, a local monitoring network was established and a traffic light system was proposed.

Fig. 8. (A) Spatial overview of the relative epicentre locations with respect to the ML 1.7 earthquake recorded at the Californië geothermal projects in map view: blue – induced; red – tectonic. The colour coding of the induced seismicity indicates the temporal evolution of the seismicity: light blue – early events; dark blue – events later in time. The red and cyan lines indicate the trajectories of the production and injection wells, respectively. Note that the Tegelen fault to the south-west of the doublets dips north-eastward and intersects the southward facing wells at reservoir depth (2–2.5 km). The south-eastern tectonic (red) event in the overview is the KNMI location of the largest event in the September 2018 cluster derived based on observations on the national network. (B) Spatial overview of the relative hypocentre locations with respect to the ML 1.7 earthquake in 3D view (from Qcon, 2018; courtesy Qcon, CWG, and CLG). Well trajectories are indicated in red (producers) and blue (injectors). The local monitoring stations are indicated by the black triangles. Mapped trajectory of the Tegelen fault is displayed by the grey shading.
Between August 2015 and September 2018, a total of 17 earthquakes (−1.2 ≤ ML ≤ 1.7) were detected in the vicinity of the geothermal systems (Fig. 8; Qcon GmbH, 2019b). The epicentres were located close to the geothermal wells. The hypocentre of the main ML 1.7 event was estimated to be in the depth interval of 4 to 6 km (Qcon GmbH, 2019b; Spetzler et al., Reference Spetzler, Ruigrok, Dost and Evers2018), well below the geothermal reservoir (located at 2–2.5 km depth). However, the uncertainty in the depth estimate is large and an occurrence at 2.5–3.0 km (just below reservoir level) cannot be excluded. The hypocentres of the other 16 events were all derived relative to the main event only. The spatial and temporal correlation of the events with injection data of the CWG and CLG operations led to the conclusion that the geothermal operations are a probable cause of the events (Qcon GmbH, 2019b). However, a plausible explanation for the physical mechanism is hampered by the limited available geological information. Validation and refinement of the poorly constraint 1D seismic velocity model and subsequent reassessment of the hypocentre locations as well as improved imaging of the geological structure in the area could provide important information towards a causal explanation. Presently, operations in both systems remain suspended.
Salt solution mining
Twente shallow salt mines
Since 1918, salt is being extracted from the subsurface around the cities of Hengelo and Enschede in Twente, a region in the east of the Netherlands (Fig. 1). Here, the Triassic Röt salts are located at relatively shallow depths of 400–500 m. Through solution mining, about 270 disc-shaped, thin caverns with an average diameter of 120 m and height of a few dozen metres were developed in an area of roughly 20 km2. About 60 caverns are currently being actively leached.
In 1991, a sinkhole with a diameter of 30 m and 4.5 m deep developed overnight at the Enschedese Havenweg in Hengelo. The sinkhole resulted from an old salt cavern collapsing, and the cavity slowly migrated upward until it breached the surface that particular night (Bekendam, Reference Bekendam2005, Reference Bekendam2009). There were 62 potentially unstable caverns in the Twente region. If these caverns were to become unstable, they may potentially create sinkholes (Bekendam, Reference Bekendam2005, Reference Bekendam2009). Considering the surface installations on top, 22 of these caverns posed a substantial risk. So far, 20 caverns were stabilised by backfilling them with material which was leftover from the salt-production process (Nouryon, 2021). The remaining potentially unstable caverns will be filled over the next decades, starting with the caverns posing the highest risk.
In order to monitor the stability of these potentially unstable caverns, a local pilot seismic network was installed in 2016. This network consisted of two hydrophones inside two caverns and two shallow geophones. At the end of 2017, the pilot network was extended to three hydrophones (in three caverns), as well as five deep and two shallow geophones. A total of 59 events with magnitudes ranging from −2.6 ≤ ML ≤ 0.0 were recorded by the network. The majority of the events was geomechanical and probably related to small movements along the known faults in the area, albeit possibly induced by stress equalisation around the caverns. Ten of the events were induced by cracking in either the roof or footwall of the caverns. So far, no cavern instability was observed with seismic monitoring. Reports of the observed seismicity since 2019 can be obtained from the website of the operator (https://www.nobian.com/nl/zoutwinning/twente/actualiteiten-en-werkzaamheden).
Heiligerlee salt dome
On 19 November 2017, a seismic event (ML 1.3) was recorded near the town of Winschoten at the southern edge of the Groningen gas field (Fig. 1). Re-analysis of the seismic data derived a total of four events, of which two preceding the main event (Ruigrok et al., Reference Ruigrok, Spetzler, Dost and Evers2018). The epicentre of the main event was situated above the western flank of the Heiligerlee salt dome (Ruigrok et al., Reference Ruigrok, Spetzler, Dost and Evers2018), in which 12 salt caverns, labelled HL-A to HL-M, were mined (Fig. 9a). The derived depth for the main event was between 400 and 1500 m.

Fig. 9. (A) Overview of seismicity recorded at the Heiligerlee salt caverns. Note: the circles indicate the locations of the caverns, but are graphical simplifications of the actual shapes of the caverns. The colour coding of the seismicity indicates the temporal evolution of the seismicity: light blue – early events; dark blue – events later in time. The town of Winschoten is located just to the east of the salt caverns. (B) Depth distribution of the events associated with caverns HL-C (blue dots) and HL-H (orange dots). The orange and blue shaded zones indicate the depth range of the HL-H and HL-C cavern, respectively. Note that the depth ranges of the two caverns overlap. The variation in the depth of the top of the salt dome above the caverns is indicated by the two dark blue lines.
The caverns within the Heiligerlee salt dome are filled with brine and are actively being leached. The exceptions are HL-B, E, G and H, where leaching was terminated, and HL-K, which was largely filled with nitrogen gas. The nitrogen column is 487 m high, on top of 7 m of brine (De Buhr et al., Reference De Buhr, Wendt, Ernst and Von der Heyde2017). Most caverns resemble vertical cigars with an average diameter of about 100 m and an average vertical extent of 600 m. The caverns are located at depths of about 700–1600 m. The minimal distance between the cavern walls of adjacent caverns is approximately 125 m. HL-H is located near the edge of the dome and has a very irregular shape, which was caused by leaching around anhydrite banks located along the edge of the salt dome. HL-M is still under development and increasing significantly in both diameter and vertical extent.
The top of the salt dome is located at approximately 400–500 m depth. The overburden consists of a 10–100 m thick layer of Chalk, overlain by an approximately 400 m thick layer of Quaternary and Tertiary deposits. Within the overlying Quaternary and Tertiary layers, several sub-vertical faults have been interpreted (Raith, Reference Raith2019).
Salt solution mining was generally considered to be aseismic. No events were observed for any of the deeper caverns, and due to the visco-elastic behaviour of the salt, stress accumulation seemed unlikely. Ruigrok et al. (Reference Ruigrok, Spetzler, Dost and Evers2018) attributed the observed events to the possibility that the brittle rock overlying the salt could have moved due to salt creep. They deemed a relation with the caverns unlikely.
In other salt domes world-wide, large amounts of events were detected prior to collapse at both a controlled (Kinscher et al., Reference Kinscher, Bernard, Contrucci, Mangeney, Piguet and Bigarre2015) and uncontrolled (Shemeta et al., Reference Shemeta, Leidig and Baturan2013; Nayak and Dreger, Reference Nayak and Dreger2014) collapse of a salt cavern. Indeed, several case studies (e.g. Bollinger et al., Reference Bollinger, Nicolas and Marin2010; Mercerat et al., Reference Mercerat, Driad-Lebeau and Bernard2010; Sun et al., Reference Sun, Yang and Zhang2017) reported cases of seismicity observed in different salt formations around the world. Hence, monitoring a possible build-up of seismicity would allow to warn for possible hazardous situations. Since late 2018, the operators of the caverns in Heiligerlee have installed a dedicated local seismic network consisting of eight seismometers at four locations with geophones at 50 m and 60 m depth. In 2019, this network was extended by four more seismometers at two additional locations. Quarterly reports of the observed seismicity can be obtained from the website of the operator (https://www.nobian.com/nl/zoutwinning/groningen/werkzaamheden).
Up to 1 July 2020, a total of 46 events of magnitudes −1.21 ≤ ML ≤ 0.65 were recorded and located (Fig. 9a; Bosq et al., Reference Bosq, Wijermars and Lubkowski2020). The epicentres of 38 events are located close to cavern HL-C or between HL-C and HL-M. The epicentres of six events are located near HL-H. HL-F and HL-L both are associated with a single event. Bosq et al. (Reference Bosq, Wijermars and Lubkowski2020) identified most events as shear events, based on characteristic P-wave arrivals (frequency < 100 Hz) followed by S-wave arrivals (frequency < 50 Hz). However, without moment tensor inversion the presence of an isotropic component in the source mechanism cannot be excluded. According to Bosq et al. (Reference Bosq, Wijermars and Lubkowski2020), four of the events showed the characteristics of ‘rock-fall’ events: low (frequency < 20 Hz) and mono-frequency P- and S-waves accompanied by clear resonance waves.
The events associated with HL-H, HL-L and HL-F were all located at the depth of the caverns (Fig. 9b). However, the events associated with HL-C were only partly at the depth of the cavern – a significant number of events was located at the depth of the salt-overburden interface. The events located at the depth of the caverns were likely related to the natural closure of the salt caverns, inducing shear and ‘rock-fall’ events of moderate energy (Bosq et al., Reference Bosq, Wijermars and Lubkowski2020). The events at the crest of the salt dome could be related to the upward movement of the salt dome generating extensive stresses in the crest and layers above and shear fractures in the cap-rock of the salt dome (Jackson & Galloway, Reference Jackson and Galloway1984). However, the particular focus of the events near HL-C is striking and warrants further investigation.
Post-mining water -ingress
In the south of the province of Limburg, coal was mined up to 1974 (De Vent, Reference De Vent2016). During the mining period, the natural groundwater table was lowered in order to ensure the mine workings would not flood. After the abandonment of the mines, significant ground heave and multiple swarms of seismic events were observed (Figs. 1 and 10) particularly in the vicinity of Voerendaal. These swarms showed correlation with mine water rise after termination of the pumping, first in the Netherlands and currently across the border in Germany (Projectgroup GS-ZL, 2016; Sigaran-Loria and Slob, Reference Sigaran-Loria and Slob2019; Hinzen et al., Reference Hinzen, Reamer and Fleischer2020), which also produces heterogeneous surface displacements detected by satellite radar interferometry (Caro Cuenca et al., Reference Caro Cuenca, Hooper and Hanssen2013). During the mining period, only two shallow earthquakes were recorded in the area: an ML 3.1 event at a depth of 5 km on 4 March 1930, near Voerendaal and an ML 2.1 earthquake at 2.1 km depth near Klimmen on 15 November 1971.
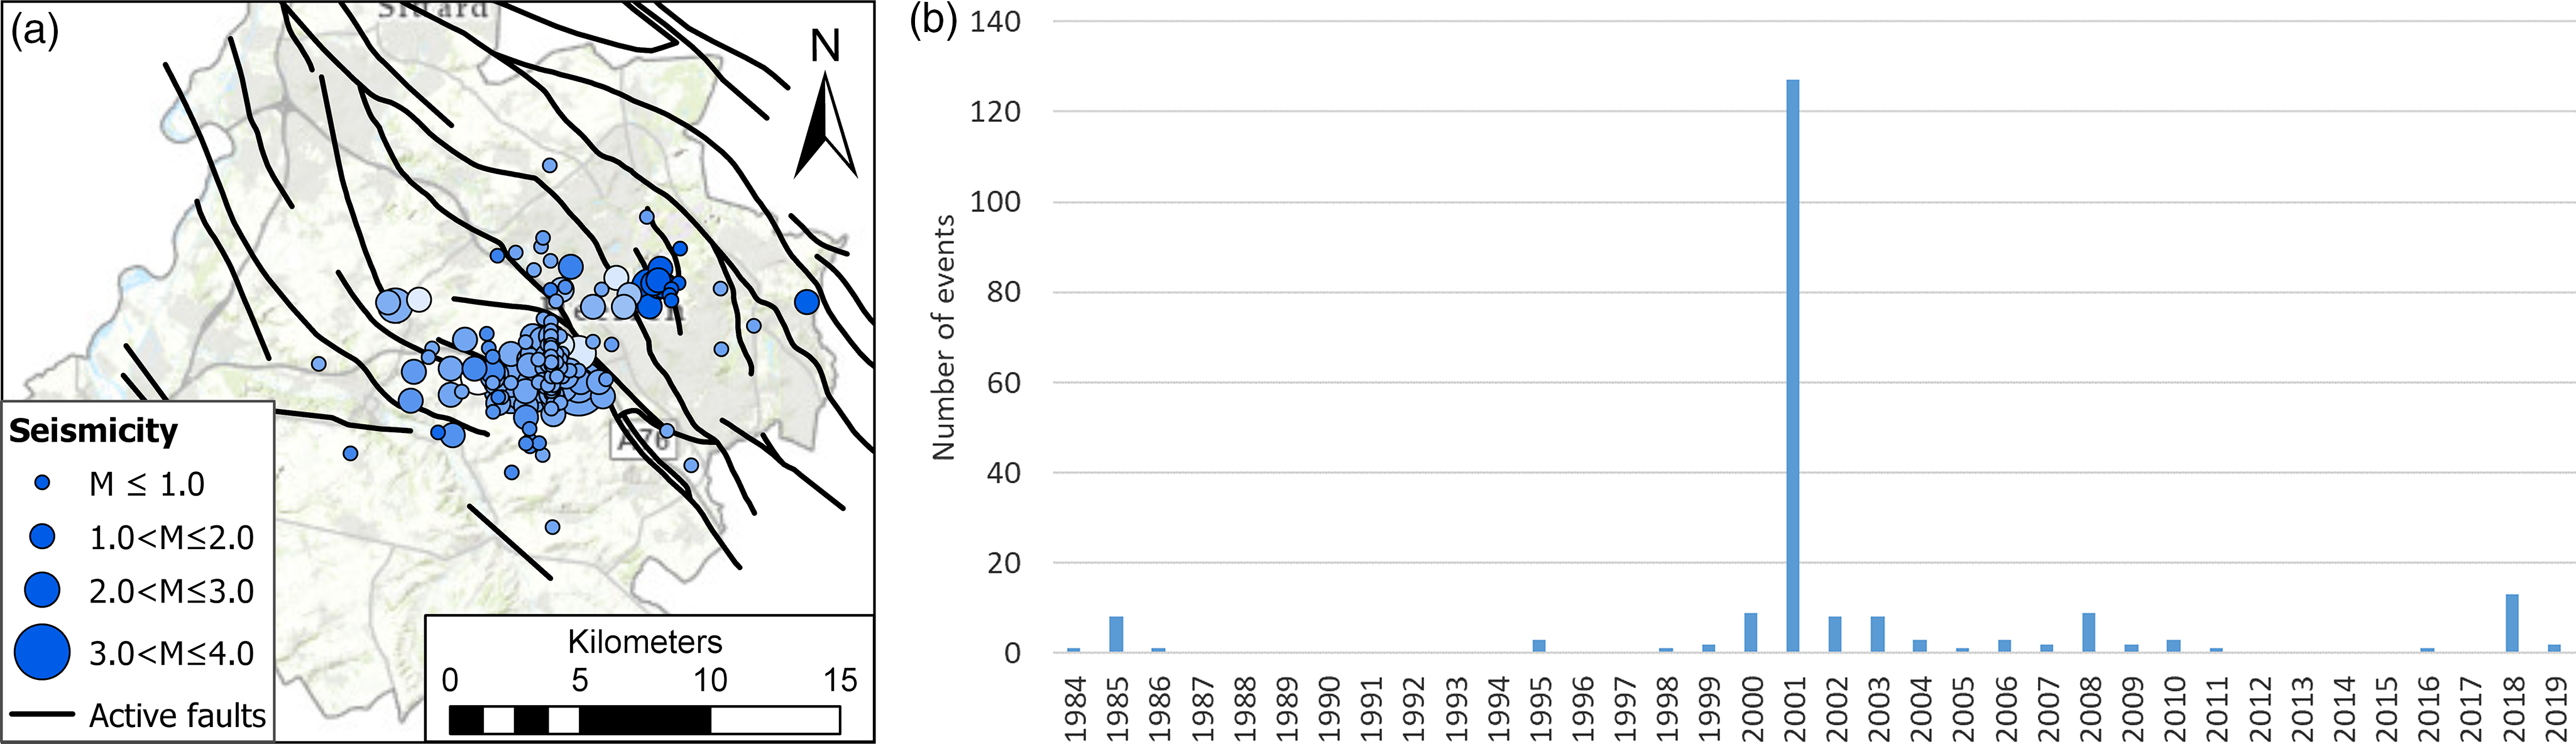
Fig. 10. (A) Shallow (depth <10 km) seismicity in the former coal mining region of southern Limburg; most probably induced by post-mining water ingress. The colour coding of the seismicity indicates the temporal evolution of the seismicity: light blue – early events; dark blue – events later in time. The black lines indicate potentially tectonically active faults (www.nlog.nl). (B) Temporal evolution of the seismicity in the former coal mining region of southern Limburg most probably induced by post-mining water ingress.
The removal of rock in mines brings nearby faults closer to failure by decreasing the confining stress. Simultaneously, the pumping of groundwater to keep the mines dry lowers the pore pressure. This increases the strength of faults and counteracts the effect of rock removal. However, after a mine is abandoned and pumping stopped, natural groundwater recharge may induce seismicity. An increase of water pressure along the stressed faults will reduce the normal stress, and thus, the friction along the fault and this could induce fault movement, resulting in an earthquake. Another mechanism may be the increase in mass due to the rising groundwater. This increase in mass could be an additional driving force of fault movement and thus the development of seismicity.
In Limburg, the water table was lowered by as much as 600 to 800 m. Since the early 1970s, the water table has been rising again. Between 7 December 1985 and 7 January 1986, a total of nine earthquakes (ML 1.4–3.0) were registered in the Voerendaal area. The events’ hypocentres were located between 2.3 and 8.1 km depth. In 2001 and 2002, a total of 144 earthquakes with magnitudes up to ML 3.9 were observed. All events occurred at depths less than 10 km.
These two swarms have been investigated on behalf of the Dutch Ministry of Economic Affairs and Climate (Projectgroup GS-ZL, 2016). The study concluded that, theoretically, the post-mining ingress of water could explain the occurrence of the two swarms and the events in the swarms should be classified as ‘induced events’.
In the period 20 February 2006 to 21 September 2008, four smaller sequences of events were observed. The sequences commenced with two events (ML 0.8 and ML 1.9) near Voerendaal in February 2006 followed by an event near Heerlen (ML 0.8) in July 2007, an ML 0.9 event near Klimmen in September 2007, two events (ML 0.6 and ML 1.1) again near Klimmen in July 2008, and seven ML 0.1–1.9 events near Voerendaal in September 2008. All events occurred at depths of 3–10 km. Between 23 July and 8 August 2018, a swarm of eleven small earthquakes with magnitudes 0.5 ≤ ML ≤ 2.4 and a hypocentral depth of 5–9 km occurred near Heerlen, just north of Voerendaal.
Overall, 208 shallow events (−0.1 ≤ ML ≤ 3.9) were observed in the mining area from 1985 till now, which most likely were associated with post-mining water ingress (Fig. 10).
Other possible cases of induced seismicity
In addition to the previously discussed cases, we identified three more cases of presumably induced seismicity for which the causal relation to an operation is much less obvious. However, for completeness we briefly discuss these observations.
On 26 November 2009, an earthquake occurred in south-western Friesland at an approximate depth of 2 km and of magnitude ML 2.8 (no. 10 in Fig. 1). The event was recorded with the KNMI network and the epicentre location uncertainty of the event was ∼2 km. The nearest gas field to this event is the De Hoeve field (∼250 m). However, at the time of the event, the De Hoeve gas field was only a prospect just confirmed by the exploration well DHV-01. No gas production had occurred yet at all. The closest active mining operation at the time of the event was in the nearby gas field Weststellingwerf (∼1–1.5 km to the north; Bois et al., Reference Bois, Mohajerani, Dousi and Harms2013; Carpenter, Reference Carpenter2014). Between 2008 and 2012, this depleted gas field was used for the disposal of production water from surrounding gas fields. A total water volume of 85,000 Nm3 was injected of which 42,825 Nm3 (at an injection rate of 50 Nm3/day) at the time of the event. Research on behalf of the operator showed that the cause of the event should be attributed to a loss of fault friction due to fault lubrication or to a decrease in capillary pressure within the fault upon first contact with water instead of stress variations along the fault (SGS Horizon, 2012; Bois et al., Reference Bois, Mohajerani, Dousi and Harms2013; Carpenter, Reference Carpenter2014).
In 2013, six earthquakes with magnitudes 1.4 ≤ ML ≤ 2.5 occurred just off the coast of the province of Noord-Holland near the town of Castricum (no. 9 in Fig. 1). The events’ epicentres are located in the direct vicinity of the Castricum Sea gas field (Fig. 11). This gas field produced for only four years between 2000 and 2004. Since 2004, no operational activity in the field has taken place. As the events cannot, within their location uncertainties, be associated with any other gas fields or subsurface operations, the cause of these events remains unclear to date.
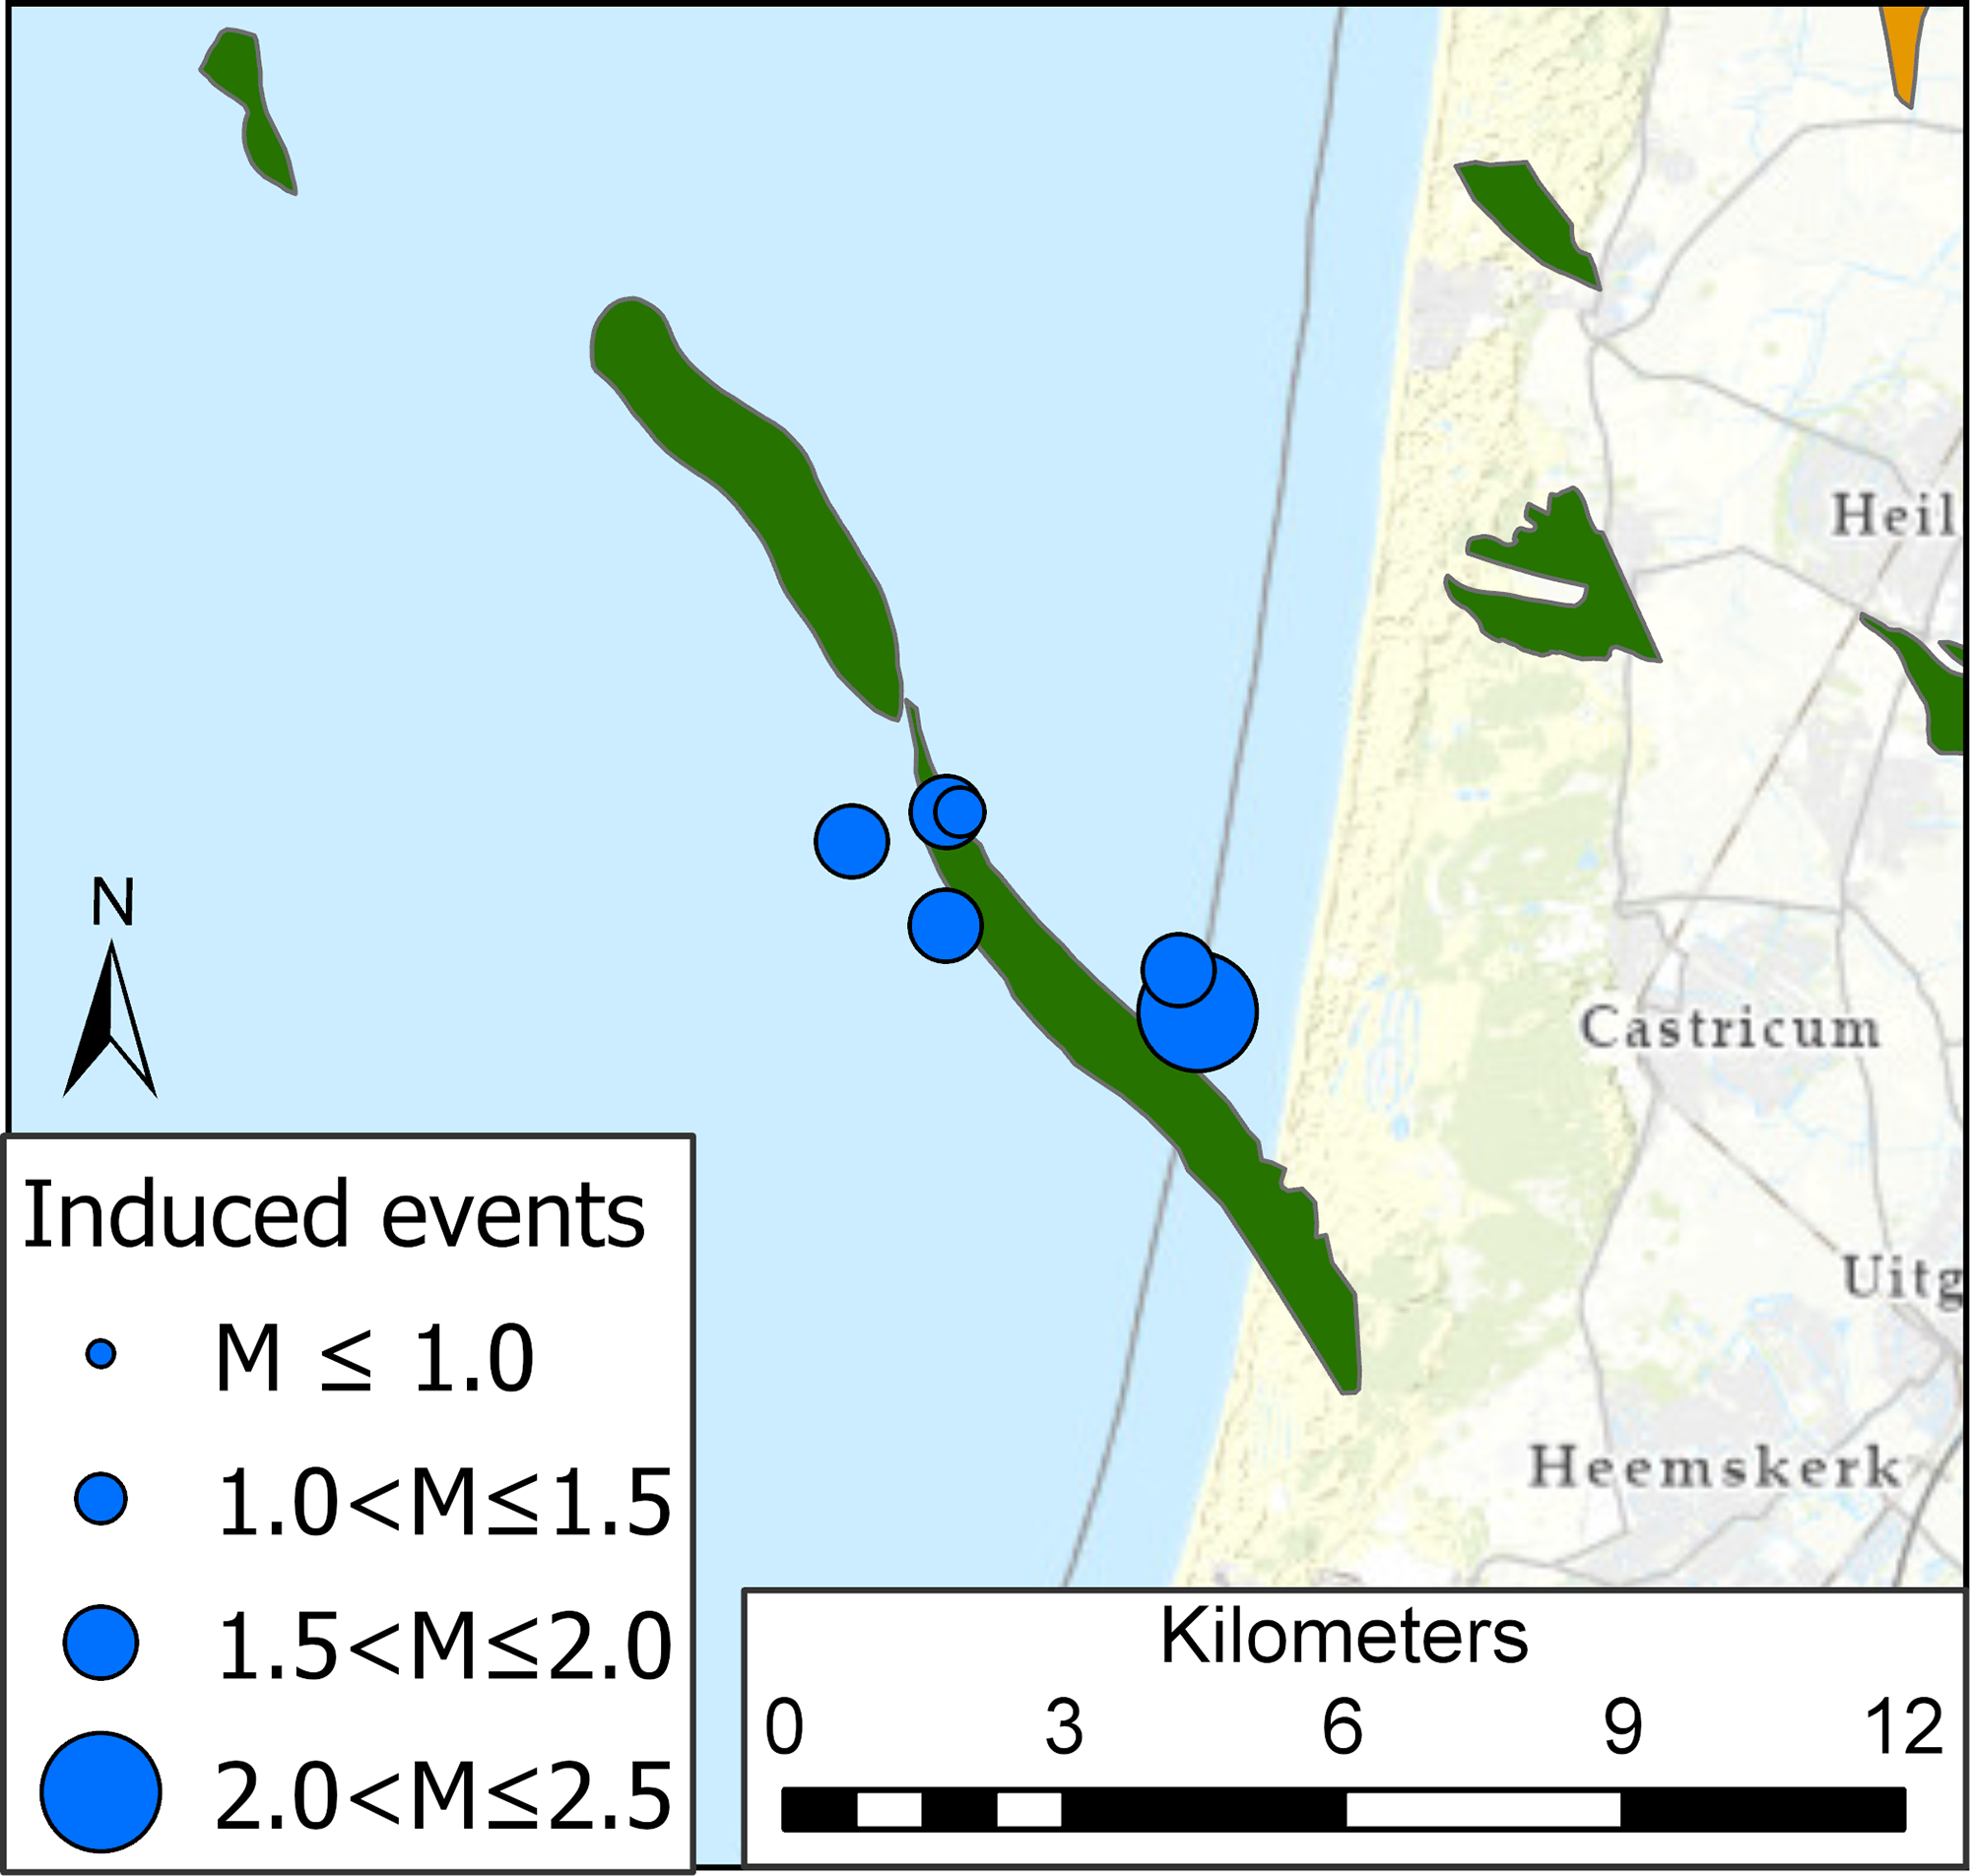
Fig. 11. Epicentre map of the events in 2013 at the former Castricum Sea gas field. The scale of the seismicity indicates the local magnitude.
Between 22 February and 22 March 2009, a swarm of small events was detected near the town of Midlaren, south-west of the Groningen gas field (no. 11 in Fig. 1). A total of 41 earthquakes were recorded, with magnitudes ranging from ML 0.2 to ML 1.4 (Fig. 12). At the time of the swarm, the operator NAM was drilling a new well (HGZ-01) 4–5 km east of the swarm location. During drilling of the well, an unexpected loss zone was encountered on 21 February 2009 (NAM, 2009). The loss zone aligned with the east-west trace of the fault on which the Midlaren seismic swarms were detected (Fig. 12; Dost et al., Reference Dost, Goutbeek, van Eck and Kraaijpoel2012). Provided the correlation in time with the drilling losses and the clear possible spatial connection, we categorise these events as induced by mud losses during drilling.

Fig. 12. Epicentre map of the Midlaren events and the location of the well HGZ-01 operator NAM was drilling at the time of the events. The grey lines indicate the faults as mapped by the operator (De Jager and Visser, Reference De Jager and Visser2017). The colour coding and scale of the seismicity indicates the local magnitude.
Discussion and Conclusions
Uncertainties
A categorisation of induced seismicity is, of course, surrounded by substantial uncertainty. Our approach has been cautious, and every effort has been made to ensure a correct categorisation. However, we used an interpretive approach which is hampered by epicentre location uncertainties, fixed depth attribution in the KNMI induced seismicity catalogue and lack of information on subsurface operations.
Due to the location uncertainties of the earthquakes, onshore events could unambiguously be attributed to only 18 gas fields. Considering the location uncertainties of the seismic events, an additional 20 gas fields could be associated with induced seismicity, although this number could also be less as events attributed to certain fields could just as likely be induced by neighbouring fields (Qcon GmbH, 2018).
The categorisation of the events in southern Limburg as induced by post-mining water ingress was predominantly driven by the hypocentre depth reported in the KNMI tectonic catalogue and the outline of the old mining area. Clearly, this categorisation is highly uncertain and surely individual events may have been either missed or incorrectly labelled as induced.
For the seismic events recorded on the local, operation-specific monitoring networks, the location uncertainties in the hypocentres are relatively small. Therefore, the categorisation for these events is less ambiguous.
Besides the six curious events that occur near the Castricum Sea field discussed in the previous section, the categorisation for eight additional events remains unresolved (Fig. 13). Based on our criteria and taking into account uncertainties, these events in the KNMI induced seismicity catalogue could not be attributed to a subsurface operation. Three events were located in between the Groningen gas field in the east and small gas fields in the west. It is known that subsidence due to pressure depletion in the large aquifer in the Rotliegend, which is connected to both Groningen and the small fields, is occurring in this area (NAM, Reference NAM2020). Hence, it is feasible that these events were induced by this depletion as well. This would render these events induced, but not directly connected to an individual gas field. For the other five events, a tectonic nature could not be excluded.

Fig. 13. Overview of the epicentre locations of the events classified as ‘undefined’ in our categorisation (indicated by magenta circles). The natural seismicity is indicated in grey circles, induced seismicity as recorded by the national KNMI network in blue circles (www.knmi.nl, August 10, 2020). The dark grey lines indicate potentially tectonically active faults; the light grey lines indicate faults in the Permian formations (www.nlog.nl). Gas and oil fields are denoted in dark green and red, respectively; the UGS gas fields in orange (www.nlog.nl).
Why are earthquakes induced by some projects and not by others?
Even though induced seismicity was observed for a number of subsurface operations, overall reports of induced seismicity are extraordinarily rare. World-wide less than 2% of the projects have been reported as seismogenic (Foulger et al., Reference Foulger, Wilson, Gluyas, Julian and Davies2018). In the Netherlands, our analysis associated 38 out of 180 onshore gas fields (∼21%) and 3 out of 24 operational geothermal doublets with seismicity (12.5%). The difference with the world-wide reporting is most likely due to the stringent monitoring requirements in the Netherlands.
Monitoring of seismicity is by law the responsibility of the operator, but mostly conducted by the KNMI in a nationwide network. For induced seismicity, however, this network is developed in quite an irregular and inconsistent way, driven by local requirements for different operators and industries. Consequently, the network’s detection and location capabilities have been, and still are, highly variable. This significantly hampers the identification of the full extent of seismicity, which is a prerequisite for explaining the (non)occurrence of induced seismicity.
The most common earthquake source process is shear slip on a fault plane. This slip may be accompanied by crack-opening or closing. The shear stress τ required for failure is described by Coulomb theory:
τ = c + μ(σ n −P),
where c is the cohesion, μ the coefficient of friction, σ n the normal stress on the fault and P the pore pressure in the fault zone. Slip on a fault occurs when the shear stress or pore pressure in the fault zone are increased or the cohesion or normal stress reduced.
Anthropogenic operations which may result in slip on a fault are for instance direct injection of fluid in a fault zone influencing the pore pressure within the zone (e.g. Healy et al., Reference Healy, Rubey, Griggs and Rayleigh1968; Obermann et al., Reference Obermann, Kraft, Larose and Wiemer2015), the injection of cold water in a reservoir inducing contraction, which may lower the normal stress on nearby fault zones (e.g. Parisio et al., Reference Parisio, Vilarrasa, Wang, Kolditz and Nagel2019), poro-elastic deformation of the reservoir rock in response to both injection and production of fluids leading to changes in both the horizontal and vertical effective stresses (Nagelhout and Roest, Reference Nagelhout and Roest1997) and pore pressure diffusion (e.g. Peterie et al., Reference Peterie, Intfen, J. and Gonzales2018; Zhai et al., Reference Zhai, Shirzaei, Manga and Chen2019).
However, the onset of slip does not necessarily coincide with the onset of an earthquake. An important aspect for the occurrence of an earthquake after the onset of slip on a fault is the subsequent loss of frictional strength (e.g. Scholz, Reference Scholz1998, Reference Scholz2002). This implies that additional shear stress is required after the onset of slip and prior to the nucleation of an earthquake.
Thus, the factors governing the onset of an earthquake due to subsurface operations are as follows:
-
the initial compressive normal stress acting on the fault zone;
-
the initial shear stress on the fault or fracture;
-
the initial pore pressure within the fault or fracture;
-
the imposed change in compressive normal stress on the fault or fracture;
-
the imposed change in shear stress on the fault or fracture;
-
the imposed change in pore pressure within the fault or fracture;
-
the cohesion of the fault or fracture;
-
the coefficient of friction of the fault or fracture;
-
the loss of frictional strength after the onset of slip.
The initial subsurface stresses and fault characteristics are intrinsic properties of the formations and subsurface and not influenced by operational parameters. In addition, the changes in stresses on the pre-existing faults and fractures are caused by the change in pore pressure as a result of injection/production, which in itself depends on the Young modulus, Poisson ratio, porosity and permeability of the formation and the over-/under-burden (e.g. Dake, Reference Dake1983; Jansen et al., Reference Jansen, Singhal and Vossepoel2019). For example, the review of Buijze et al. (Reference Buijze, van Bijsterveldt, Cremer, Paap, Veldkamp, Wassing, van Wees, van Yperen and ter Heege2019) found that in none of the assessed cases circulation of fluids in shallow, porous, sedimentary aquifers was associated with seismicity exceeding magnitude 2.0. In contrast, they found that geothermal operations in competent, tight fractured rocks are more prone to induced seismicity and earthquakes with magnitudes of M > 5.0 were observed (Buijze et al., Reference Buijze, van Bijsterveldt, Cremer, Paap, Veldkamp, Wassing, van Wees, van Yperen and ter Heege2019). Hence, detailed, site-specific geological information is essential to understand the underlying characteristics and processes. Unfortunately, such information is lacking in many cases.
Can we govern the seismic risk?
The number of reported cases as well as types of subsurface projects inducing seismicity has increased substantially in the Netherlands over the past years. Both the increasing number and diversity of subsurface projects, as well as the reduction of the magnitude threshold, contributed to the increase in observed events. The installation of several dedicated local monitoring arrays enabled the detection of seismicity of small magnitudes (ML < 1.5), providing important information on the seismogenesis within the Dutch subsurface.
At the same time, the use of the Dutch subsurface will only increase further over the decades to come. For example, to offset CO2 emissions due to heat demand, the Dutch government has the goal to have 15 petajoule of geothermal energy in operation before 2030 and 200 petajoule before 2050 (i.e. an increase from 17 doublets in 2018 to an estimated 700 in 2050; Rijksoverheid, 2019; Stichting Platform Geothermie et al., 2018). High-enthalpy systems, so-called ultra-deep geothermal systems (UDG), are seen as critical for the success of the Dutch energy transition. At the same time, ultra-deep systems rely on pre-existing fault zones and the presence of fractures (secondary porosity) to stimulate permeability by shearing (Goldscheider et al., Reference Goldscheider, Mádl-Szőnyi, Erőss and Schill2010). Consequently, the probability of reactivation of pre-existing faults, and thus induced seismicity, is increased for such systems. Together with the very low public acceptance of damage and risks associated with induced seismicity, there is a growing need to govern the posed risk.
There is presently no reliable method for predicting the occurrence of induced earthquakes. Current approaches comprise short-term forecasting based on patterns and rates of recent seismicity in combination with a truncated Gutenberg-Richter magnitude-frequency distribution (Dost et al., Reference Dost, Caccavale, Van Eck and Kraaijpoel2013; Dost and Spetzler, Reference Dost and Spetzler2015; Petersen et al., Reference Petersen, Mueller, Moschetti, Hoover, Llenos, Ellsworth, Michael, Rubinstein, McGarr and Rukstales2016, Reference Petersen, Mueller, Moschetti, Hoover, Shumway, McNamara, Williams, Llenos, Ellsworth, Michael, Rubinstein, McGarr and Rukstales2017, Reference Petersen, Mueller, Moschetti, Hoover, Rukstales, McNamara, Williams, Shumway, Powers, Earle, Llenos, Michael, Rubinstein, Norbeck and Cochran2018; Van Eck et al., Reference Van Eck, Goutbeek, Haak and Dost2006). For the Groningen gas field, a hybrid physics-based statistical model was developed, that can estimate the change in seismicity due to production or injection variations (Bourne et al., Reference Bourne, Oates, Bommer, Dost, van Elk and Doornhof2015; Van Elk et al., Reference Van Elk, Bourne, Oates, Bommer, Pinho and Crowley2019). This model uses first-order physical constraints and adds stochastic elements to efficiently represent aleatory uncertainties. However, in regions with little to no historic or prior induced seismicity both methods are impossible to implement.
Purely physics-based models use the knowledge on frictional properties, pore pressure evolution, poro-elastic effects, Coulomb stress interactions, etc., to build numerical models of earthquake genesis and interactions (e.g. Van den Bogert, Reference Van den Bogert2015, Reference Van den Bogert2018; Buijze et al., Reference Buijze, Van den Bogert, Wassing, Orlic and Ten Veen2017; Van Wees et al., Reference Van Wees, Fokker, Van Thienen-Visser, Wassing, Osinga, Orlic, Ghouri, Buijze and Pluymaekers2017). Although seismicity is generally controlled by operational pressure changes in the reservoir, other mechanisms are important, such as static stress transfers between neighbouring asperities, or temperature effects (Jeanne et al., Reference Jeanne, Rutqvist, Dobson, Walters, Hartline and Garcia2014). The incorporation of these processes is still in its early stages, further hampering our ability to predict the occurrence of induced events.
The assessment of seismic hazard is further hampered by a lack of knowledge on the in situ conditions. Given these uncertainties in knowledge and in data, it is critical to consider uncertainties in structured ways, using probabilistic rather than deterministic approaches. Probabilistic approaches can easily incorporate all model results derived from existing knowledge, express and consider uncertainties in a formal way, and integrate advances in both knowledge and data as they become available. Several probabilistic seismic hazard assessments for regions with recorded induced seismicity have been made (Bourne et al., Reference Bourne, Oates, Bommer, Dost, van Elk and Doornhof2015; Dost et al., Reference Dost, Caccavale, Van Eck and Kraaijpoel2013; Dost and Spetzler, Reference Dost and Spetzler2015; Petersen et al., Reference Petersen, Mueller, Moschetti, Hoover, Llenos, Ellsworth, Michael, Rubinstein, McGarr and Rukstales2016, Reference Petersen, Mueller, Moschetti, Hoover, Shumway, McNamara, Williams, Llenos, Ellsworth, Michael, Rubinstein, McGarr and Rukstales2017, Reference Petersen, Mueller, Moschetti, Hoover, Rukstales, McNamara, Williams, Shumway, Powers, Earle, Llenos, Michael, Rubinstein, Norbeck and Cochran2018; Van Eck et al., Reference Van Eck, Goutbeek, Haak and Dost2006; Van Elk et al., Reference Van Elk, Bourne, Oates, Bommer, Pinho and Crowley2019). They provide a well-established structured, quantitative analysis and integrate uncertainties in a formal way.
Governance protocols are living documents intended to be updated as knowledge and experience are gained. The majority of the governance protocols consist of 1) a preliminary screening intended to obtain a first indication of the risk level and identify factors which immediately disqualify a site, 2) site- and screening-risk-level-specific seismic hazard and risk assessment, 3) monitoring requirements, 4) risk-based mitigation strategy, and 5) a communication plan with a public and stakeholder engagement programme (e.g. Baisch et al., Reference Baisch, Koch, Stang, Pittens, Drijver and Buik2016; Bommer et al., Reference Bommer, Crowley and Pinho2015; Majer et al., Reference Majer, Nelson, Robertson-Tait, Savy and Wong2012; Muntendam-Bos et al., Reference Muntendam-Bos, Roest and De Waal2015; SodM, 2016; Walters et al., Reference Walters, Zoback, Baker and Beroza2015; Wiemer et al., Reference Wiemer, Kraft, Trutnevyte and Roth2017).
The most commonly imposed risk mitigation strategy is the so-called ‘traffic light systems’ (TLS), where an operator reduces, pauses or stops injection if the magnitude of the largest event exceeds a specified threshold. The TLS was first developed by Bommer et al. (Reference Bommer, Oates, Cepeda, Lindholm, Bird, Torres, Marroquín and Rivas2006) for an enhanced geothermal project in El Salvador. The main advantage of the system is its conceptual simplicity making it relatively easy to explain to stakeholders and the general public. TLSs are based on several decision variables and an associated action plan. Typical observable decision variables are magnitude, peak ground velocity or peak ground acceleration, and the rate of events above a certain magnitude.
TLS systems are based on four tacit assumptions (Baisch et al., Reference Baisch, Koch and Muntendam-Bos2019; Verdon and Bommer, Reference Verdon and Bommer2020): 1) during operations, the maximum observed magnitude slowly increases; 2) precursory, small events precede an event exceeding a critical strength; 3) a causal relation with the operation exists; 4) the time for a measure to become effective is sufficiently small, so escalation can be prevented. For an extensive discussion of the TLS as a risk mitigation tool, we refer to Verdon and Bommer (Reference Verdon and Bommer2020).
The success of the TLS critically depends on the choice of the red-light magnitude threshold. These threshold values vary significantly between different jurisdictions (Bosman et al., Reference Bosman, Baig, Viegas and Urbancic2016; Baisch et al., Reference Baisch, Koch and Muntendam-Bos2019). For instance, the red-light threshold for fracking-induced seismicity in the United Kingdom (UK) is set at M 0.5, whereas in Alberta (Canada) it is set at M 4.0. Threshold values are generally determined by expert judgement or are based on a forecast model (Mignan et al., Reference Mignan, Broccardo, Wiemer and Giardini2017). More advanced approaches to determine risk-based threshold values are being developed. For instance, Schultz et al. (Reference Schultz, Beroza, Ellsworth and Baker2020) proposed a probabilistic risk assessment approach to determine threshold values based on the probability of nuisance and damage.
The challenge for setting the threshold values is that in a number of cases an increase in event magnitude post-injection is observed (e.g. Häring et al., Reference Häring, Schanz, Ladner and Dyer2008; Clarke et al., Reference Clarke, Eisner, Styles and Turner2014; Verdon and Bommer, Reference Verdon and Bommer2020). Verdon and Bommer (Reference Verdon and Bommer2020) assessed 35 cases of hydraulic fracturing-induced seismicity. They found that in the majority of the cases the magnitude increase was gradual with magnitude jumps less than two magnitude points. A quarter of the cases showed a post-injection magnitude increase, of which the largest was 1.6 magnitude points and limited in time to a couple of days after shut-in. They concluded that in the case of hydraulic fracturing-induced seismicity a TLS could be effective, but red-light thresholds should be set as much as two magnitude points below the magnitude of the events it is trying to avoid. As a consequence, operations may be stopped at seismicity levels well below the level which is considered hazardous.
The effectiveness of traditional TLSs can be improved by taking into consideration the full range of possible scenarios, the uncertainty of the process and by real-time actualisation of the threshold values based on monitoring of (very) low magnitude events (Mignan et al., Reference Mignan, Landtwing, Kastli, Mena and Wiemer2015, Reference Mignan, Broccardo, Wiemer and Giardini2017; Broccardo et al., Reference Broccardo, Mignan, Wiemer, Stojadinovic and Giardini2017; Clarke et al., Reference Clarke, Eisner, Styles and Turner2014, Kwiatek et al., Reference Kwiatek, Saamo, Ader, Bluemle, Bohnhoff, Chendorain, Dresen, Heikkinen, Kukkonen, Leary, Leonhardt, Malin, Martinez-Garzon, Passmore, Passmore, Valenzuela and Wollin2019). Mignan et al. (Reference Mignan, Broccardo, Wiemer and Giardini2017) proposed an adaptive Traffic Light Scheme (ATLS) based on probabilistic seismicity, hazard and risk forecasts from which risk-based decisions can be made. The decision variable is subsequently updated as new data comes in. The ATLS approach was extended by Broccardo et al. (Reference Broccardo, Mignan, Wiemer, Stojadinovic and Giardini2017) by including a Bayesian framework to allow the estimation of key parameters.
The effectiveness of the TLS also depends significantly on the subsurface operation it is applied to. For gas extraction-induced seismicity, Baisch et al. (Reference Baisch, Koch and Muntendam-Bos2019) showed that a TLS will be less effective as a mitigating measure. This is due to two prime reasons. First, at some gas fields in the Netherlands relatively large events (ML ∼2.5-3.0) have been recorded without detectable precursors. In fact, our case overview (supplement 2) shows that in a third of the 25 seismically active gas fields with multiple events the first event had the largest magnitude. Second, a correlation between the rate of gas production and seismic activity could only be observed for the Groningen gas field (Muntendam-Bos & De Waal, Reference Muntendam-Bos and De Waal2013; Baisch et al., Reference Baisch, Koch and Muntendam-Bos2019). For the small gas fields, no clear indication of a correlation was observed (Baisch et al., Reference Baisch, Koch and Muntendam-Bos2019) and termination of production is probably the only feasible operational measure.
The risk-based approaches allow regulators to balance the consequences of an operation more effectively and promotes more transparent communication of risk to all stakeholders involved. However, these approaches only allow the minimisation of the probability of an unwanted event. The occurrence of this unwanted event is not excluded and both operators and regulators should be prepared to act in case it does take place (e.g. Basel (CH), 2006; St. Gallen (CH), 2013; Pohang (South Korea), 2017; geothermal project California (NL), 2018; Blackpool (UK), 2019).
Data and monitoring recommendations
Essential for appropriate risk governance is high-quality information. Gathering high-resolution geological information (e.g. 3D seismic imaging surveys, lithologies, well-log data, pressure data), necessary to adequately assess the seismic hazard and risk, should be standard practice for every subsurface operation. Preferably, local in situ stress information is derived from full well density-logs (magnitude of the vertical stress), well-breakout data taken from a caliper- or image-log (orientation of horizontal stress and magnitude of the maximum horizontal stress), and a leak-off or mini-frac test (magnitude of the minimum horizontal stress). Here regulators play an important role in stipulating the minimal requirements as well as how to deal with the (remaining) uncertainties.
The presence of an adequate seismic monitoring network and analysis procedures is a second prerequisite. Sites selected for the deployment of seismic monitoring stations should have noise levels as low as possible to allow for optimal detection and location capabilities. Observation wells may be a few hundred metres deep to improve the sensor coupling and reduce surface-related noise, and the holes should be distributed azimuthally around the project at offsets of up to the depth of the intended reservoir. Increased station density in combination with automated processing techniques based on cross-correlation would enable the detection of much more events than traditional phase picking and analysis, in particular in the presence of higher noise levels (Weemstra, Reference Weemstra2019). Monitoring should commence well in advance of the subsurface operation in order to establish the natural baseline for seismic activity.
Finally, monitoring operational data (e.g. well head pressure, injection as well as production rates and volumes, reservoir temperature) is essential for establishing the site-specific relation between the subsurface operation and observed seismicity. Subsequently, an operational strategy to mitigate the risk can be derived and implemented, and update of the seismic hazard and risk assessment conducted. This is a continuous effort as new knowledge and data are gained.
This paper contributes to various ongoing efforts world-wide to obtain a proper overview of all projects that lead to induced seismicity due to anthropogenic operations in the subsurface. A full overview of projects that have and, just as important, have not resulted in induced seismicity is critical for understanding the pertinent physical driving mechanisms and identifying projects that may induce earthquakes in the future.
Supplementary material
To view supplementary material for this article, please visit https://doi.org/10.1017/njg.2021.14
Acknowledgements
We thank Miles P. Wilson, Daniela Kühn, Jesper Spetzler and Savka Dineva for their very constructive comments which were highly appreciated and helped improve this paper. We also gratefully acknowledge KNMI for providing Fig 2, and Qcon, Pieter Wijnen and Lodewijk Burghout for providing Fig 8b and allowing us to include these in this paper. Finally, we thank Nobian B.V. for allowing us to include the epicentres of the events of Heiligerlee and Twente-Rijn in our paper and event database (supplement 1).


 Open access