1 Introduction
Moore’s law states that the number of transistors within an integrated circuit is doubling every two years (Moore Reference Moore1964). This directly translates to more computational power; power that can be used for computational design and simulations. During the past few years, due to this increase in available computational power, aircraft design has been progressively relying on computational design and simulations for providing data for design decision-making and design evolution.
From Computer-Aided Design (CAD), to Computer-Aided Engineering (CAE) such as Computational Fluid Dynamics (CFD) and Finite Element Analysis (FEA), computational methods and processes have allowed for a rapid progress in aerospace design practices (Slotnick et al. Reference Slotnick, Khodadoust, Alonso, Darmofal, Gropp, Lurie and Mavriplis2014). The ability to solve systems of Partial Differential Equations (PDEs) was the key enabler of this advancement; due to the ability to predict performance before physical systems have to be built (Keane and Nair Reference Keane and Nair2005).
The design of an aircraft involves a large number of different interacting systems, disciplines, and functions. The process of designing such a system comprises tightly coupled, loosely coupled and uncoupled sub-processes, making the aircraft a very complex system with a high-dimensional design space.
At present, the challenge is that thorough design-space exploration of such systems, especially during the early, less-constrained, design stages, can be a very complex and computationally expensive process (Langen and Brazier Reference Langen and Brazier2006; McKenney, Kemink and Singer Reference McKenney, Kemink and Singer2011; Nunez et al. Reference Nunez, Datta, Molina-Cristobal, Guenov and Riaz2012). The challenge is further exacerbated due to the need to ensure the feasibility and desirability of the selected design configurations.
This work investigates two major areas that can address that. The first, a set-based design (SBD) approach to identify and evaluate multiple system configurations in parallel while discarding the infeasible, the non-robust, and the undesirable ones. The second concerns Multidisciplinary Design Optimisation (MDO) tools that can fine-tune the engineering characteristics of the system and optimise the performance of it against predefined objectives.
Integration of the above methods will provide the capability for a rapid and efficient exploration of the design space while identifying the optimum configurations. This will assist in speeding up the process to reach the trade studies stage where the configurations can be further evaluated and assessed.
The proposed approach is expected to benefit the design process in both a direct and an indirect way. The direct will be in the case when designing a new product where it will offer a rapid and thorough design-space exploration. The indirect one, is due to the wealth of knowledge that an approach like this will generate, which can then be used in future projects.
In order to demonstrate the benefits and process arising from the integration of the two areas, the Augmented set-based Design and OPTimisation (ADOPT) architectural framework has been developed. Split into two stages, the framework takes into consideration everything from the generation of configurations to their evaluation and assessment, using a set-based workflow with integrated optimisation tools.
The architectural framework has been developed using a process-independent and tool-agnostic approach. This ensures that ADOPT can be adapted and applied to a range of different system design scenarios. The area of aircraft fuel systems will be used as a case study, to demonstrate the process and potential benefits of ADOPT.
2 Literature review
2.1 Set-based design
Engineering design can be described as a process to devise a system in order to satisfy a set of predefined requirements (Ertas and Jones Reference Ertas and Jones1996; Cross Reference Cross2008). The process varies considerably from one approach to the other. Howard, Culley and Dekoninck (Reference Howard, Culley and Dekoninck2008) compared more than twenty different engineering design processes and outlined how they differ in each step. Choosing the appropriate process is a critical factor for a successful design as Khandani (Reference Khandani2005) states. Regardless of the approach used, the process aims to provide a framework that makes the process efficient, clarifies the problem, drives innovation, manages complexity, and promotes collaboration (Holston Reference Holston2011).
The process can be split into two main approaches. The first, the iterative process, which is also known as point-based approach or point-based design. In this case, only one initial design is selected from a pool of candidate solutions. The design is then refined and reworked in an iterative process until the final desirable version emerges. Variations of the point-based approach have been proposed by Pugh (Reference Pugh1991), French (Reference French1998), Ullman (Reference Ullman2002), and Pahl et al. (Reference Pahl, Beitz, Feldhusen and Grote2006), amongst others.
In contrast to the iterative approach, the second one is the convergent approach. In this case, a number of potential solutions are selected, which are then matured and evaluated in parallel. Whereas the iteration in point-based approaches is for redesigning and refining the solution, the iterations in a convergent approach primarily aim to discard undesirable, infeasible, or non-robust solutions. The remaining desirable ones, will then undergo further development. Convergent approaches include the Method of Controlled Convergence (MCC) by Pugh (Reference Pugh1991), the Design-Build-Test (DBT) cycle by Wheelwright (Reference Wheelwright2011), and the SBD (Ward and Liker Reference Ward and Liker1994).
Arising from the Toyota Product Development System (TPDS), set-based design (also referred to as set-based concurrent engineering) allows parallel evaluation of multiple alternative configurations in the early stages of design by using sets of possible solutions (Ward and Liker Reference Ward and Liker1994; Singer, Doerry and Buckley Reference Singer, Doerry and Buckley2009).
The procedure, as described by Sobek, Ward and Liker (Reference Sobek, Ward and Liker1999), starts by mapping the design space and defining the feasible regions while exploring the trade-offs by designing different alternatives. A number of feasible concepts are developed based on sets that are fully functional across all disciplines and looks for possible intersections between those feasible sets. Finally, the sets are narrowed down and increase the detail of the designs; given that the narrowing down is done consensually amongst multidisciplinary teams, therefore creating commitment from each of the disciplines.
When dealing with physical systems that have discrete design parameters (i.e. subsystem options or components), generating the configurations is straight forward. The first step is to identify the design parameters of the system and tabulate their respective possible options. Different combinations of options generate a set of competing configurations. The configurations are then evaluated against predefined performance metrics, and the non-robust or undesirable ones are discarded; the rational for discarding is recorded as information for future use. The remaining configurations are then matured, and the evaluation process is repeated until the desirable configurations emerge. Figure 1 shows the outline of the process.
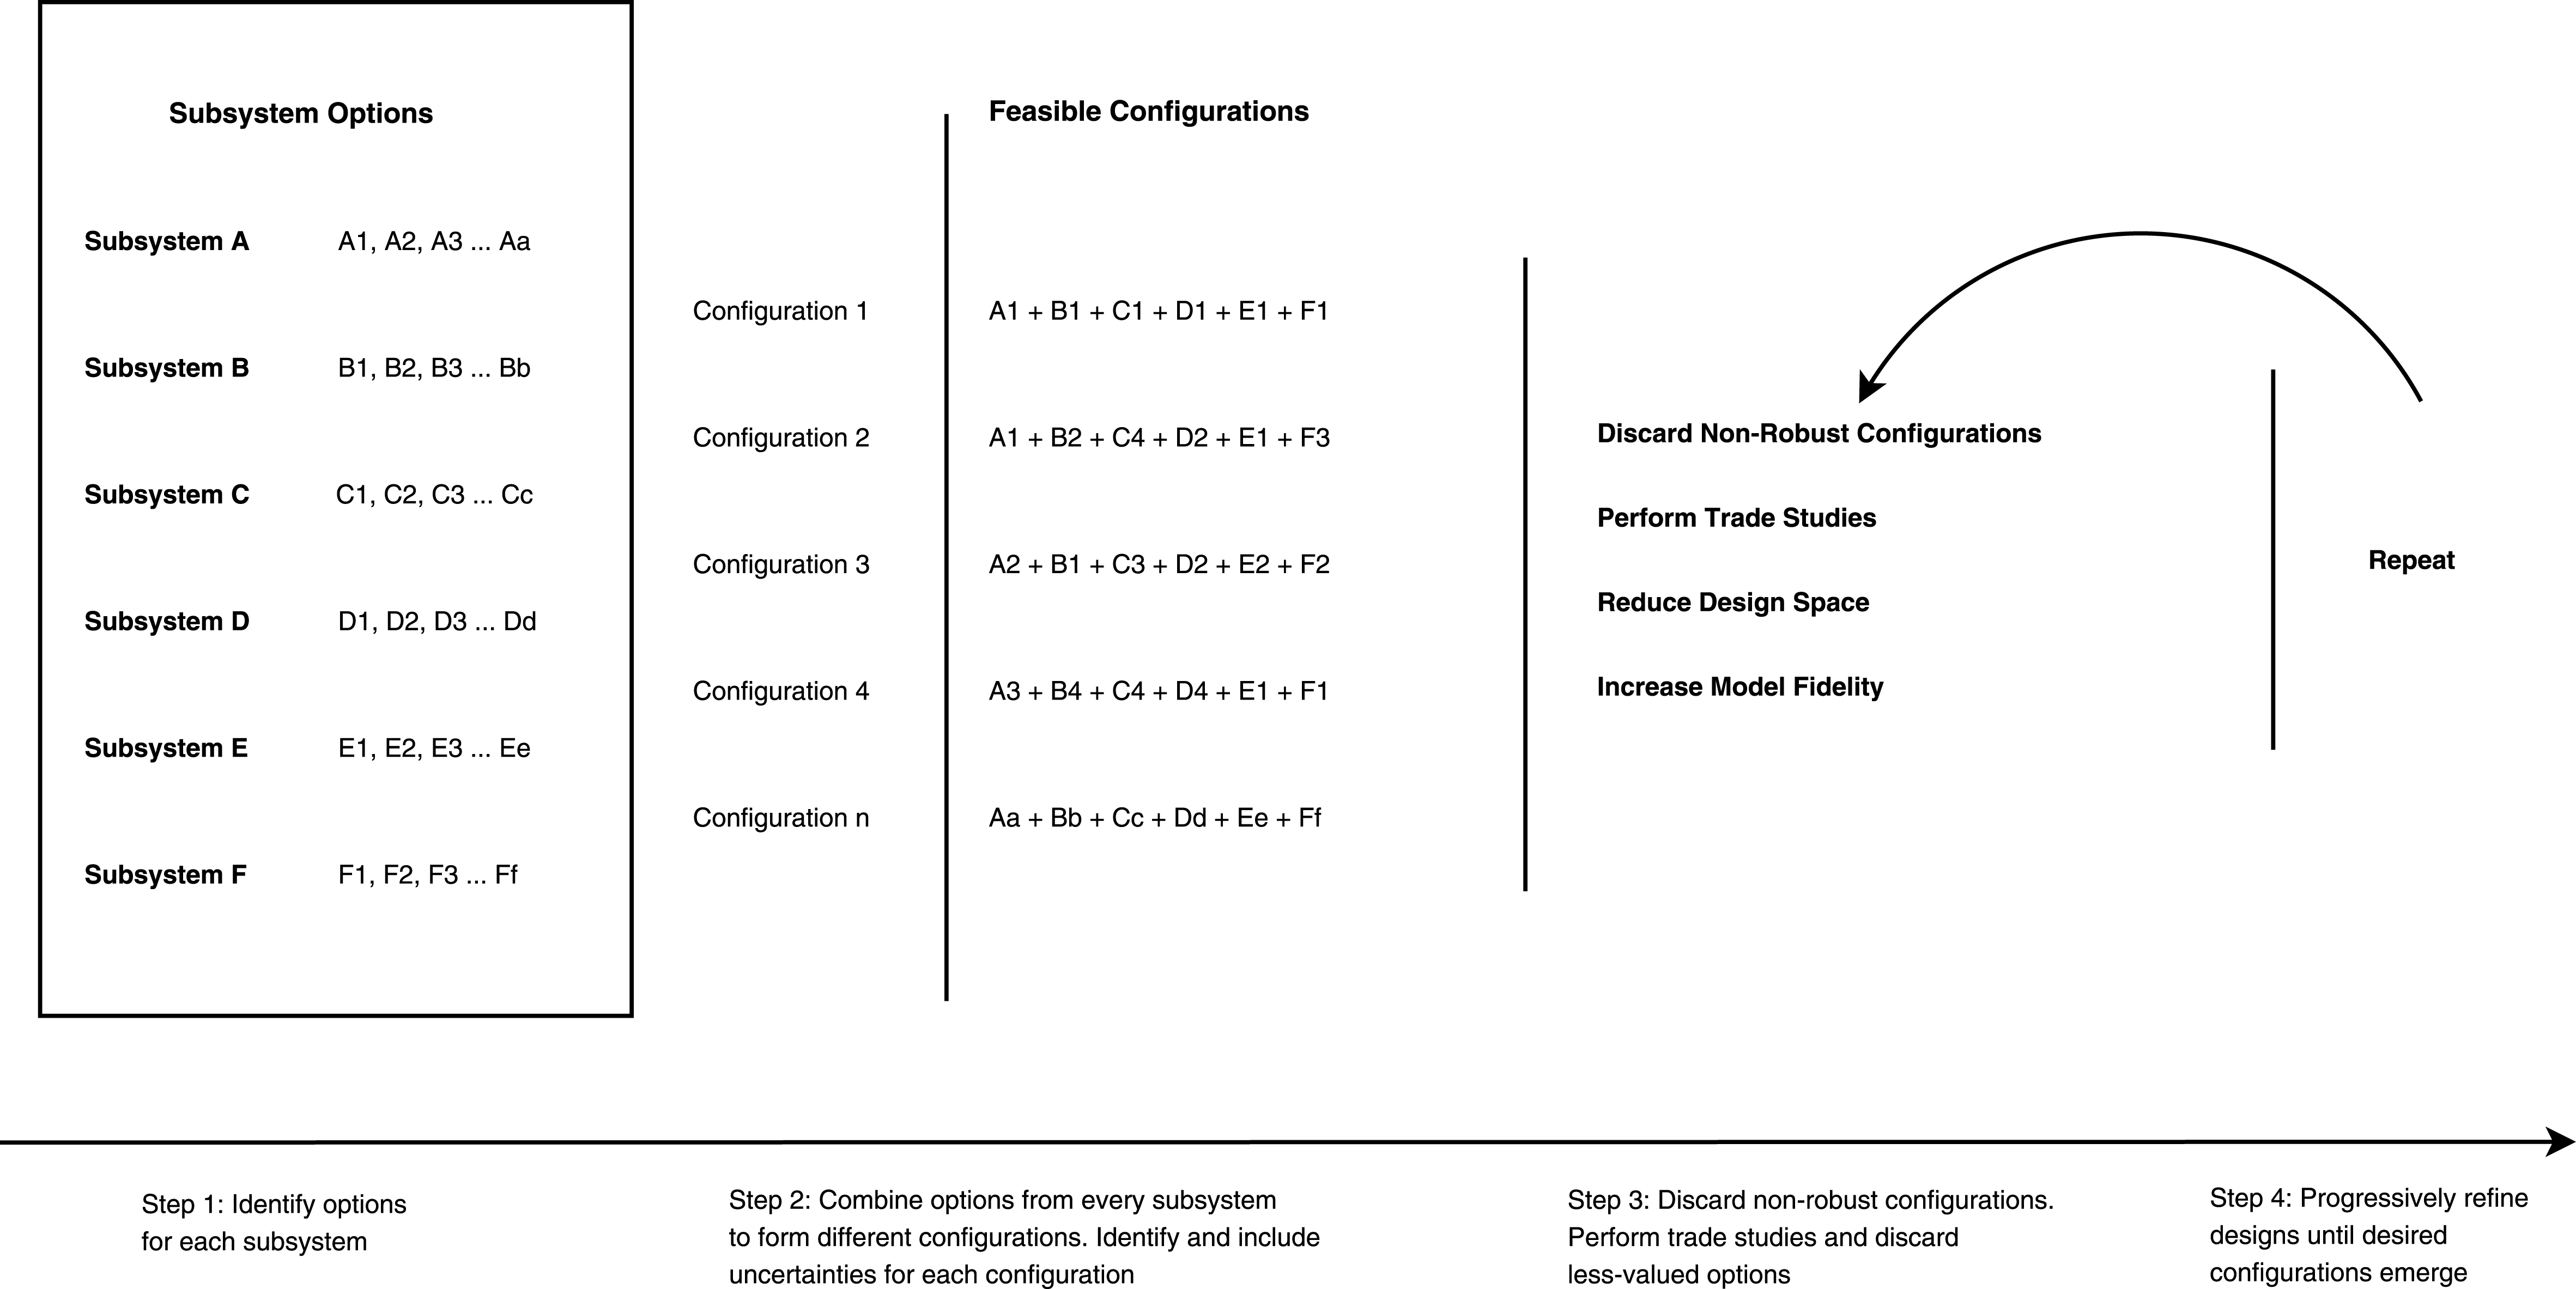
Figure 1. Set-based design approach.
The SBD approach offers a number of advantages over traditional development processes; it has been well documented with some authors even claiming that the approach (and related Lean practices) can be up to four times more productive (Morgan and Liker Reference Morgan and Liker2006; Ward and Sobek Reference Ward and Sobek2014; Raudberget Reference Raudberget2015).
Delaying critical design decisions, in order to fully understand the customer specifications and requirements, can reduce the possibility of design changes later on, which otherwise could have been costly (Ward et al. Reference Ward, Liker, Cristiano and Sobek1995; Kennedy, Sobek and Kennedy Reference Kennedy, Sobek and Kennedy2014).
The approach has also been shown to have positive effects on the resulting product and the development process itself. Not only does it avoid costly reworks, the risk of failure is also reduced (due to other feasible solutions being available at all stages). It also promotes innovative thinking and creativity along with organisational knowledge and learning (Khan et al. Reference Khan, Al-Ashaab, Doultsinou, Shehab, Ewers and Sulowski2011, Reference Khan, Al-Ashaab, Shehab, Haque, Ewers, Sorli and Sopelana2013).
The topic of SBD is an active area of research and, though limited, industrial applications of SBD have been documented (Malak, Aughenbaugh and Paredis Reference Malak, Aughenbaugh and Paredis2009). Ward et al. (Reference Ward, Liker, Cristiano and Sobek1995) and Sobek et al. (Reference Sobek, Ward and Liker1999) argued that SBD was a key to Toyota’s and TPDS success. Raudberget (Reference Raudberget2010) and Raudberget et al. (Reference Raudberget, Levandowski, Isaksson, Kipouros, Johannesson and Clarkson2015) investigated how SBD can be implemented in existing product development companies through industrial case studies, while Mebane et al. (Reference Mebane, Carlson, Dowd, Singer and Buckley2011) applied the SBD approach to the design of a Ship to Shore Connector.
Set-based concurrent engineering has also been the main enabler of the large European project, LeanPPD, which aimed to address the need of European manufacturing companies for a new lean model beyond just manufacturing (Al-Ashaab et al. Reference Al-Ashaab, Golob, Attia, Khan, Parsons, Andino, Perez, Guzman, Onecha, Kesavamoorthy, Martinez, Shehab, Berkes, Haque, Soril and Sopelana2013; Khan et al. Reference Khan, Al-Ashaab, Shehab, Haque, Ewers, Sorli and Sopelana2013). Furthermore, Guenov et al. (Reference Guenov, Nunez, Molina-Cristobal, Datta and Riaz2014) developed an interactive computational tool that facilitates a SBD workflow and applied it to the design of a conceptual aircraft.
Where the set-based approach considers a lot of design options both at system level and subsystem level, and eventually narrows down to one, point-based deals with just one design configuration from the beginning. This main difference means that both approaches have their benefits and drawbacks when compared against each other (Al-Ashaab et al. Reference Al-Ashaab, Golob, Attia, Khan, Parsons, Andino, Perez, Guzman, Onecha, Kesavamoorthy, Martinez, Shehab, Berkes, Haque, Soril and Sopelana2013).
With the ability to consider many alternative options simultaneously, the set-based approach offers a lot more flexibility. This is particularly true in multidisciplinary cases where, due to the modularity of the approach, it offers a significant advantage over the point-based approach. However that flexibility brings uncertainty into the process when compared to an iterative approach where only one option is considered. The flexibility and consideration of multiple options means that there is a delay in the decision-making process in order to converge to the final chosen design configuration; unless the narrowing is done aggressively. As a result, it can make it a more resource demanding process, especially in early stages due to front-loading.
Even though the initial costs might be higher for SBD, the availability of alternative solutions at any point in the design process, reduces the impact of a possible design change. Such a feature is not provided by a point-based approach, increasing the cost of a potential design change or design failure.
Due to the knowledge generation that SBD provides, future implementations of it in similar projects can reduce the development time because the information is readily available. In an iterative process, the knowledge generated is very limited because of the confined and constrained design space such an approach takes place in.
It is the authors’ opinion, that in the case of complex systems such as an aircraft, SBD is the better suited option. This is due to the fact that an aircraft design is a long, costly, and complex process that involves many disciplines. This creates a multidimensional design space that a point-based approach would struggle to explore thoroughly. Furthermore, due to the high possibility of changes in initial design and requirements, flexibility in the initial stages is essential, as design changes occurring in later stages using a point-based approach could yield prohibitively high costs. Adding to that, aircraft manufacturers tend to provide different configurations for each aircraft (aircraft families), something that SBD and platform-based design can accomplish (Levandowski, Raudberget and Johannesson Reference Levandowski, Raudberget and Johannesson2014; Landahl et al. Reference Landahl, Levandowski, Johannesson and Isaksson2016; Levandowski, Muller and Isaksson Reference Levandowski, Muller and Isaksson2016; Riaz, Guenov and Molina-Cristobal Reference Riaz, Guenov and Molina-Cristobal2017).
2.2 Optimisation
Optimisation methods aim to reach an optimum or a non-dominated solution by minimising or maximising an objective function
![]() $f(\mathbf{x})$
. The function is dependent on a number of design variables that form the design vector
$f(\mathbf{x})$
. The function is dependent on a number of design variables that form the design vector
![]() $[\mathbf{x}]$
, which can be bound by constraints (Nocedal and Wright Reference Nocedal and Wright2006).
$[\mathbf{x}]$
, which can be bound by constraints (Nocedal and Wright Reference Nocedal and Wright2006).
subject to:
where
![]() ${x_{i}\!}_{L}$
and
${x_{i}\!}_{L}$
and
![]() ${x_{i}\!}_{U}$
are the lower and upper bounds of each design variable, respectively.
${x_{i}\!}_{U}$
are the lower and upper bounds of each design variable, respectively.
Optimisation has been an active field of research in the aerospace industry for many years with applications ranging from aerodynamic and aeroelasticity optimisation (Ebrahimi and Jahangirian Reference Ebrahimi and Jahangirian2014; Wunderlich Reference Wunderlich2015), to structures, weight and manufacturability (Toropov et al. Reference Toropov, Jones, Willment and Funnell2005; Oktay, Akay and Merttopcuoglu Reference Oktay, Akay and Merttopcuoglu2011).
When designing complex systems such as an aircraft, the optimisation process needs to take into consideration the different disciplines involved, such as structures, aerodynamics, aeroelasticity and costs. Optimisation methods that aim to address and take into consideration more than one discipline are known as MDO methods. Sobieski and Haftka (Reference Sobieski and Haftka1997) defined MDO as ‘a methodology for the design of systems in which strong interaction between disciplines motivates designers to simultaneously manipulate variables in several disciplines’. However, the term has evolved to encompass any kind of optimisation process that involves more than one discipline (Sobieski and Haftka Reference Sobieski and Haftka1997) or strongly coupled elements (Guenov et al. Reference Guenov, Fantini, Balachandran, Maginot, Padulo and Nunez2010).
Most real-world problems, especially in MDO, involve more than just one objective. Multiobjective optimisation (sometimes referred to as multicriterion) deals with two or more objective functions:
In such cases, there is usually a trade-off between objectives; therefore, there is no unique optimum solution but a range of non-dominated solutions. That is, solutions that perform better at one objective but worse towards others.
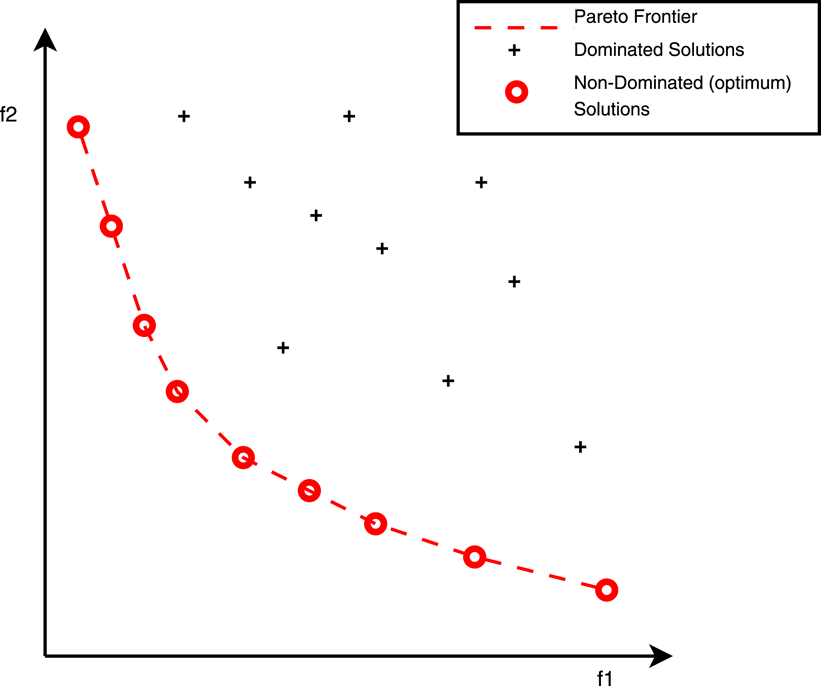
When dealing with biobjective optimisation (two objective functions), a common method to visualise the non-dominated solutions is the Pareto front shown in Figure 2.
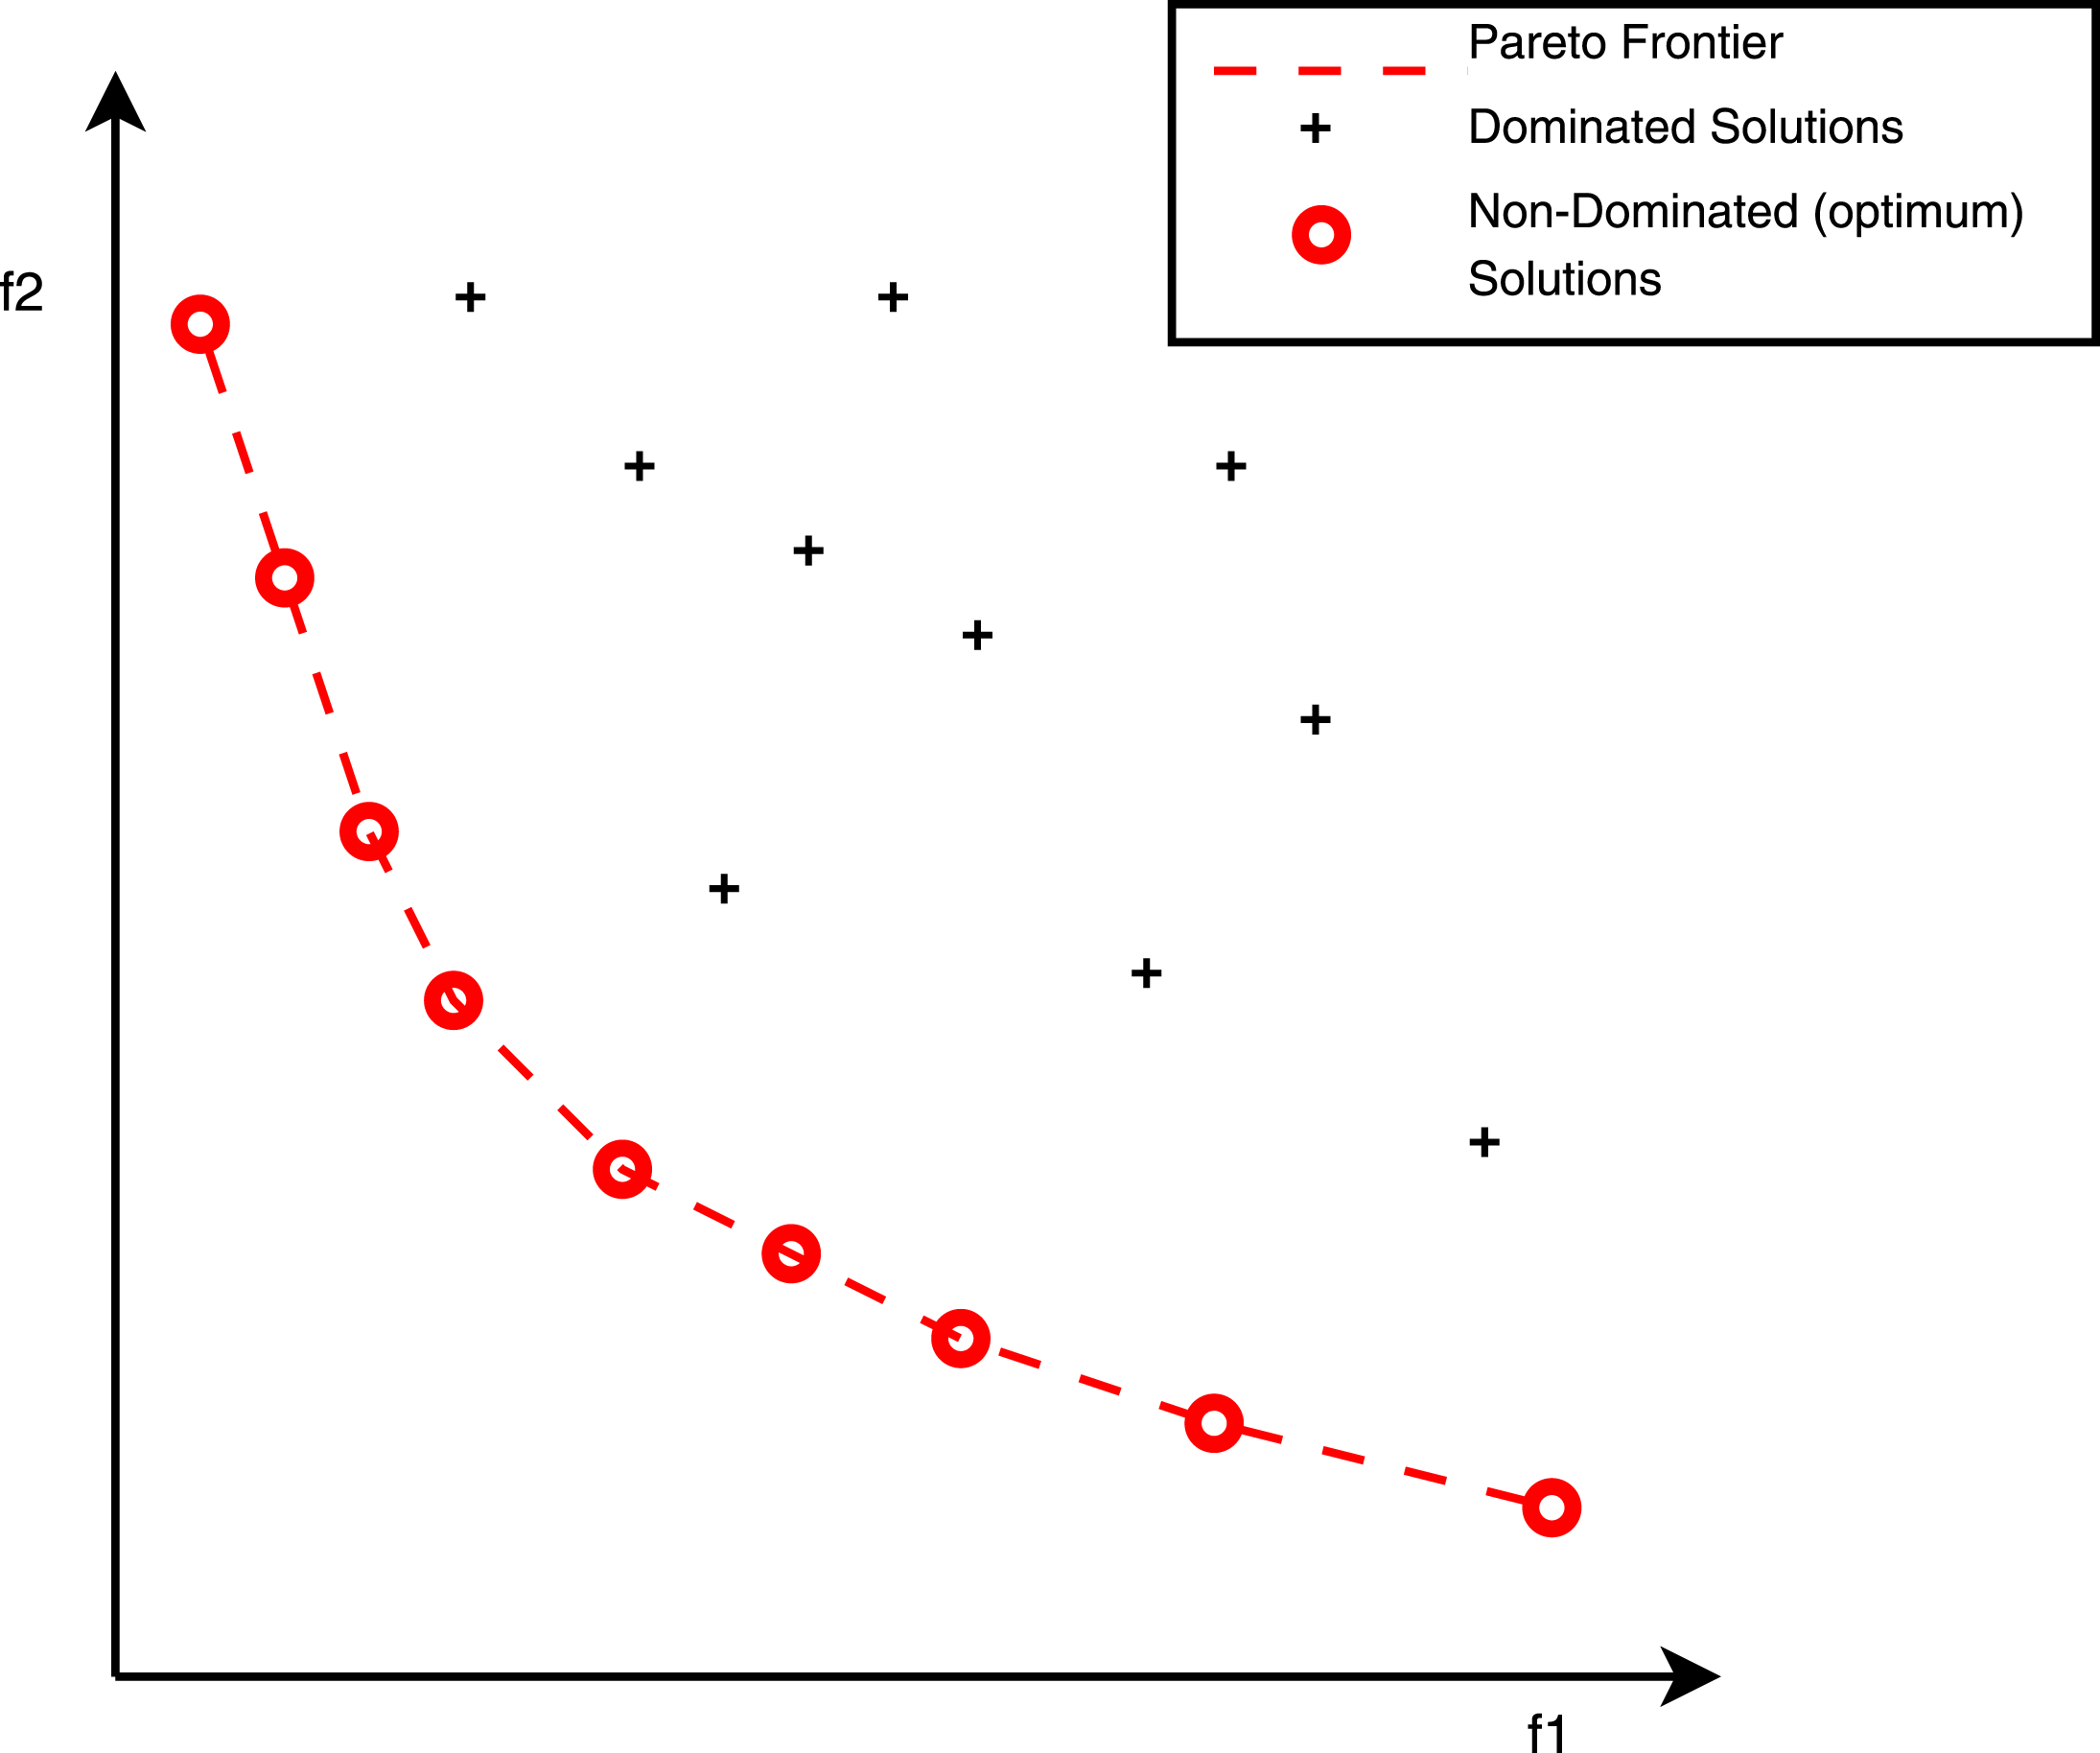
Figure 2. Pareto graph for a 2-objective optimisation (minimisation) problem.
The Pareto front method is useful for visualising the trade-offs between two objectives. From there on however it is limited in the sense that the respective variables for each solution are not visualised and the graph cannot be applied in optimisation problems with more than two objectives.
For this reason, parallel coordinates are employed to help visualise the different solutions for more than three objectives along with their respective variables. This not only allows for multidimensional data visualisation, but it also assists in identifying positive and negative relationships between objectives and variables (Inselberg Reference Inselberg2009). This makes parallel coordinates a very powerful tool in visualising multidimensional data especially in engineering design (Kipouros et al. Reference Kipouros, Inselberg, Parks and Savill2013), but also driving optimisation processes (Hettenhausen, Lewis and Kipouros Reference Hettenhausen, Lewis and Kipouros2014).
Parallel coordinates consist of parallel axes that each represents the objective functions and any other parameters that are of interest. Polylines are then being used, passing through all of the axes, with each line representing a solution. Figure 3 illustrates a simple example of how three random 3-Dimensional points in a scatter (stem) plot can be converted to parallel coordinates. Each point has three values, one for each dimension, and those values are connected with a polyline between the axes. There are only three axes since there are three dimensions. Each polyline represents one point in a multidimensional space. Each additional dimension requires an additional parallel coordinate axis to be introduced.
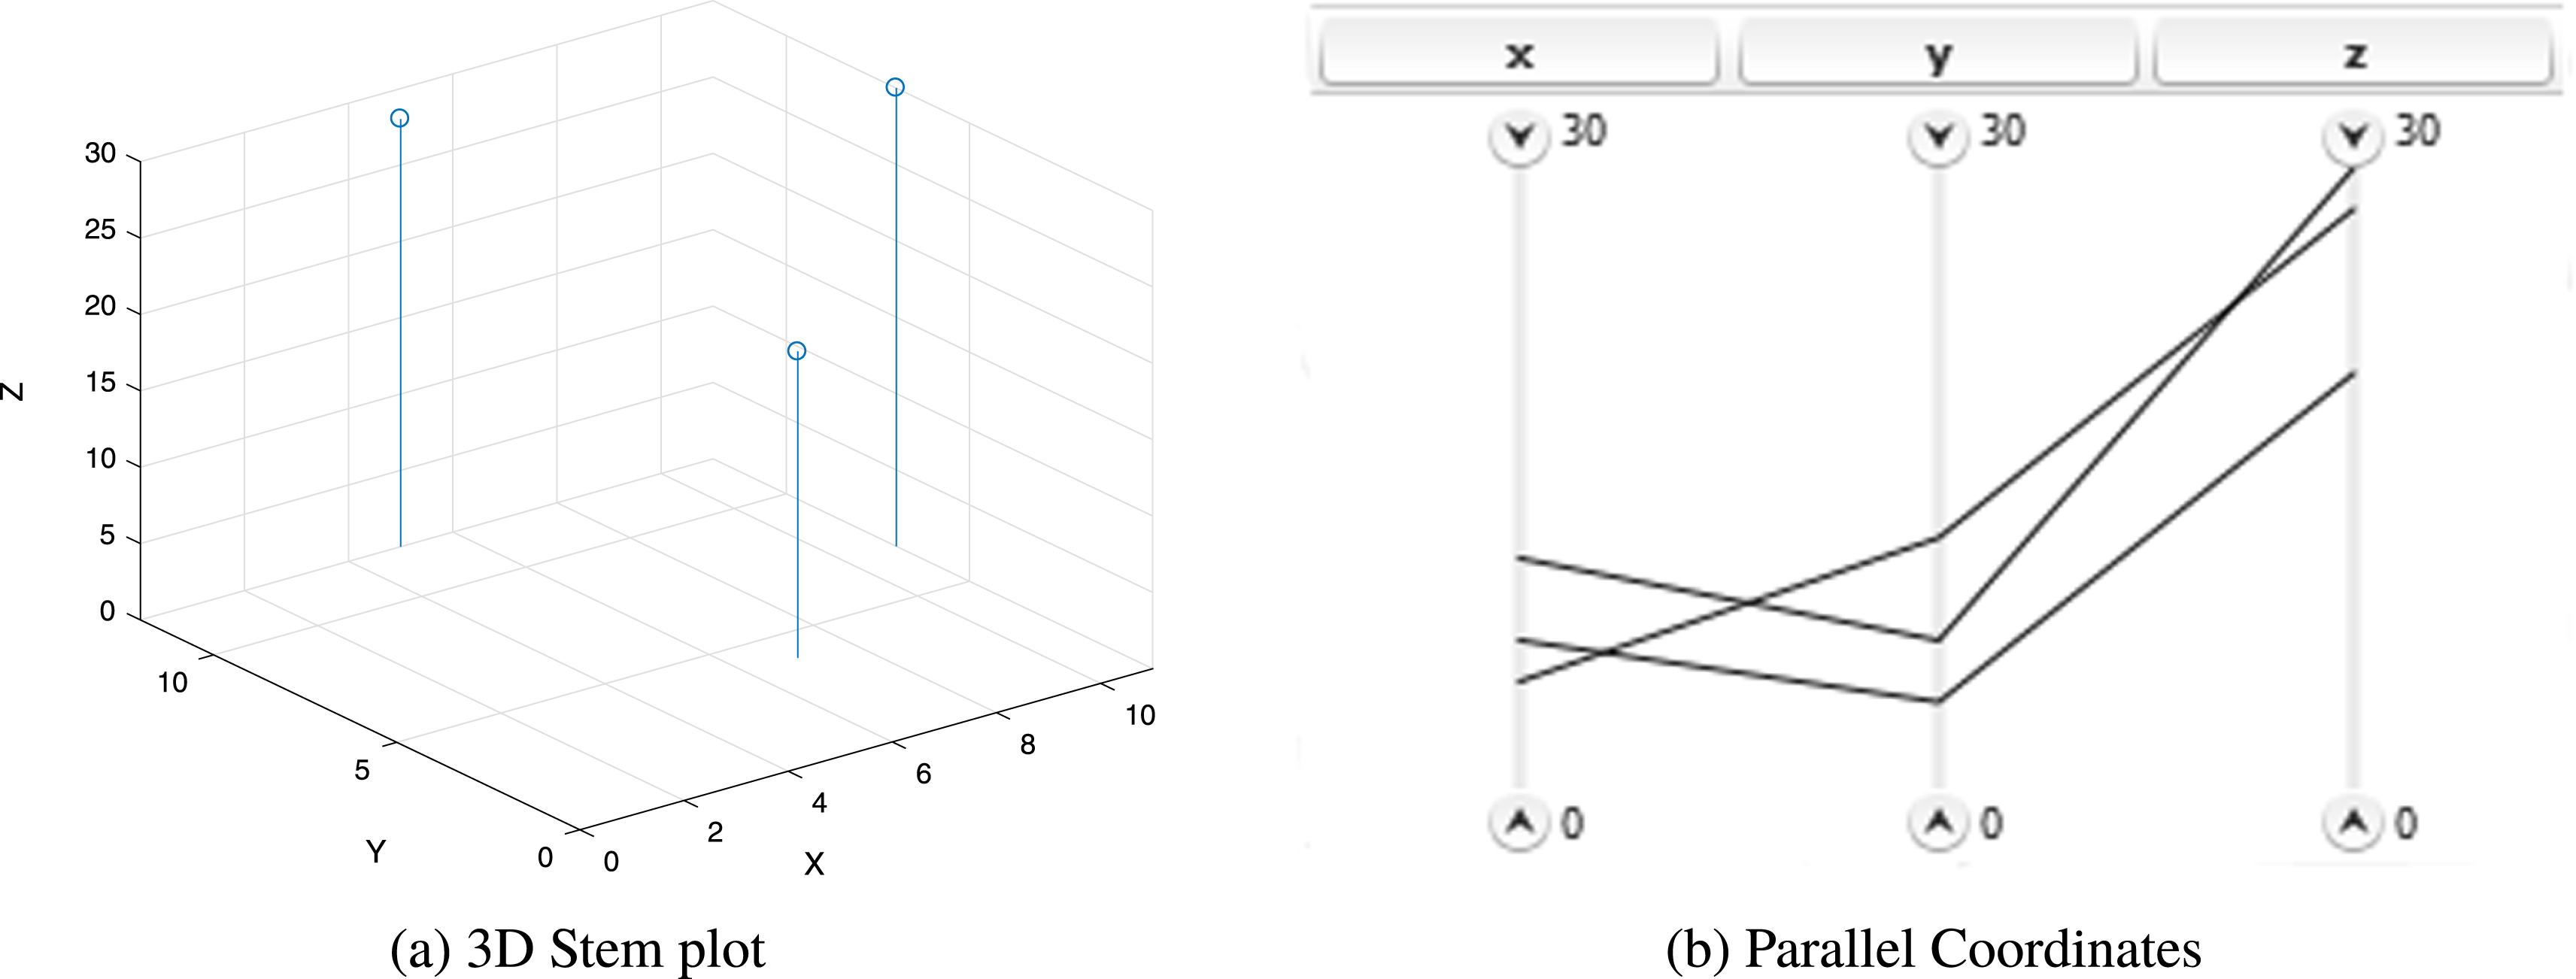
Figure 3. Stem plot for three points and the respective parallel coordinates visualisation.
2.3 Set-based design and MDO tools
In order to identify the strengths of the two areas that this work is concerned with it is useful to compare and contrast the two. The most important difference between them is that SBD is an approach to designing systems, whereas MDO is used as methodology to fine-tune the engineering characteristics of a system. Set-based design is primarily used in early stages of design where the design space is large and not as constrained as it will be at later stages. A number of different options are available for each domain and subsystems, and a combination of those, forms a number of configurations that are used as initial designs. Those designs will then be assessed and evaluated in order to remove the infeasible, non-robust, or less desirable ones. The assessment, evaluation, and discardment process is repeated until a final desirable design emerges. At each iteration, the configurations that have not been discarded are matured and assessed against new performance metrics and criteria.
On the other hand, MDO tools are employed at a different stage of the design process and for different reasons. It is primarily used to fine-tune engineering characteristics in order to achieve predefined performance objectives while meeting the required constraints and parameters. As a result, a tool like this is used at later stages of the design process where an overall configuration has been selected. The aim in this case is to find the optimum and non-dominated variations of that design as opposed to the set-based approach where the aim is to eliminate infeasible and undesirable ones.
There are a number of previous research publications that attempted to bring together the two areas of SBD and optimisation. Hannapel and Vlahopoulos (Reference Hannapel and Vlahopoulos2014) introduced principles of SBD in MDO where a new algorithm was developed that studies the design variables in terms of sets. Veenhuis (Reference Veenhuis2008) modified the particle swarm optimisation (PSO) algorithm by replacing the position and velocity vectors of the particles with sets.
However the aforementioned researches only use principles of SBD for developing novel optimisation methods and algorithms. In other words, they integrated a set-based approach in an MDO algorithm. The framework developed as part of this project aims to address what no previous research attempted to do; to integrate MDO tools in an SBD approach. This will bring the two areas together in a unified framework that exploits the benefits of both.
3 The ADOPT framework
Exploring a large and complex design space, seeking non-dominated and robust solutions, can be a challenging and computationally expensive process as previously mentioned. In a continuous space, there are infinite number of solutions, in the same way that there are infinite numbers between any two real numbers. By segregating that continuous space in ranges, a finite number of areas are created, that can be explored independently. This ‘discretisation’ of the design space allows optimisers to search for solutions in more confined spaces making the process faster, while ensuring that only the areas that are of interest are explored.
Furthermore, the framework aims to improve the conventional set-based approach in a number of ways:
(1) Taking into consideration the different levels of a system, from high-level system of systems to low level components. Using knowledge-based methods and expert judgement, this will allow for early identification of incompatible, infeasible, or undesirable combinations between the different levels; enabling the discardment of those configurations before having to generate them and evaluate them. It also brings forward the development of domain-specific systems, earlier in the design process.
(2) It can handle any kind of design parameter whether a continuous or discrete one. Continuous parameters are discretised into ranges, which are then combined with the remaining discrete ones to form architectures/configurations. In these cases they will then be reverted back to continuous ranges, the bounds of which will act as optimisation constraints.
(3) By integrating optimisation tools, each configuration can be fine-tuned with regards to its engineering characteristics. This will lead to the generation of different non-dominated and robust design alternatives for each configuration, while respecting the constraints of each search area.
(4) Optimising each area in the discretised design space can assist in a more thorough exploration; when compared to having a single optimiser for the entire design space. The single optimiser might get trapped in local optima without evaluating other promising areas of the design space. Having the area fragmented in a number of sub-spaces with an optimiser for each one, will ensure that a larger portion of the design space is evaluated.
(5) By introducing infeasibility and undesirability constraints allows areas in the design space to be discarded. This ensures that the areas in the design space that are being explored are the desirable ones at each stage. By discarding the undesirable ones using knowledge-based methods and expert judgement as mentioned in Point 1, ensures that no resources will be allocated to evaluating areas that we know beforehand will yield undesirable results.
(6) Not all design parameters will directly affect the optimisation objective. Therefore, the configurations that only differ in dormant parameters, that is, parameters that do not have an effect on the objective, will yield the same results. Identifying those configurations with shared active parameters will lead to a substantial reduction in the number of configurations that need to be optimised and avoid duplicate results.
(7) With each configuration being able to be optimised independently allows for a concurrent (parallel) search for non-dominated solutions in each area of the design space.
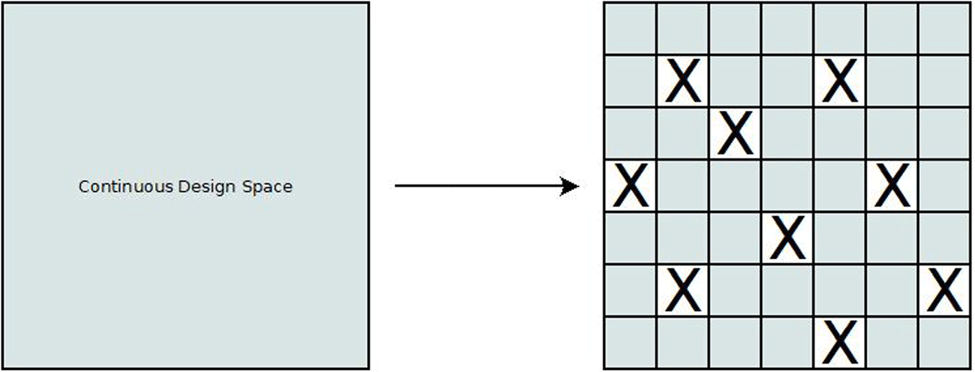
From the above features, it becomes apparent that ADOPT enables the facilitation of optimisers in a fragmented design space. Only the desirable fragments will be explored in order to generate non-dominated configurations and only the areas that will yield unique solutions. In a conventional optimisation process the function needs to be evaluated first before being checked if it violates any constraints. If it does, this costs time and computational power unnecessarily. By completely discarding areas of the design space allows omitting undesirable areas entirely without first having to evaluate them. A visual representation of the transformed design space is presented in Figure 4 where X marks areas that are either undesirable or infeasible.
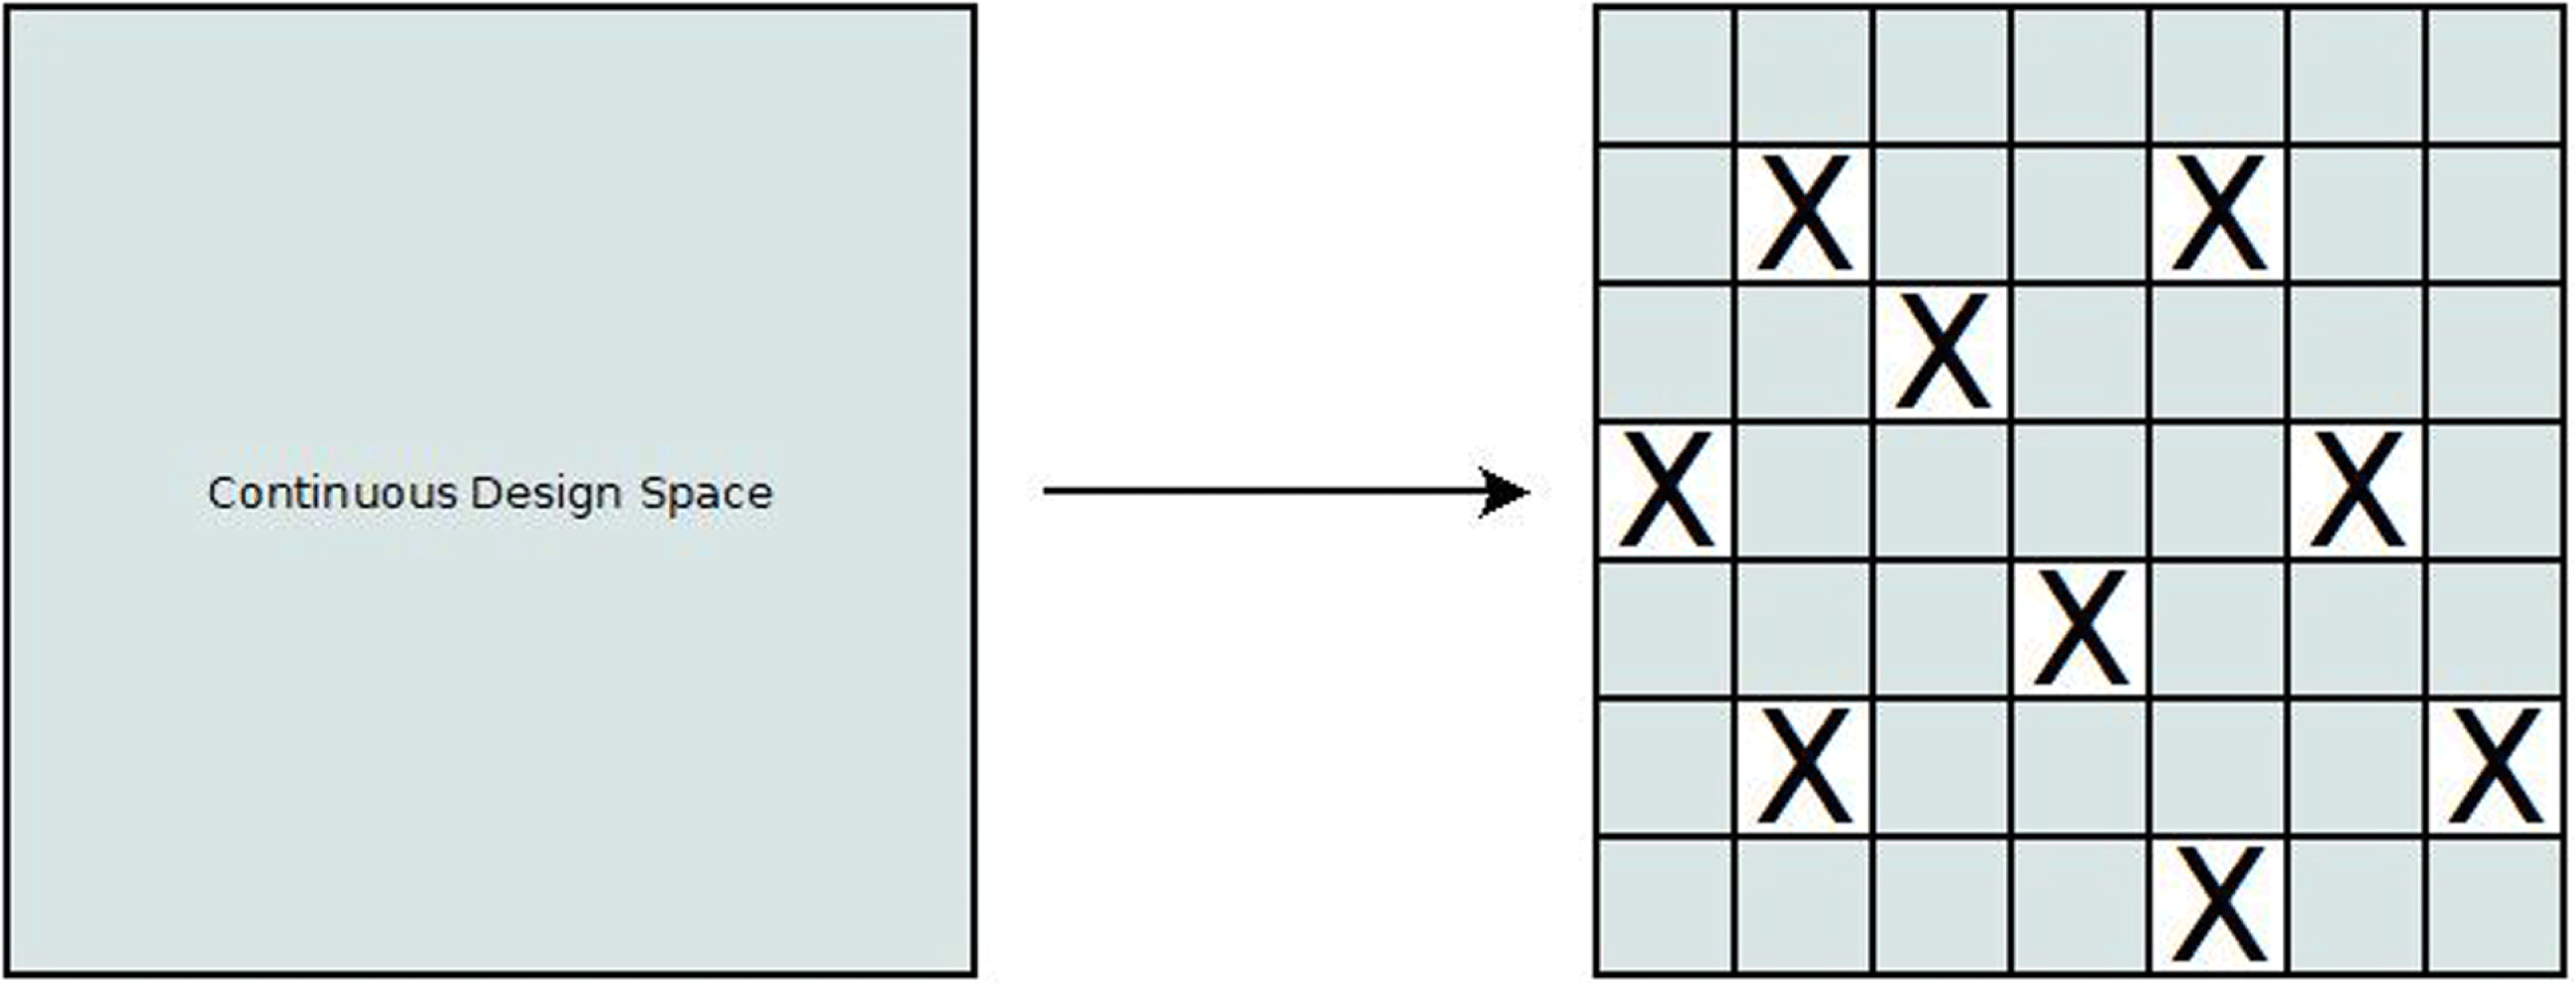
Figure 4. Design-space transformation with ADOPT.
3.1 Stage 1
Stage 1 deals with the decomposition of the system and the generation of configurations. Initially, only instances of the configurations are created before gradually moving to more complete computational models of each one. The instances describe how each configuration is synthesised; including the dimensions and options from each design parameter. The stage is also concerned with converting the continuous parameters to discrete and handling the initial infeasibility and undesirability constraints, which leads to the transformation of the design space as previously described. Figure 5 shows the flow diagram of the first stage.
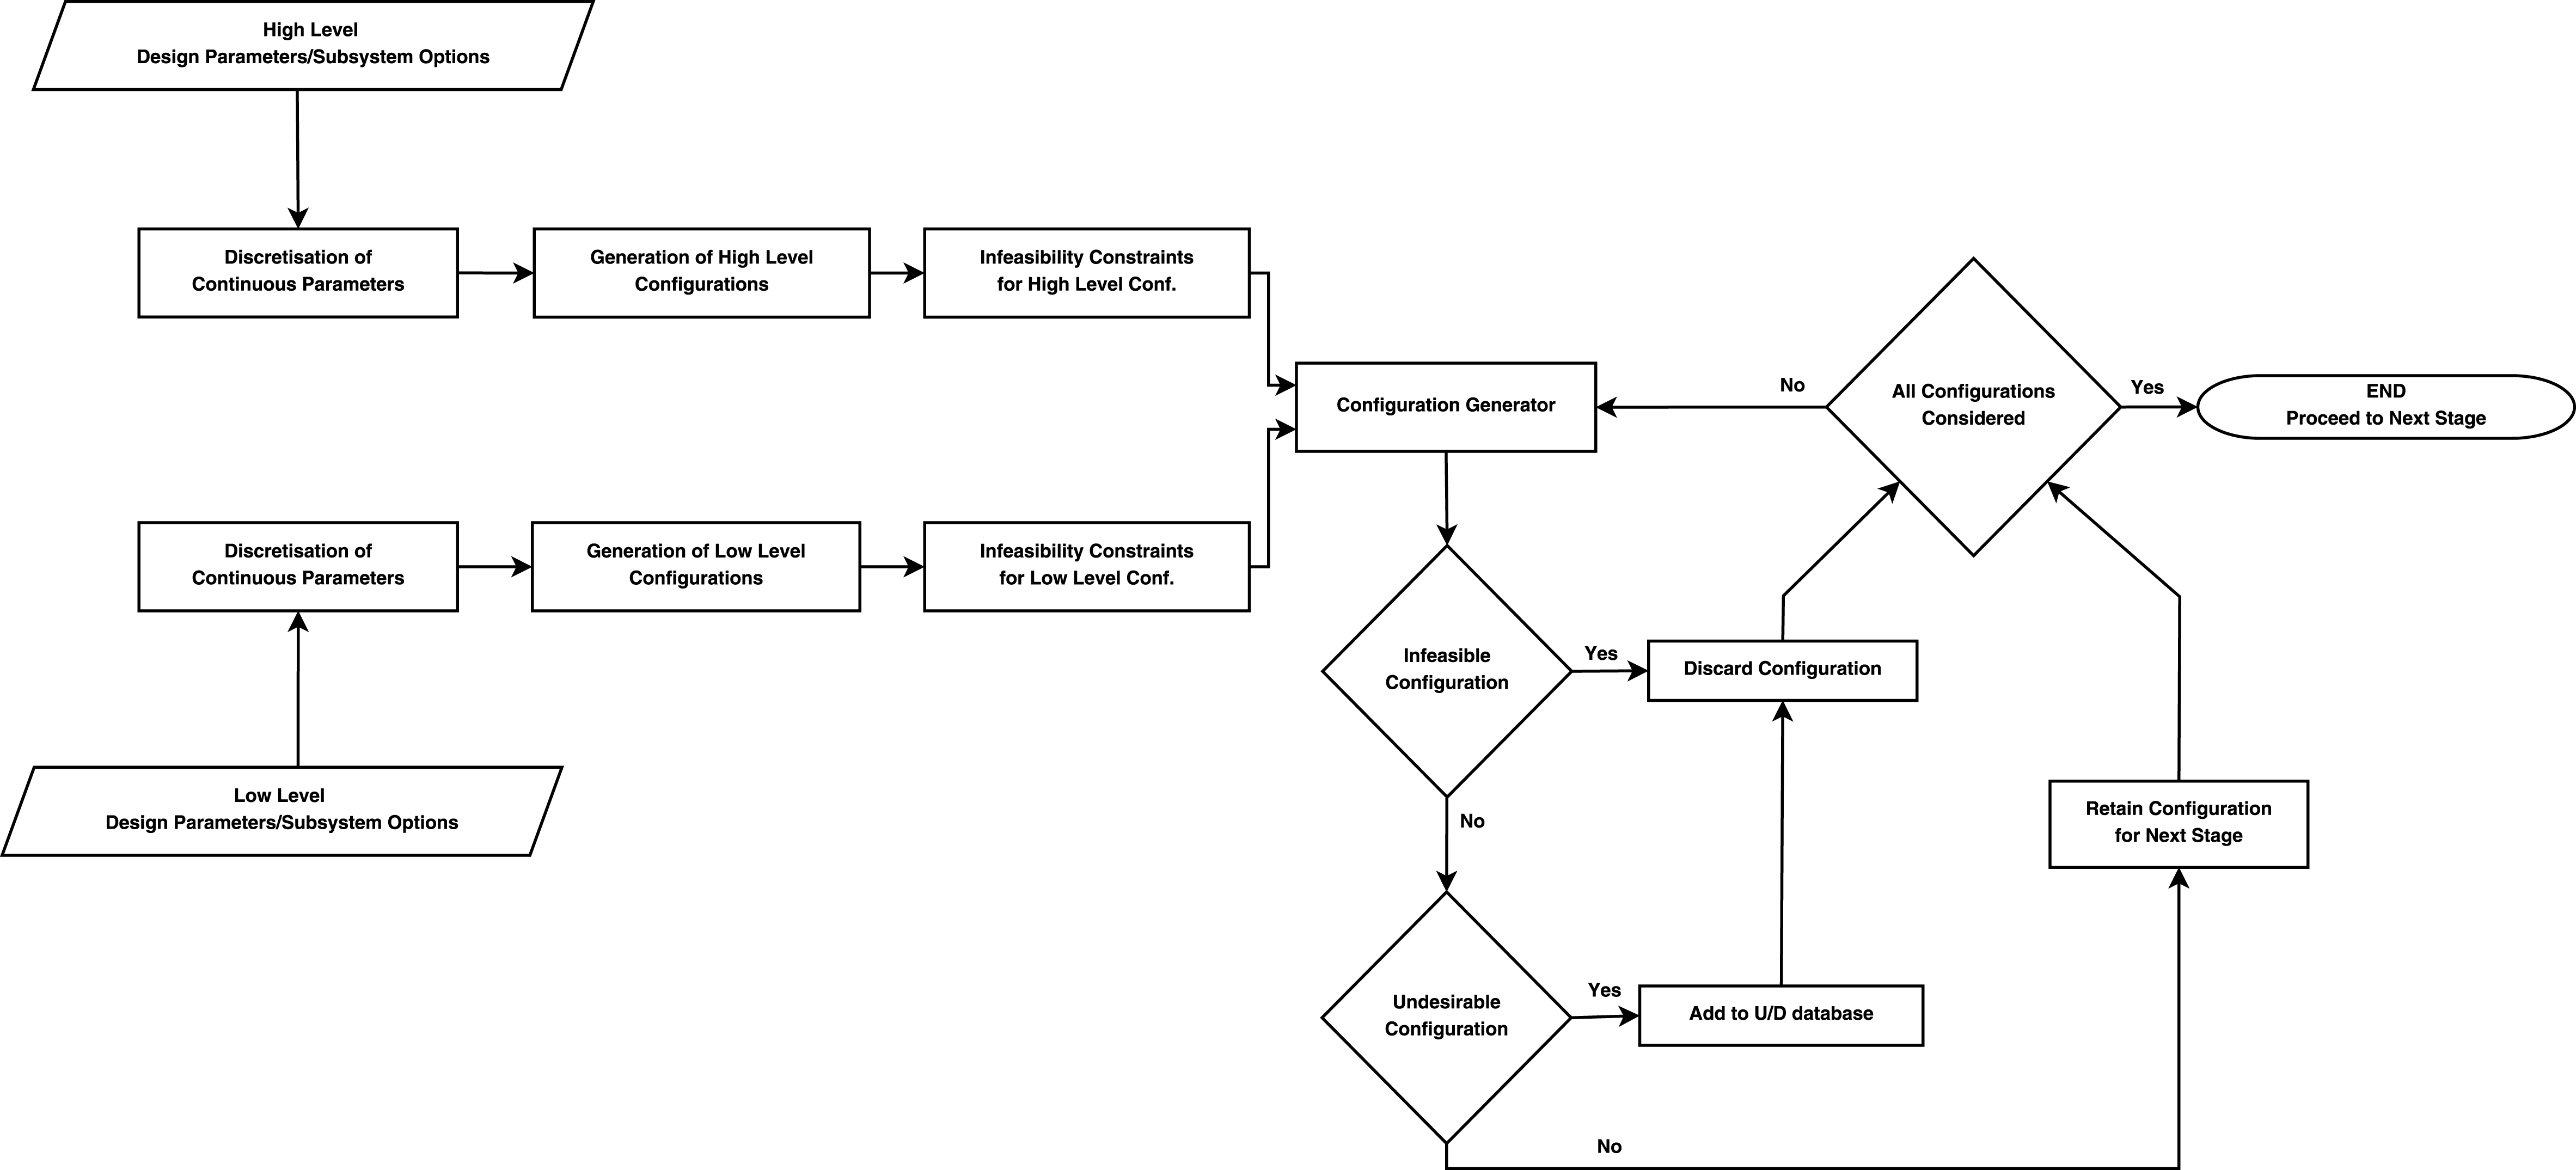
Figure 5. ADOPT framework Stage 1.
The first step is to identify the levels, the disciplines or the areas that form the system. In this case the system is partitioned into two levels: the high level, which considers external parameters that affect the system but are not within the system itself, and the low level which includes the subsystems and components of the system being designed. Additional intermediate levels of the system can be added where appropriate.
Following the process of the SBD, as presented in Figure 1, each level is further elaborated into its design parameters. Each design parameter has a number of possible options, be it discrete ones in the case of the low level subsystems and components, or continuous ones in the form of ranges in the case of high-level dimensions. Before proceeding to generate the configurations, the continuous parameters need to be converted to discrete. This is done in order to generate a finite number of possible combinations amongst all options of each design parameter. Continuous parameters would not allow such combinations because an infinite number of values exists between any range of continuous values.
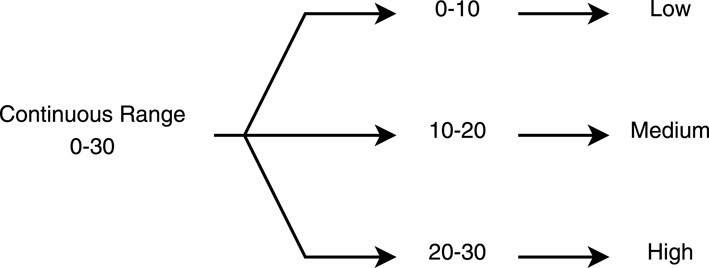
The most straightforward approach to discretising a continuous range is to split the range into smaller ranges and assign a linguistic term to each range such as ‘High’, ‘Medium’, or ‘Low’. Combining options afterwards becomes easier and straightforward; for example, a ‘High’ option for one design parameter with a ‘Medium’ option for another design parameter. The linguistic term used for the variables, depends on the type of design parameter being described. A simple example of a range being discretised is shown in Figure 6.
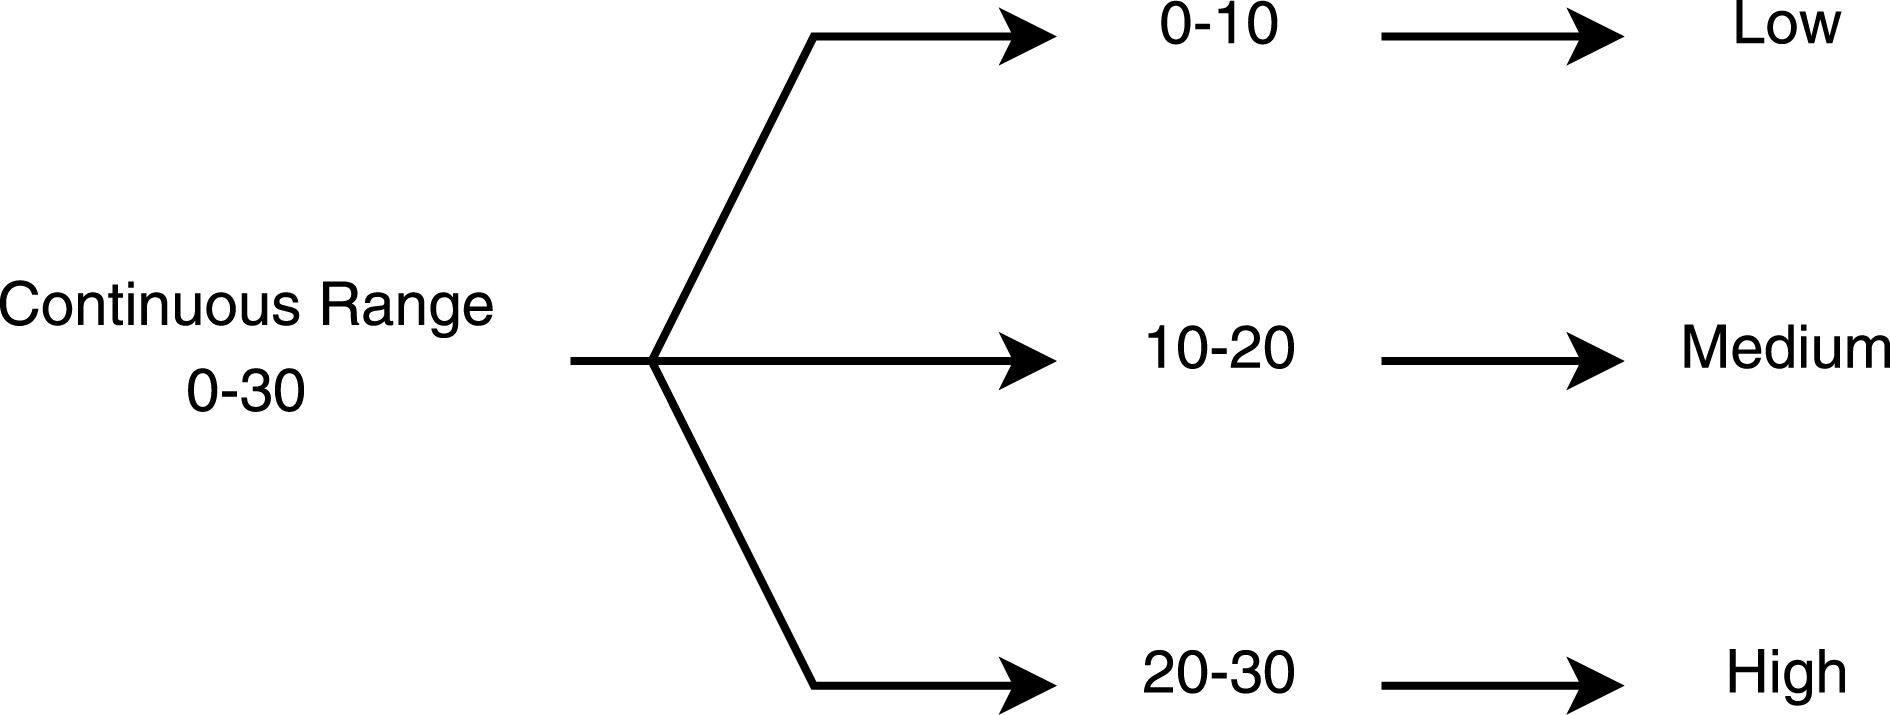
Figure 6. Example of discretising a continuous range.
The discrete values will be converted back to their respective ranges in the second stage of the framework for optimisation purposes.
Completing the identification of the levels and their respective design parameters, and after the continuous parameters have been discretised, the process of generating the configurations begins. By taking one option for each design parameter the configurations are formed. Initially, the combination of options happens at each level independently; meaning that the combinations of high-level parameters are independent from the low level ones. This is to allow better handling of the configurations and for performing infeasibility checks.
Introducing infeasibility and undesirability constraints, allows the elimination and discardment of configurations before moving to the second stage. Discarding configurations, directly translates to rejecting areas in the fragmented design space. Allowing the optimisers in the second stage to skip areas in the design space, eliminates the unnecessary use of computational power and time that would have been used to evaluate configurations that violate constraints. After the infeasibility checks take place at each level and the infeasible configurations are discarded, the high-level combinations are combined with the low level ones to form the full design architectures.
The combined configurations are then filtered through new infeasibility constraints before assessing them against undesirability constraints. The difference between the two is that the undesirable configurations are the ones that are currently not of interest, not feasible or not desirable due to limitations in technology or otherwise, but could become feasible in the future. For this reason the undesirable configurations are stored in a separate database to be re-evaluated at a future stage. The infeasible ones are the ones that are practically or otherwise impossible to implement and are discarded completely.
The inclusion of constraints this early is very important, due to the large number of configurations the first stage of the framework can generate which can be in the thousands even for simple systems. Discarding a portion of those configurations can make the second stage of the framework faster, and enable the allocation of people and resources to the feasible and desirable ones. All the configurations that have passed the infeasibility and undesirability constraints are stored and proceed to Stage 2 of the framework for further evaluation.
3.2 Stage 2
The second stage follows an iterative and converging process, where at each iteration the undesirable configurations are eliminated, hence progressively narrowing the design space. The process of the second stage of ADOPT is presented in Figure 7.
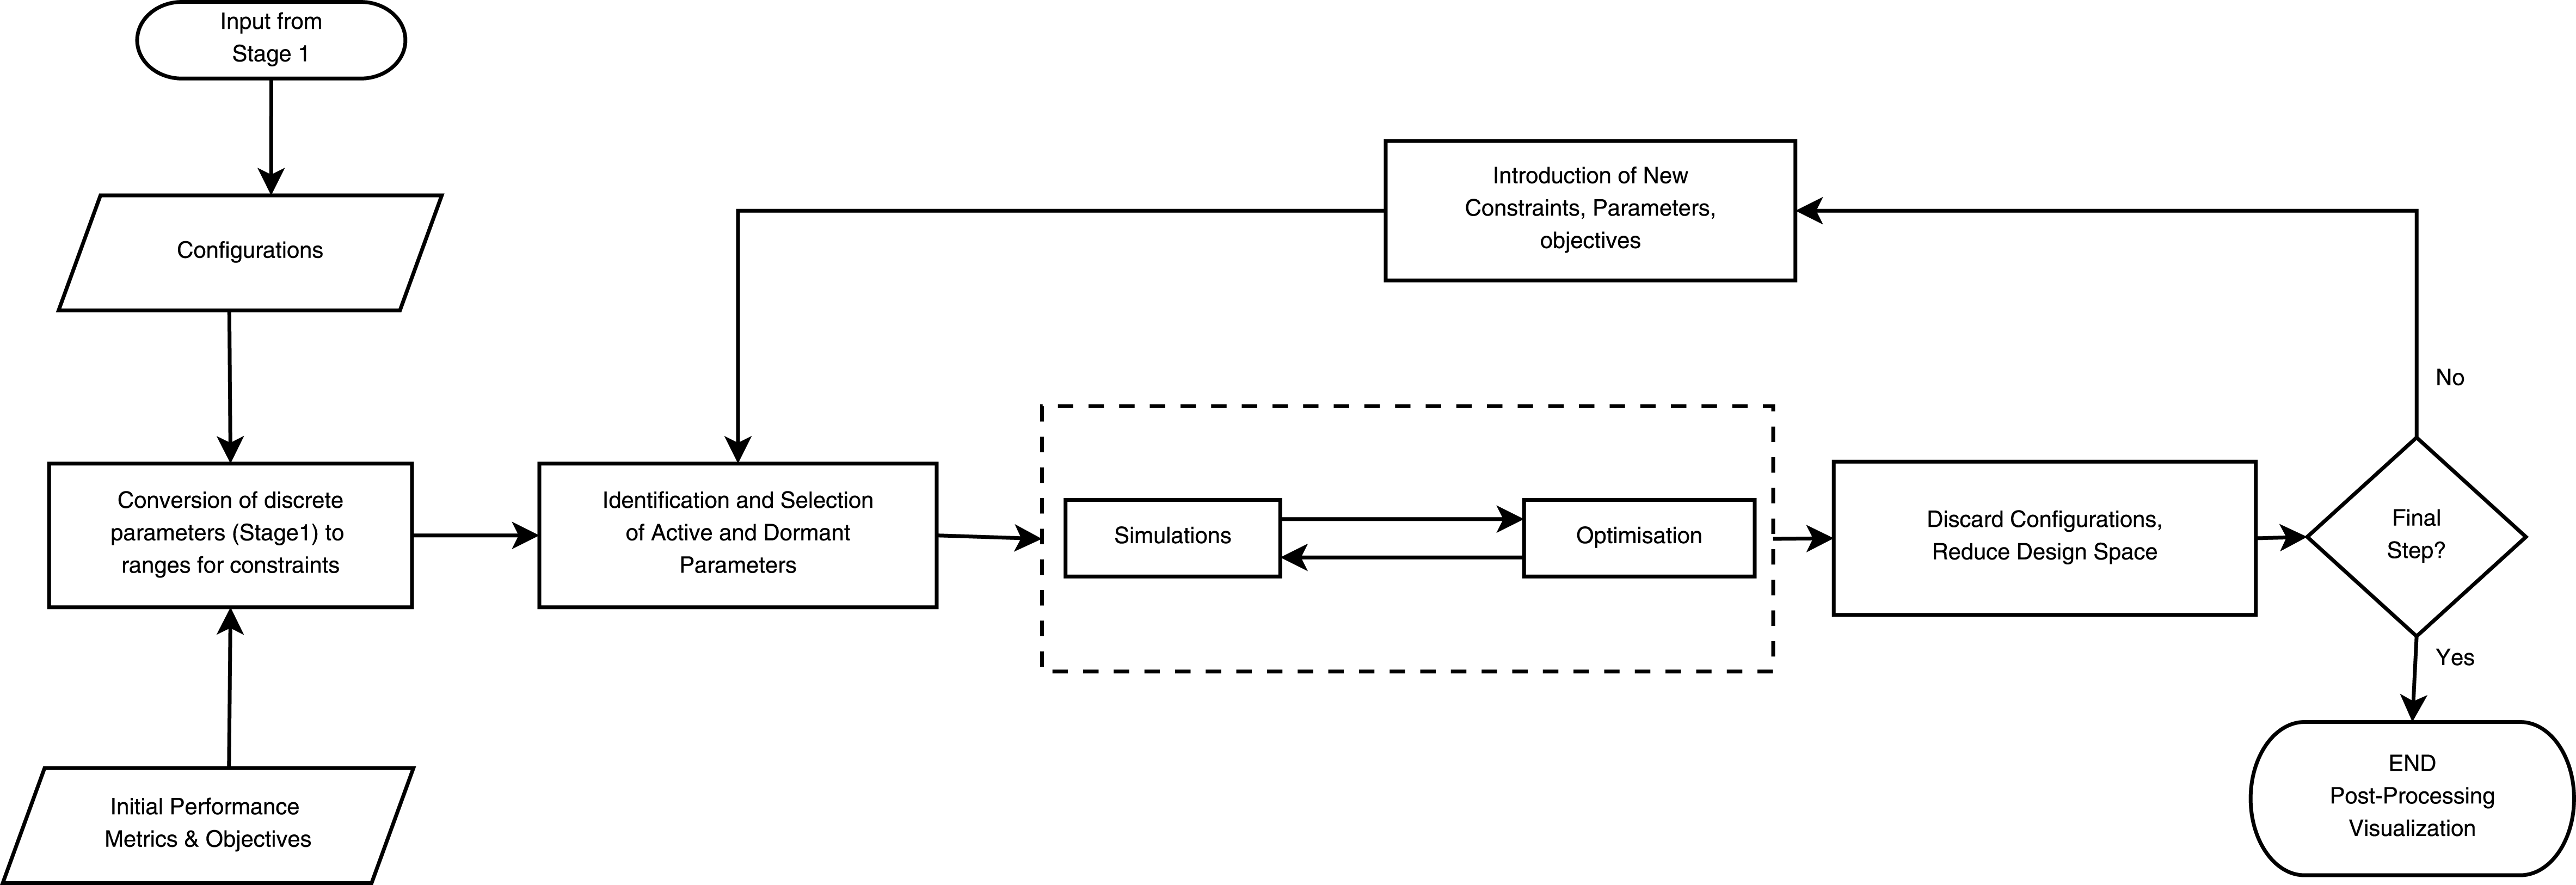
Figure 7. ADOPT framework Stage 2.
The first step of the second stage is to transform the discretised parameters of each configuration, back to their respective continuous ranges. Using Figure 6 as an example, the discrete values can be reverted back to their ranges in a straightforward way; a ‘High’ option will revert to a range of 20–30 and so on. The ranges of continuous parameters now become the constraints for the optimisation process. The ranges of each parameter become the upper and lower boundaries for the design space of each configuration. This creates a more confined space, in which the optimiser seeks non-dominated solutions.
The configurations are then passed through to the iterative stage of the framework where each one is optimised against a set of predefined objectives. However, in many cases, not every design parameter will affect the optimisation objective(s). Therefore two competing configurations that only differ in a design parameter that does not affect the objective (a ‘Dormant’ parameter), will yield the same optimisation results. Identifying the ‘active’ and ‘dormant’ parameters for optimisation is crucial as it can vastly reduce the optimisation time due to eliminating duplicate optimisation runs.
Configurations that differ only in dormant parameters options will yield the same optimisation results and are therefore placed in the same optimisation cluster. Only one configuration from each cluster needs to go through the optimisation process and the results will be shared with the remaining configurations within that cluster.
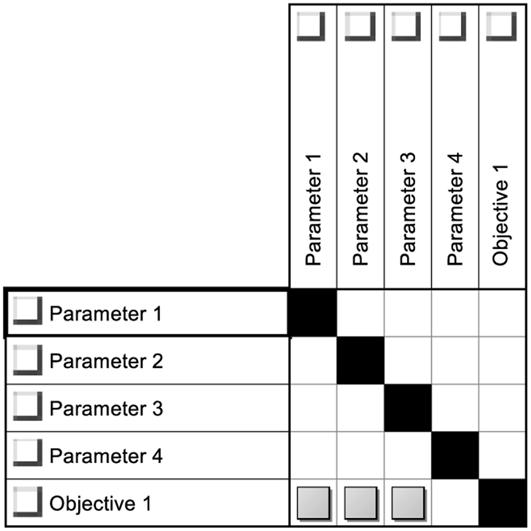
A simple and straightforward approach in identifying the active and dormant parameters would be to use a Design Structure Matrix (DSM) to visualise the connections between design parameters and optimisation objectives. DSMs are widely used as compact network modelling tools in engineering design to decompose and visualise system architectures (Browning Reference Browning2001; Eppinger and Browning Reference Eppinger and Browning2012). It provides the ability to visualise the connections and dependencies between the different elements of a system. They have also been used in predicting how design changes can propagate through a system (Clarkson, Simons and Eckert Reference Clarkson, Simons and Eckert2004), as well as the associated propagation costs (Georgiades et al. Reference Georgiades, Sharma, Kipouros and Savill2017). This enables the same DSM representation to be utilised for multiple purposes; as opposed to using a different tool for each purpose.
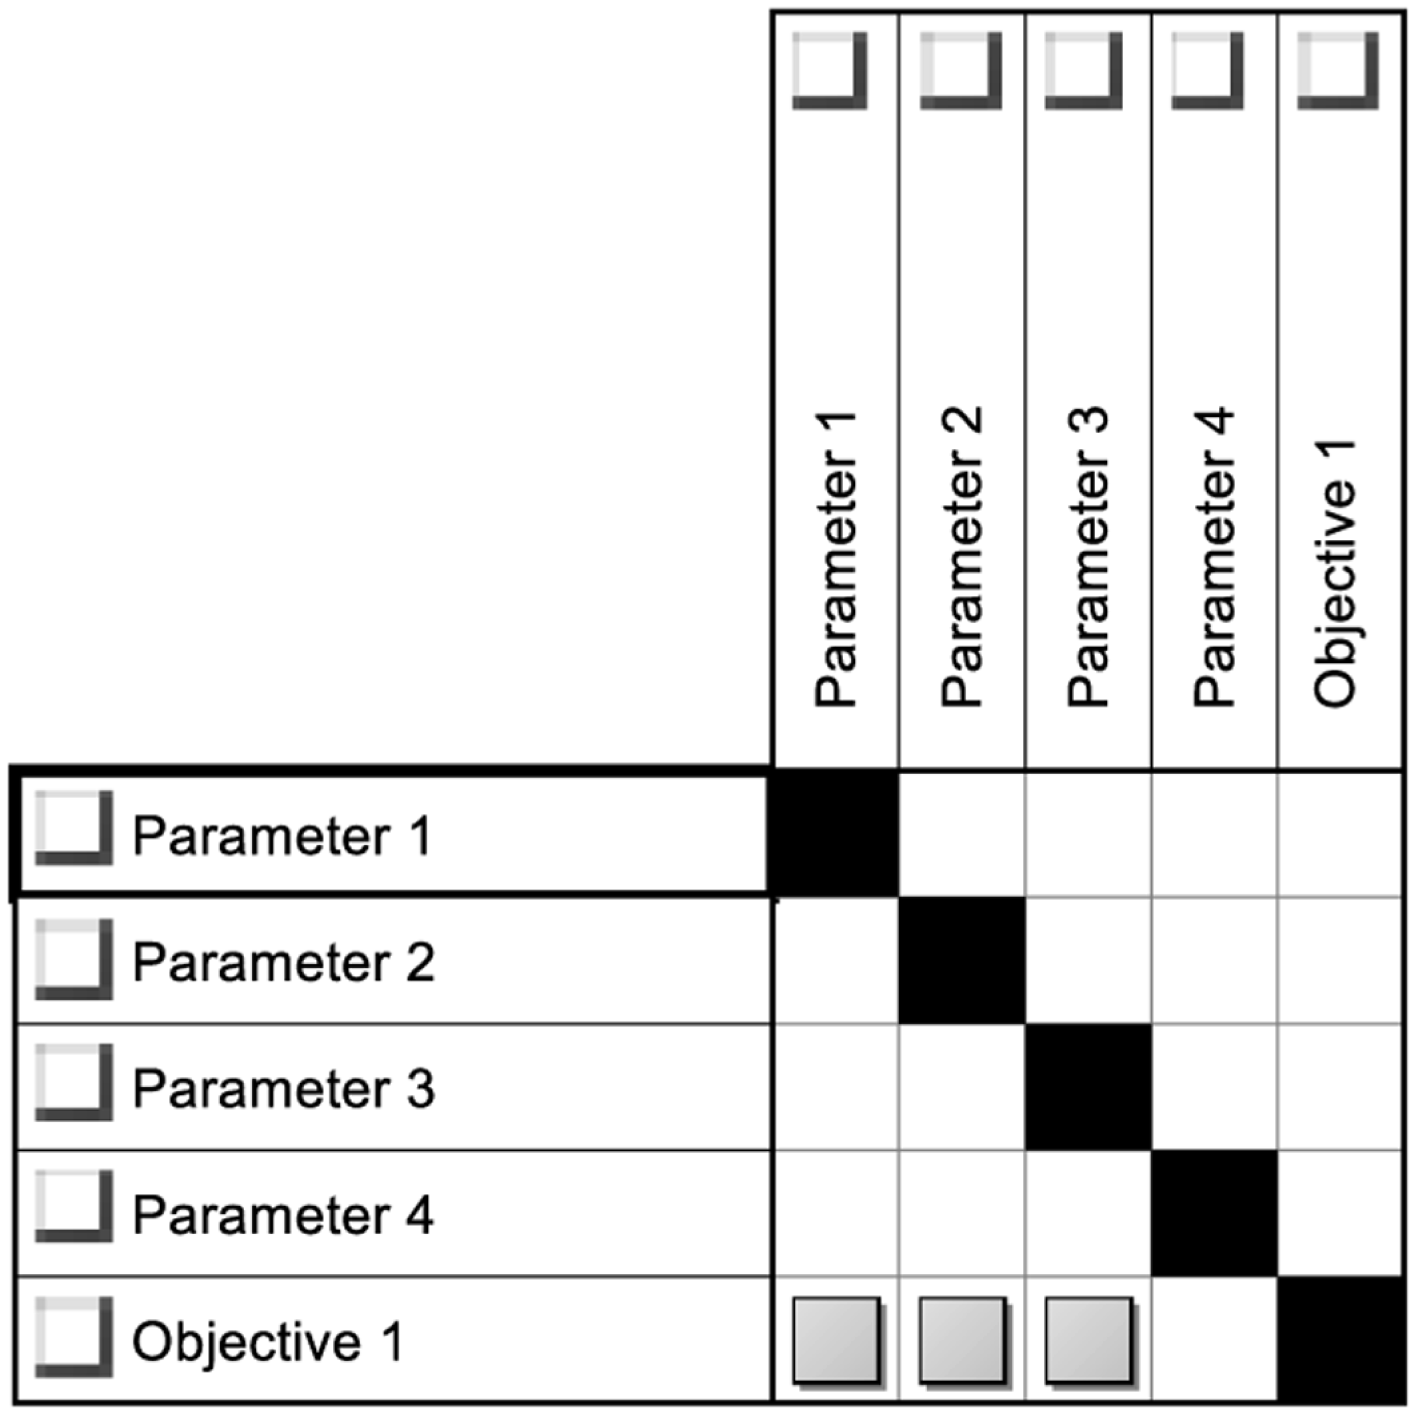
Figure 8. Example of a DSM for identifying active and dormant parameters.
Figure 8 presents a simple DSM example of a system with four design parameters and one optimisation objective. At this stage, the interdependencies between the design parameters are not being consider, instead only the parameters that directly affect the objective are considered. It becomes immediately apparent that only the first three design parameters are affecting the optimisation objective and not the 4th one. This makes the first three parameters active and the last one dormant.
This means that configurations that share the same options for the first three design parameters will yield the same optimisation results. Any variation in the 4th parameter will not alter the outcome of the optimisation process. It is worth noting however that even though the 4th parameter is dormant for this specific objective, it might affect the system in other ways, such as performance or optimisation objectives in future iterations.
In the case of multiobjective optimisation a number of non-dominated solutions will emerge for each configuration, thus expanding the design space around each one, but also providing alternatives for each configuration. In the case where a selected configuration has to undergo design changes at a later stage due to a change in requirements, there are alternative solutions to select from. This can reduce or even eliminate the need for major redesigns and subsequently the cost of the rework.
Further simulations can take place for each configuration, to obtain performance metrics for the value drivers at each iteration. A value driver is anything that adds value to the final product or system and tends to be a measurable objective (Isaksson et al. Reference Isaksson, Kossmann, Bertoni, Eres, Monceaux, Bertoni, Wiseall and Zhang2013). A useful measurement of performance is the use of penalty weights for each option. Depending on the system in consideration, each option can have penalties with regards to complexity, cost, or weight. Penalties are usually assigned on a range from 1 to 10, with 10 being the highest, and are primarily knowledge-based. Adding up the penalties for the selected options of each subsystem that make up the configuration, will give a metric of how costly (for example) that configuration would be compared to others. Such an approach will benefit the early stages of design decision-making for use in trade studies where a fast approach is required due to the large number of configurations being considered.
After the set of feasible and desirable configurations has been narrowed down, the computational power can be transferred to the remaining active configurations where it can now be utilised for a more detailed evaluation of them. This allows for new performance metrics to be introduced and more detailed simulations to take place.
The iterative step is performed repeatedly until the desirable number of configurations have remained, which by this stage will have been matured enough and evaluated thoroughly against the other options. At each iteration new objectives, performance metrics, and value drivers are introduced. The process of the second stage assists in selecting configurations that are optimised, potentially more robust, and have available alternatives in case of a change in requirements.
4 Aircraft fuel system
The main function of the fuel system in an aircraft, as defined by the European Aviation Safety Agency (2016), is to ensure a fuel flow at the correct rate and pressure to the engines under all probable operating conditions. It comprises a complex network of pipes, pumps, connectors, sensors and valves. As with any aircraft system, safety is a priority, especially in this case, where flammable fuel is being considered. In order to ensure the reliability and safe operation of the system, there are a number of things that need to be taken into consideration, such as the flammability and pressurisation of the tanks.
The system can be broken down in several subsystems, each with its own function. The geometric characteristics of the wing will define the available volume in the wingbox, which will then define the shape and size of the tanks. The tank location and size is then used to design the subsystems, all the while taking into consideration the higher level requirements such as the aircrafts intended mission. Gavel (Reference Gavel2007) demonstrated an approach to designing military aircraft fuel systems. In his research, Gavel used a morphological matrix to create combinations between subsystems and form alternative system configurations.
One of the essential subsystems of the fuel system is the venting system. Pressurisation of the tanks due to climb, descend and refuelling, needs to be avoided, as it can create large forces on the wing structure and tank walls. The main function of the venting system is to connect the ullage (empty space within a tank above fuel level) with the outside air to prevent large pressure differences. The vent lines (pipes) start at the top of each tank, and end at the surge tanks located at the wing tips, which are connected to the outside air. The purpose of the surge tank is to collect any fuel that might have entered the vent lines, and return it to the main fuel tanks. If the surge tank overflows, fuel is dumped overboard. When the system is being designed, the main driver is the consideration and ability for the system to handle maximum descend cases. In cases such as loss of cabin pressure where the aircraft needs to descend rapidly to a breathable altitude, the venting system must be able to handle the large mass flow rate of air in order to avoid large pressure differences between the tank and the atmosphere (Langton et al. Reference Langton, Clark, Hewitt and Richards2009).

Figure 9. Typical configuration of an aircraft vent system.
Another major safety concern that needs to be addressed is the flammability of the ullage due to the combination of fuel vapours and oxygen concentration. The centre tank has a much higher risk of fuel vapour combustion since in most cases it has little to no fuel (the first tank to consume fuel from) creating a large, highly combustible, ullage. Due to its location being in the fuselage, it does not benefit from airstream cooling the same way wing tanks do, further increasing the risk factor.
To reduce the oxygen concentration in the ullage (and hence the possibility of combustion), an inerting system must be present in the centre tank. The purpose of the inerting system is to inject Nitrogen Enriched Air (NEA) into the ullage which reduces the oxygen concentration. This is done by forcing oxygen out of the tank through the vent lines. Nitrogen is an inert gas therefore not combustible. EASA defines a tank as inert when the oxygen concentration in the ullage is 12% or less (European Aviation Safety Agency 2016).
5 Case study definition
To demonstrate the process of the ADOPT framework, a computational model of it has been developed. The design of an aircraft fuel system is used as a case study to show how each step is performed.
Since ADOPT integrates a number of different approaches, methods and tools, various computational tools and software are employed to develop the framework computationally.
A number of assumptions are made for the case study that concern primarily the geometry of the aircraft:
(i) The wings are untwisted, tapered and swept with straight leading and trailing edges.
(ii) The resulting shape of the wing will be trapezoidal with the root and tip chord being parallel.
(iii) A part of the chord, both at leading and trailing edges, at any spanwise location is used for high lift devices, hence not considered for the wingbox volume calculations.
(iv) The upper and lower surfaces of the wing (and the wingbox) are assumed to be flat.
(v) The structural semispan of the wing is assumed to lie on the quarter-chord line.
(vi) Wing tank cells (where more than one present) are equal in volume.
(vii) The volume taken up by the internal structure is not considered.
(viii) The width of the carrythrough structure equals the diameter of the fuselage.
(ix) The length of the vent pipeline on each wing is equal to the structural semispan of the wing.
(x) The radius of the venting pipe is 0.05 m.
5.1 Design parameters
5.1.1 Aircraft level parameters
The high-level system considered here is concerned with the geometry, material, and engines of the aircraft. For continuous parameters, the ranges are knowledge-based and obtained from historical data (Ardema et al. Reference Ardema, Chambers, Patron, Hahn, Miura and Moore1996; Jenkinson Reference Jenkinson1999). Table 1 presents the design parameters of the aircraft level.
Table 1. Aircraft level design parameters
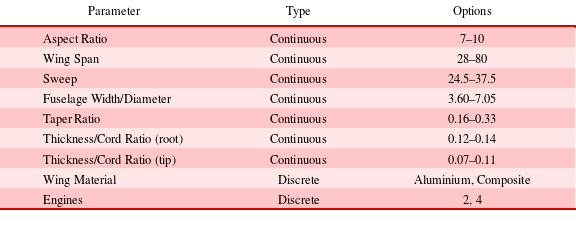
Out of the seven continuous parameters, three of them (taper ratio and thickness/cord ratios) will not be discretised in order to generate the configurations. Instead, all the configurations will share the same ranges for those three parameters and consequently will have the same bounds for optimisation. This is due to their small range and small effect on the result, compared to the rest.
5.1.2 System level parameters
As opposed to the aircraft level that comprised of both continuous and discrete parameters, the fuel system level is entirely comprised of discrete parameters. The parameters are primarily with regards to the fuel tanks configuration and subsystem options. Table 2 shows the design parameters of the level with their respective options.
Table 2. Fuel system level design parameters
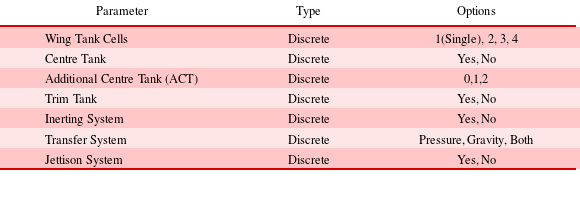
The venting system is a mandatory subsystem but has no options, which is the reason why it is not included in the table. It is also a subsystem that is defined and sized according to the rest of the design parameters.
5.2 Matrix view of the system
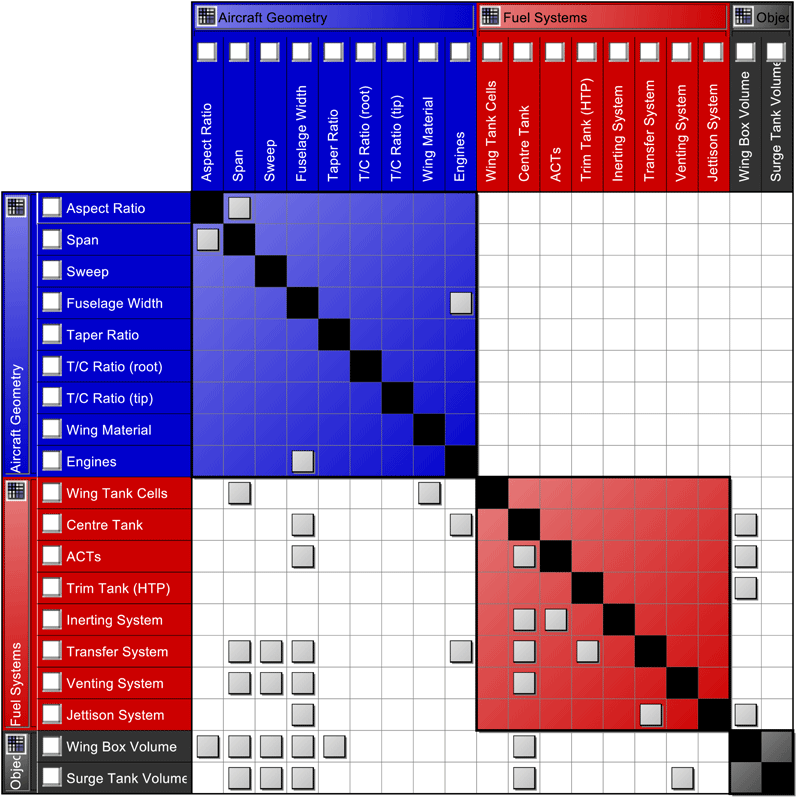
To create a model of the system network, the connections and design dependencies need to be visualised within and between the different levels of the system. Matrix methods can be employed to achieve that. Figure 10 presents a DSM representation of the overall system and the interconnections between the design parameters.

Figure 10. DSM view of the system.
It is important to notice that some of the connections represent design dependencies while others represent constraints that involve the two connected elements. For example the connections with the wing tank cells element, are both design dependencies, since the number of tank cells are dependent on the length of the span and the material of the wing. On the other hand, the mirrored connections between span and aspect ratio, represent a constraint between the two elements. The constraints considered for this case study are further explained at a later section.
The DSM can assist in identifying elements that have a large design impact on the rest of the system, but can also identify elements that are highly dependent on others. This can assist in the case of sequential design, where for example, the design of the transfer system is affected by six other elements, but only has an impact on the design of the jettison system since they usually share the same pipelines.
5.3 Generation of configurations
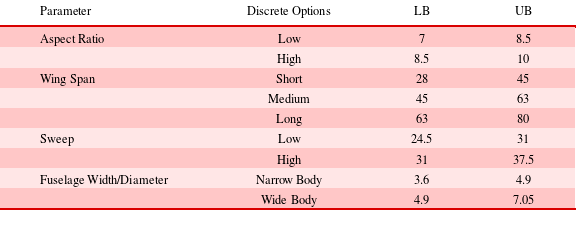
After the system has been elaborated down to its design parameters and elements, and the options for each one have been identified, the concept generation begins. In order to generate a finite number of all possible configurations, all the continuous parameters need to be discretised into ranges and assign a linguistic term to each one. The number of ranges that each continuous parameter is split into, depends on a number of factors including the type of parameter and the size of the range. Table 3 presents how the continuous parameters are discretised for the current case study.
Table 3. Discretisation of continuous parameters (LB: Lower Bound; UB: Upper Bound)
5.4 Stage 1 Constraints
5.4.1 Infeasibility Constraints
Infeasibility constraints are meant to remove configurations that are either completely impossible to be implemented and/or manufactured, or even if they could be, they would yield highly undesirable results that would not change in the future even with further research. These kind of constraints are imposed at two stages, as previously mentioned. The first stage is at each level independently, in this case, the geometry level has some specific infeasibility constraints, and the fuel system has its own independent constraints. The second stage is with regards to the combined configurations from the different levels of the system, i.e. a constraint between the element of one level and another element from a different level.
With the design parameters under consideration, the following constraints are imposed:
(i) A centre tank is present without an inerting system. This would violate safety regulations.
(ii) No centre tank but one or more ACTs. ACTs can only be present with a main centre tank (hence the ‘Additional’ in ACT).
(iii) No centre tank with an inerting system present. That would render the inerting system useless since wing tanks do not require inerting.
(iv) Narrow body with four engines. Even though this could go under the undesirability constraints, no narrow-body aircraft has four engines since it adds unnecessary complexity, weight, and it is not as efficient.
(v) A gravity-only transfer system with a trim tank present. A pressure system needs to be present for transferring fuel between the trim and wing tanks regardless of the aircraft’s attitude.
(vi) A gravity-only transfer system with more than one wing tank cell. A pressure system needs to be present in order to transfer fuel outboard for load alleviation purposes and to the engine feed tanks.
(vii) A gravity-only transfer system with a centre tank present. The transfer system needs to be able to transfer fuel from the centre tank to the wing tanks, which requires a pressure-based system.
(viii) A single wing tank cell with four engines. Each engine needs to have its own feed tank which entails the need for more than one cell on each wing.
Any configuration that has any of the above features, is considered infeasible, and is discarded.
5.4.2 Undesirability Constraints
A number of configurations might evidently, and due to previous knowledge, yield undesirable results. However this might be due to technological limitations or other factors that might not be present at a future stage. Undesirability constraints aim to remove configurations that fall under that category but without discarding them completely. Undesirable configurations get stored in a separate database for future evaluations but do not proceed to the second stage of the framework.
The undesirability constraints that are imposed after the combination of the system-specific configurations are:
(i) A composite wing with more than one wing tank cell, increases the complexity unnecessarily. Composite wings do not require wing load alleviation since they do now suffer from structural fatigue the same way aluminium ones do.
(ii) An aluminium wing, with long span and just one wing tank cell. Due to the large span, wing load alleviation mechanisms, using the wing tank cells, are highly desirable in order to reduce the fatigue of the wing.
(iii) A narrow-body aircraft with a trim tank. Smaller aircraft, in the narrow-body range, does not usually require a trim tank. Therefore, having a trim tank would unnecessarily increase both weight and complexity.
(iv) A narrow-body aircraft with a jettison system. Jettison systems are only found in large, wide-body aircraft where the MLW is substantially less than the MTOW.
5.5 Identification of configurations
In order to manage and identify the configurations easily, a configuration ID is assigned to each one. The IDs comprise the initials of the options for each design parameter, forming a string of characters. Table 4 shows the initials corresponding to each option.
Table 4. Initials for configuration IDs
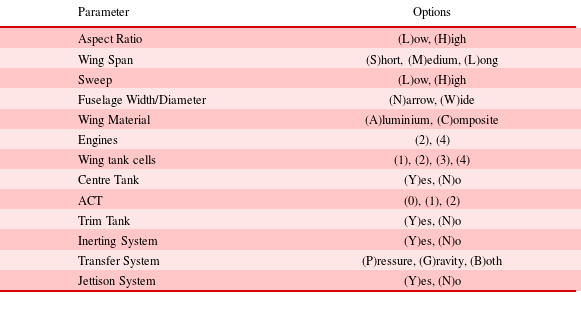
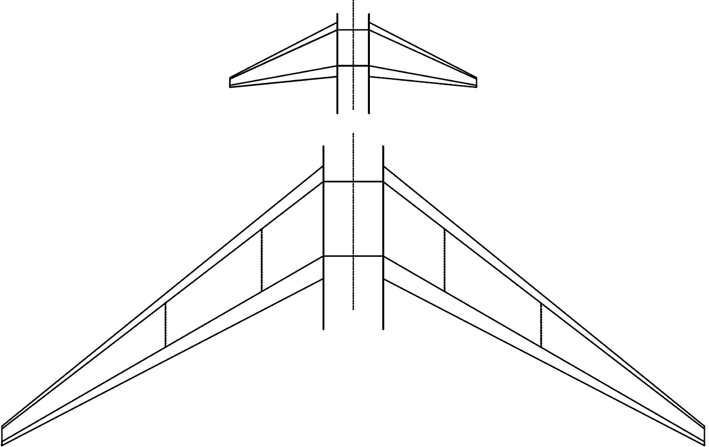
Following the table above, the unique identification number (configuration ID), can be synthesised for each configuration. In the case of a (L)ow aspect ratio, (S)hort span, (L)ow sweep angle, (N)arrow body, (A)luminium wings, (2) Engines, (1) wing tank cell, (Y)es to a centre tank, (0) ACTs, (N)o Trim tank, (Y)es to an inerting system, (B)oth a gravity and pressure transfer system, and (N)o Jettison system would yield the configuration ID LSLNA21Y0NYBN. A schematic representation of the above configuration and a configuration of the other extreme (high aspect ratio, long span, etc.) is shown diagrammatically in Figure 11.
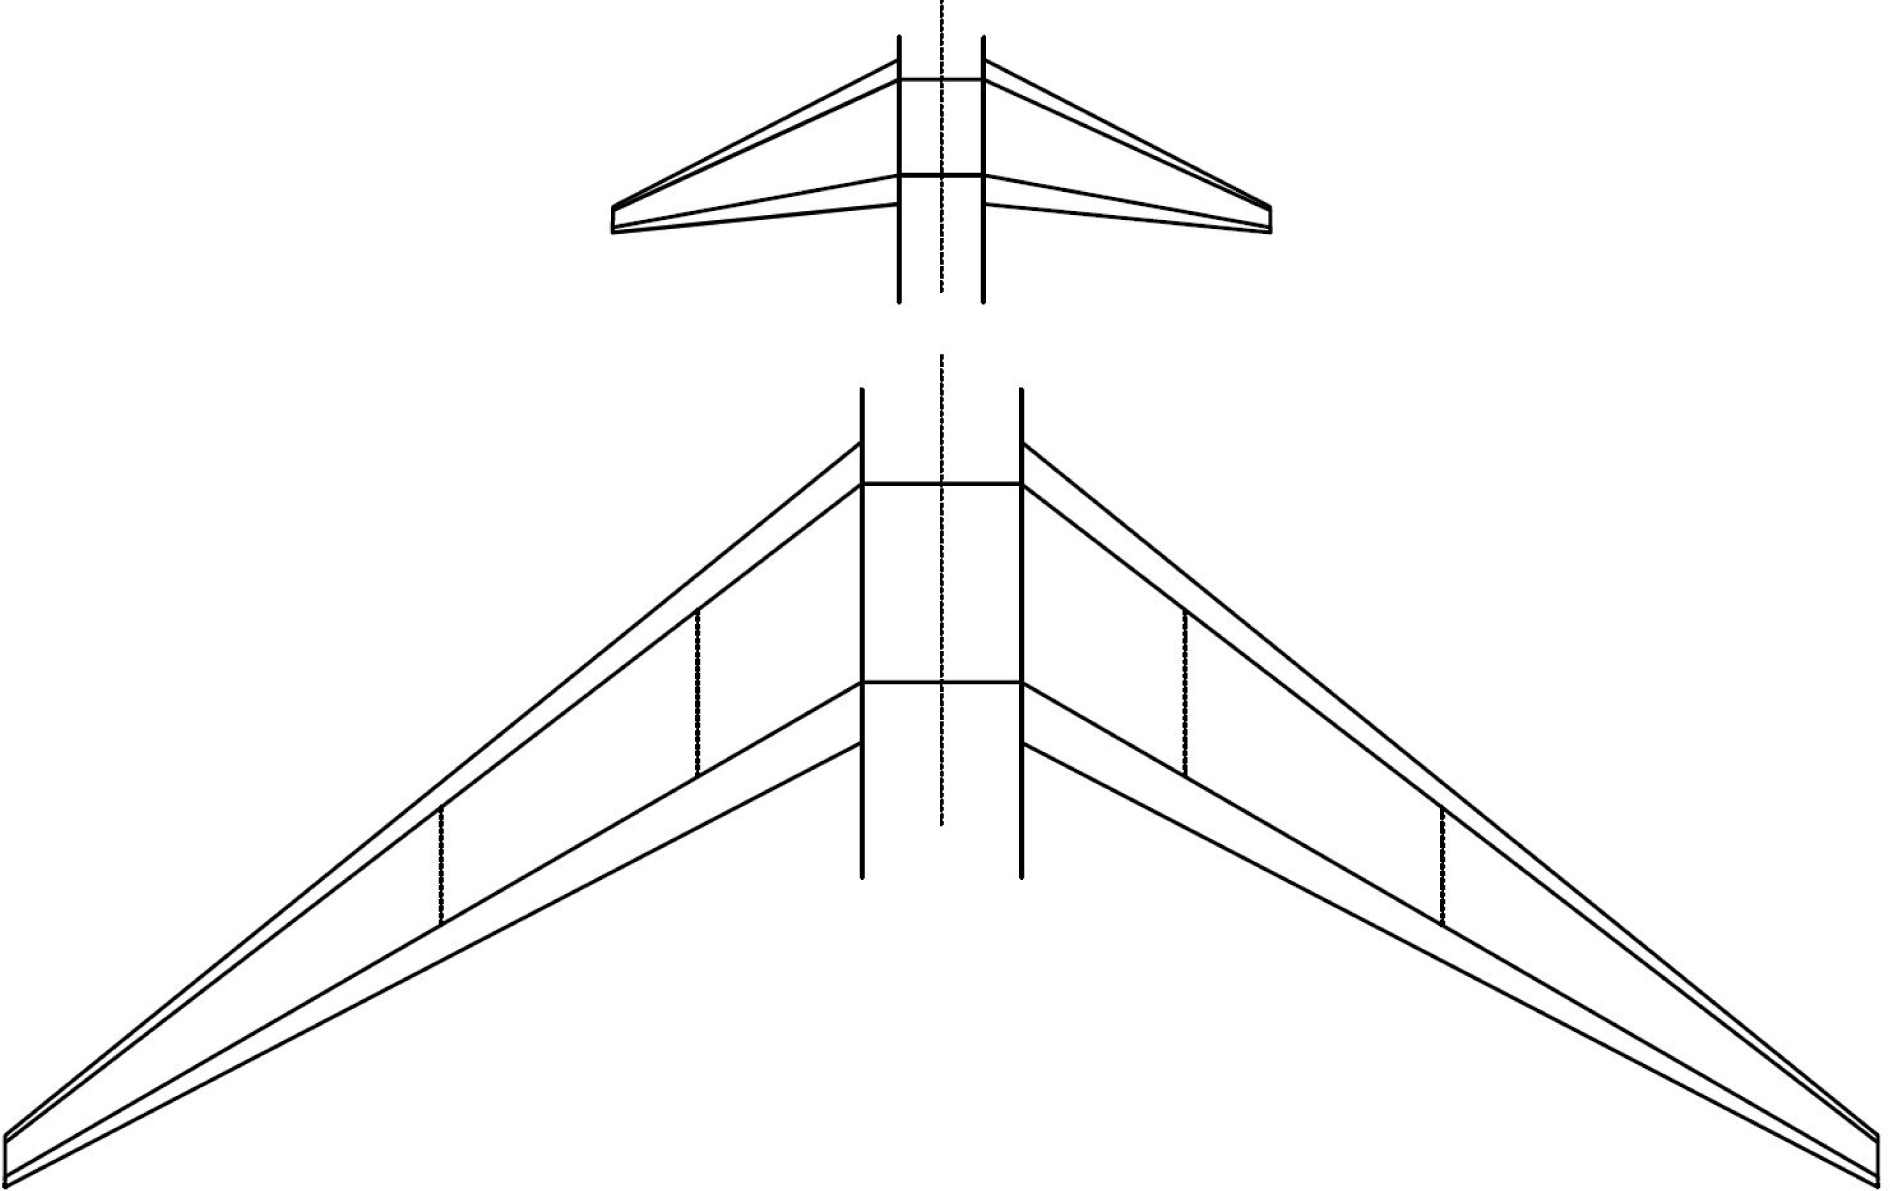
Figure 11. Scaled representation of the LSLNA21Y0NYBN and HLHWA23Y0NYBN configurations.
The approach used here with the initials of each option, is useful for this application area where a relatively small number of parameters is considered. Larger and more complex systems would require an alternative approach, such as a machine-readable ID, rather than a human-readable one which is used in this example.
5.6 Optimisation
The most important step of the second stage of the framework is the optimisation process. The step aims to explore the confined design-space areas for each configuration and find the optimum or the non-dominated solutions for each one. In this case study, two objectives are considered to demonstrate the trade-off in multiobjective optimisation when considering competing objectives.
Before the optimisation process takes place, the design parameters that were previously discretised, need to be reverted back to their continuous ranges. Those ranges become the optimisation constraints for each continuous parameter. Following the discretisation in Table 3 each configuration defines its constraints using the ranges previously selected. In this case, a low aspect ratio configuration, will have its Lower Bound (LB) at 7 and its Upper Bound (UB) at 8.5 for the aspect ratio variable. Any value above 8.5 would violate the constraints since it falls into the high aspect ratio area where other configurations lie.
5.6.1 Wingbox volume calculation
One of the objectives for optimisation is to maximise the volume of the wingbox. The larger the volume, the more fuel can be stored in the wing. To calculate the volume, an analytical approach is used as presented in the NASA technical memorandum by Ardema et al. (Reference Ardema, Chambers, Patron, Hahn, Miura and Moore1996).
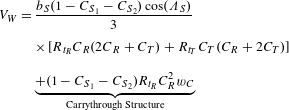 $$\begin{eqnarray}\displaystyle V_{W} & = & \displaystyle \frac{b_{S}(1-C_{S_{1}}-C_{S_{2}})\cos (\unicode[STIX]{x1D6EC}_{S})}{3}\nonumber\\ \displaystyle & & \displaystyle \times \,[R_{t_{R}}C_{R}(2C_{R}+C_{T})+R_{t_{T}}C_{T}(C_{R}+2C_{T})]^{\phantom{\frac{1}{2}}}\nonumber\\ \displaystyle & & \displaystyle \nonumber\\ \displaystyle & & \displaystyle \underbrace{+(1-C_{S_{1}}-C_{S_{2}})R_{t_{R}}C_{R}^{2}w_{C}}_{\text{Carrythrough Structure}}\end{eqnarray}$$
 $$\begin{eqnarray}\begin{array}{@{}rcll@{}}A\,\, & =\,\, & {\displaystyle \frac{b^{2}}{AR}}\quad & b_{S}={\displaystyle \frac{b-w_{C}}{2\cos (\unicode[STIX]{x1D6EC})}}\\ C_{R}^{\prime }\,\, & =\,\, & {\displaystyle \frac{2A}{b(1+TR)}}\quad & C_{T}=TR\times C_{R}^{\prime }\\ C_{R}\,\, & =\,\, & C_{R}^{\prime }-{\displaystyle \frac{w_{C}}{b}}(C_{R}^{\prime }-C_{T})\quad & \end{array}\end{eqnarray}$$
where
![]() $V_{W}$
is the wingbox volume,
$V_{W}$
is the wingbox volume,
![]() $b_{S}$
is the structural semispan of the wing,
$b_{S}$
is the structural semispan of the wing,
![]() $C_{S_{1}}$
is the unusable part of the leading edge as a percentage of the chord,
$C_{S_{1}}$
is the unusable part of the leading edge as a percentage of the chord,
![]() $C_{S_{2}}$
is the unusable part of the trailing edge as a percentage of the chord,
$C_{S_{2}}$
is the unusable part of the trailing edge as a percentage of the chord,
![]() $\unicode[STIX]{x1D6EC}_{S}$
is the sweep angle of the structural span at quarter-chord line,
$\unicode[STIX]{x1D6EC}_{S}$
is the sweep angle of the structural span at quarter-chord line,
![]() $R_{t_{R}}$
is the thickness-to-chord ratio at root,
$R_{t_{R}}$
is the thickness-to-chord ratio at root,
![]() $R_{t_{T}}$
is the thickness-to-chord ratio at tip,
$R_{t_{T}}$
is the thickness-to-chord ratio at tip,
![]() $C_{R}$
is the root chord of wing at fuselage intersection,
$C_{R}$
is the root chord of wing at fuselage intersection,
![]() $C_{T}$
is the tip chord,
$C_{T}$
is the tip chord,
![]() $w_{C}$
is the width of the carrythrough structure of the wing,
$w_{C}$
is the width of the carrythrough structure of the wing,
![]() $A$
is the area of the wing,
$A$
is the area of the wing,
![]() $AR$
is the aspect ratio,
$AR$
is the aspect ratio,
![]() $b$
is the span if the wing,
$b$
is the span if the wing,
![]() $C_{R}^{\prime }$
is the theoretical root chord and
$C_{R}^{\prime }$
is the theoretical root chord and
![]() $TR$
is the taper ratio. Some of the aforementioned parameters are shown in Figure 12.
$TR$
is the taper ratio. Some of the aforementioned parameters are shown in Figure 12.
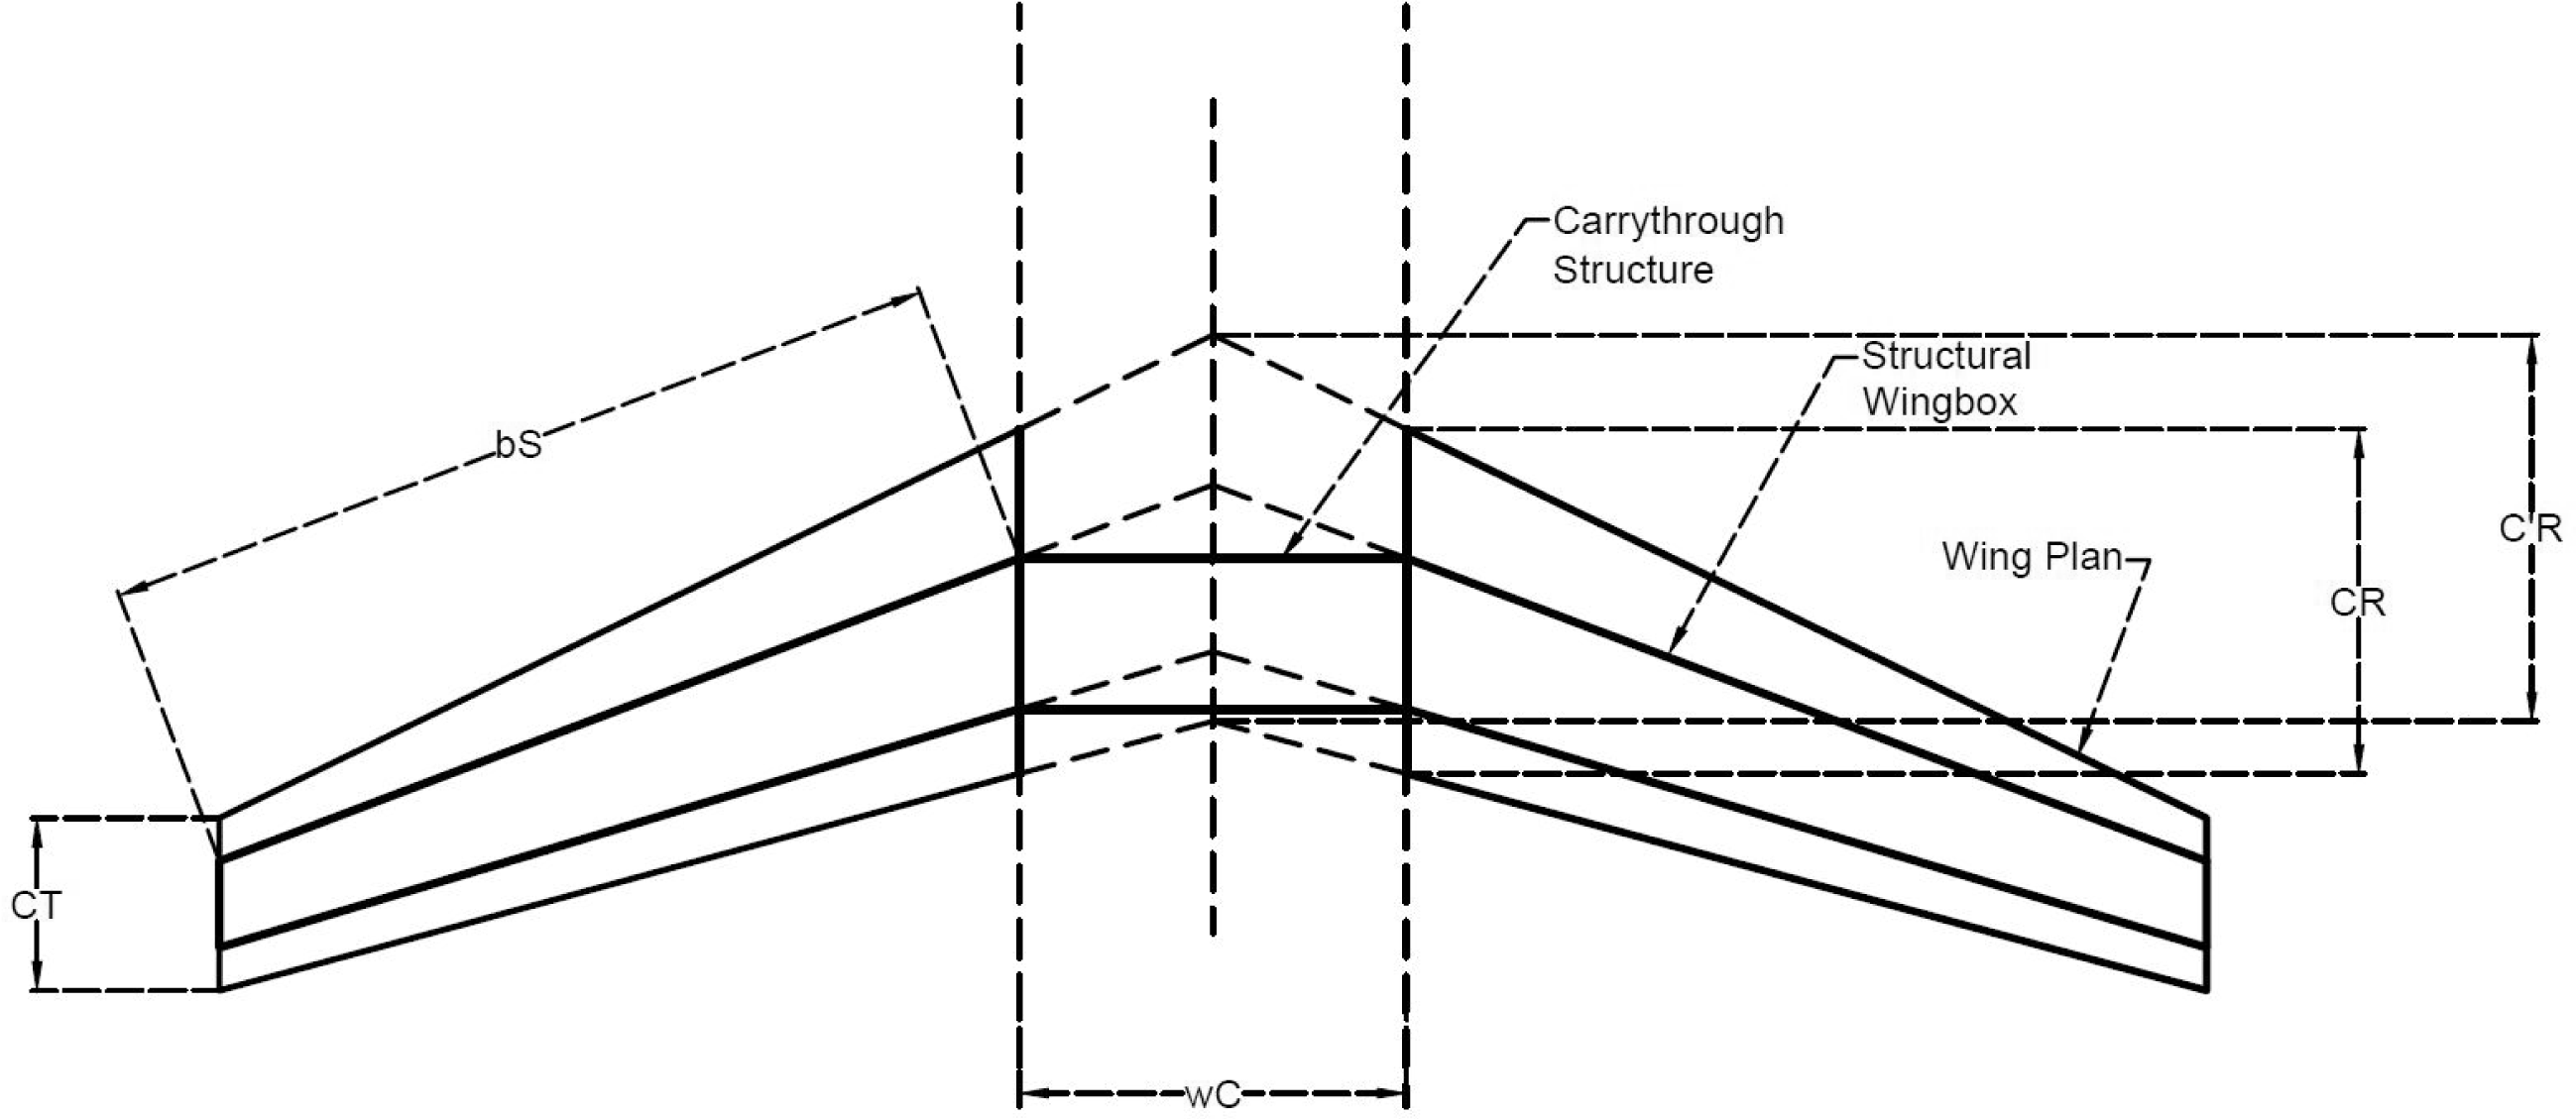
Figure 12. Structural wingbox and carrythrough structure.
We consider the centre tank volume equal to the volume of the carrythrough structure. Therefore, the second part of the equation for the carrythrough, becomes zero for the configurations where no centre tank is present.
Each configuration has different bounds for the aspect ratio, wing span, sweep and the fuselage width, which are defined in the first stage during the generation of the configurations. In order to calculate the wingbox volume using the formula presented above, a number of other variables are required, the bounds of which are shared between all configurations. The three parameters that have the same range are the taper ratio and the thickness/chord ratio for both the tip and the root chord. Furthermore, the unusable parts of the leading and trailing edges,
![]() $C_{S_{1}}$
and
$C_{S_{1}}$
and
![]() $C_{S_{2}}$
, are constant at 0.14 and 0.2, respectively; as a percentage of the chord.
$C_{S_{2}}$
, are constant at 0.14 and 0.2, respectively; as a percentage of the chord.
5.6.2 Surge tank volume calculation
The second objective of the optimisation process is to minimise the volume of the surge tank; it is assumed to be three times the volume of the vent pipe for each wing. For simplification purposes, we assume that the length of the vent pipe is equal to the structural semispan of the wing plus
![]() $10\%$
of the width of the carrythrough structure and the vent pipe has a constant radius of 0.05 m.
$10\%$
of the width of the carrythrough structure and the vent pipe has a constant radius of 0.05 m.
For cases where a centre tank is not present the second part of the equation becomes zero.
5.7 Identification of active and dormant parameters
A DSM is employed to map the dependencies between the design parameters and the optimisation objectives. Using the DSM in Figure 10, two additional elements are added to represent the two objectives. From there on the dependencies can be mapped; using the objective functions and identifying the variables that affect them. Figure 13 shows the expanded DSM.
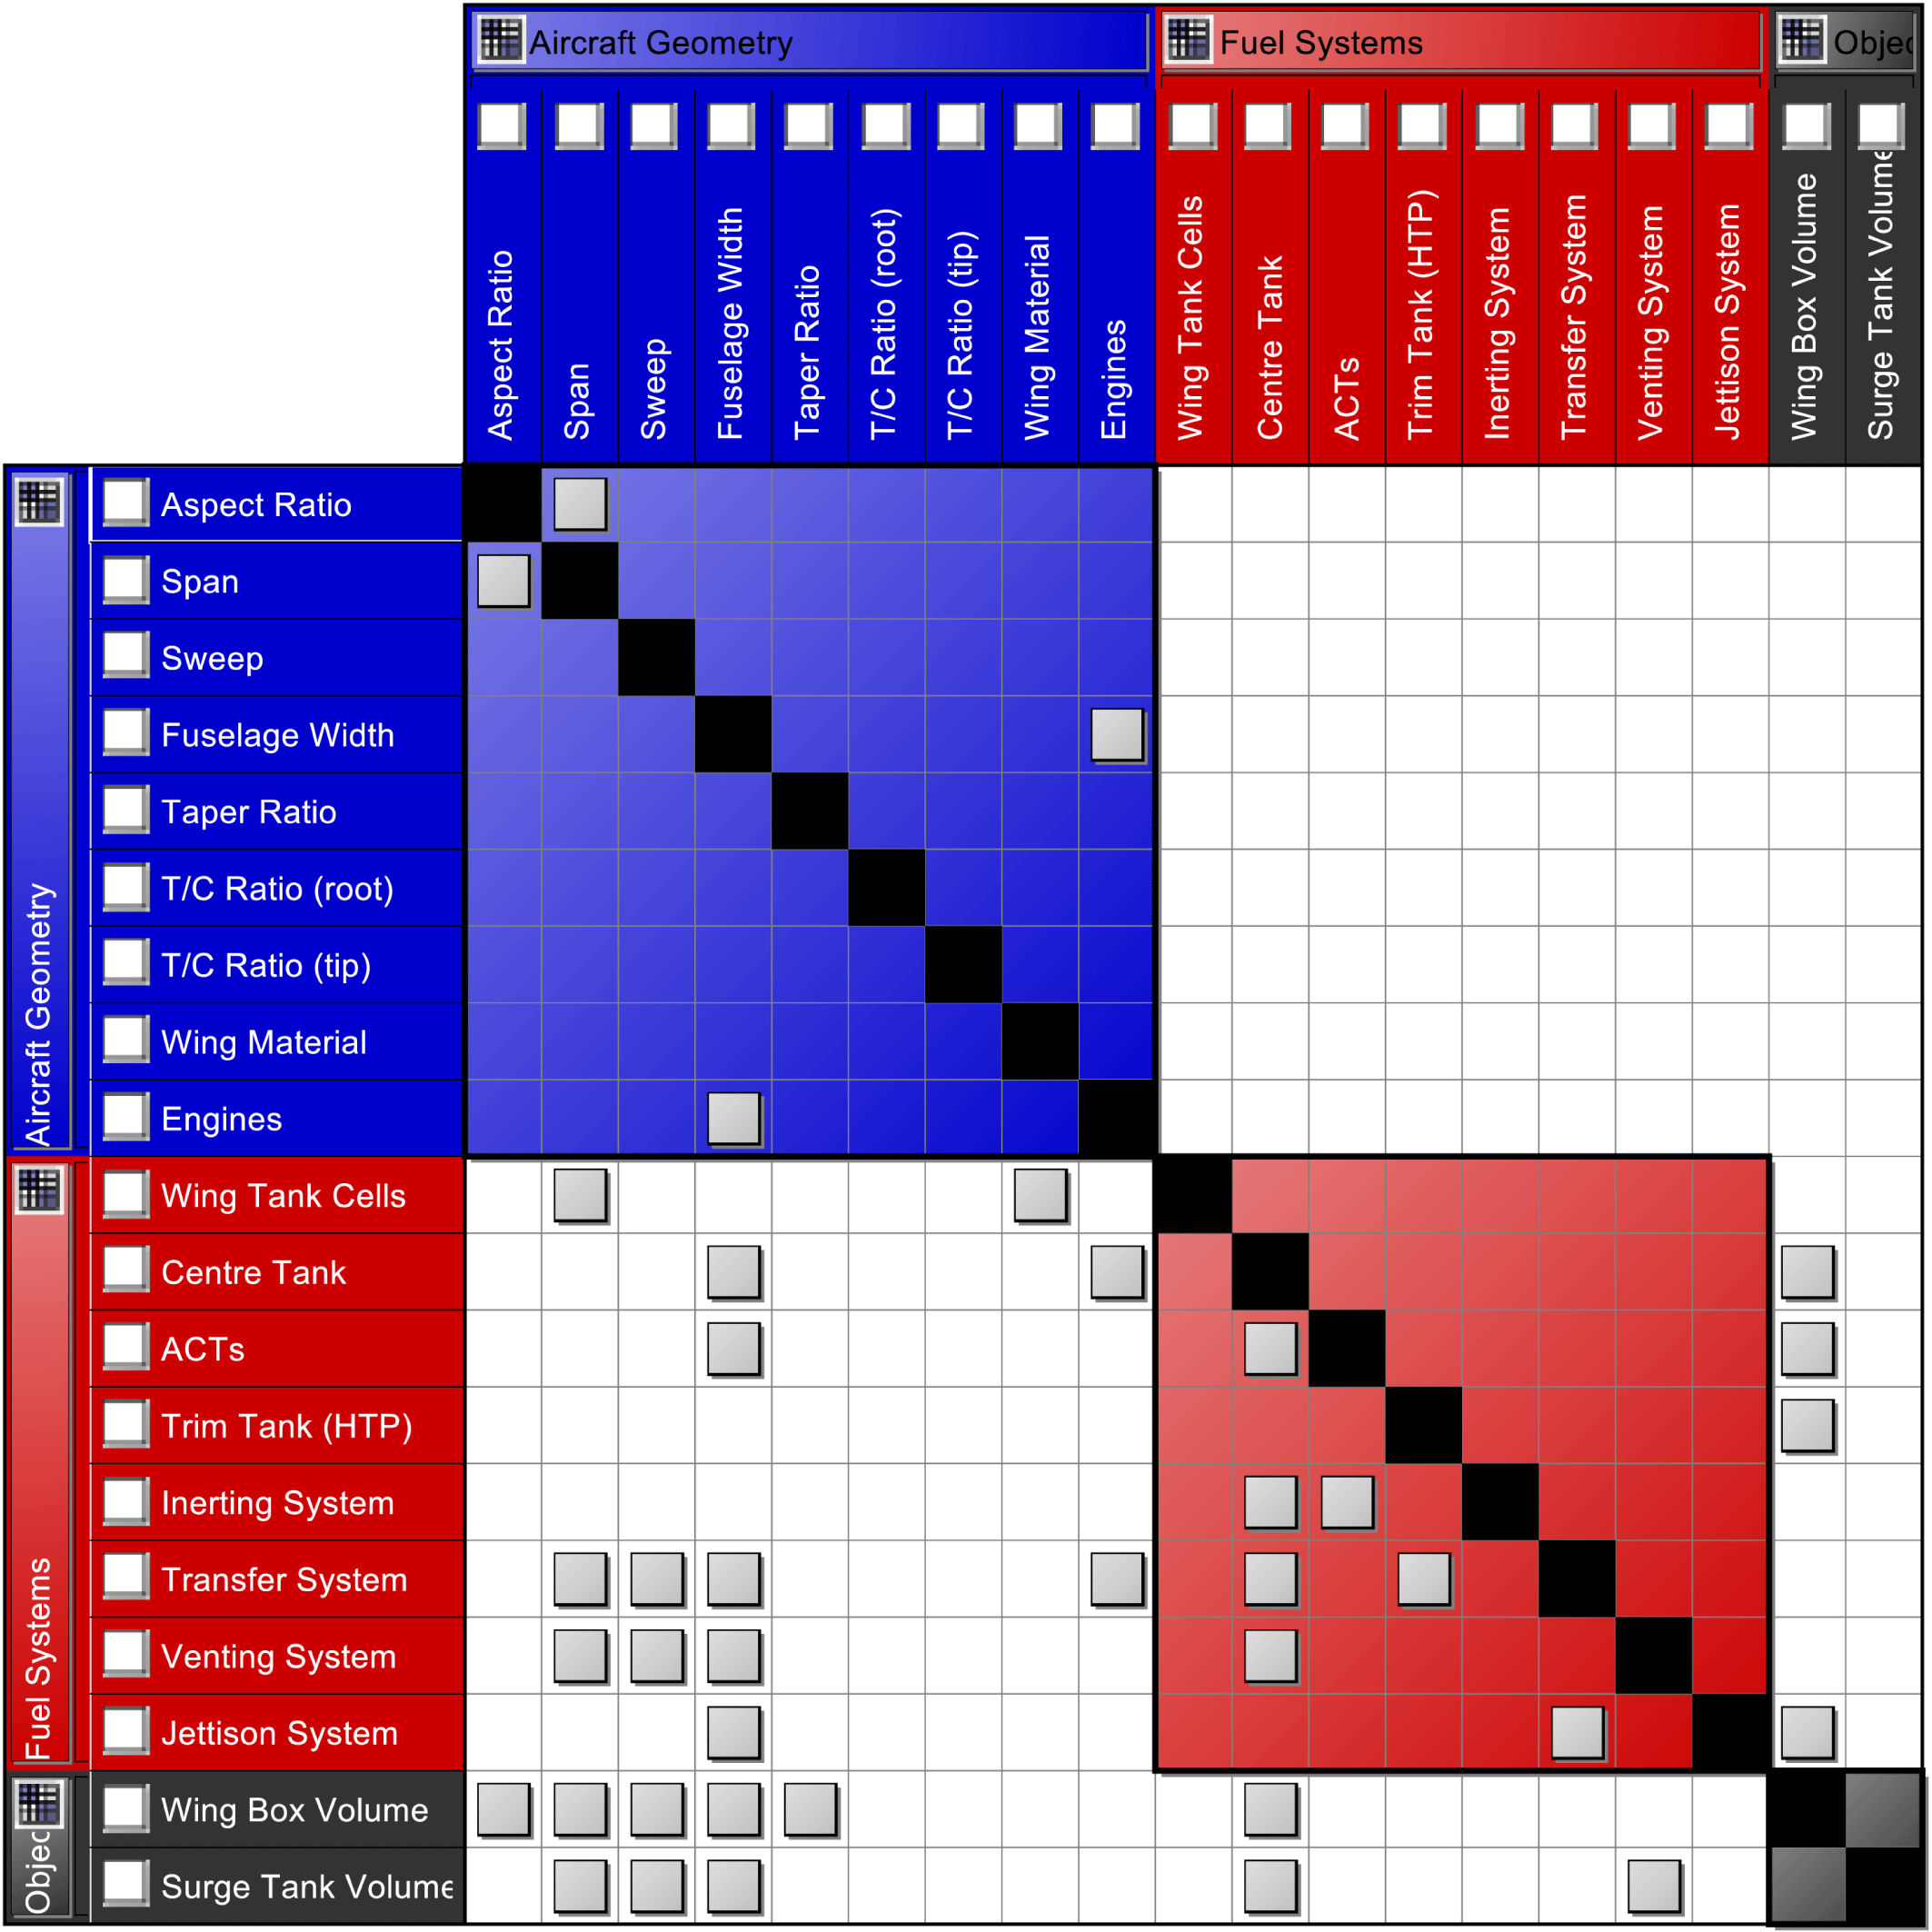
Figure 13. Identification of active parameters for optimisation.
Using Figure 13 the active parameters become clear. For example, any competing configurations that only differ in the number of engines, or the number of ACTs, will have similar optimisation results. The active parameters that do affect the optimisation are:
(i) Span
(ii) Aspect Ratio
(iii) Sweep Angle
(iv) Fuselage width
(v) Taper Ratio (however this is a shared range between all configurations)
(vi) Centre Tank
(vii) Venting System
5.8 Complexity and weight penalties
Following the optimisation process outlined in the previous section, a configuration with a long span, will result in a larger wingbox volume when compared to a configuration with a short span; given that all other design parameters remain the same. However, the long span configuration will result in a heavier structure, amongst other possible drawbacks. Table 5 shows the associated weight and complexity penalties for all options.
Table 5. Penalties for each design parameter option
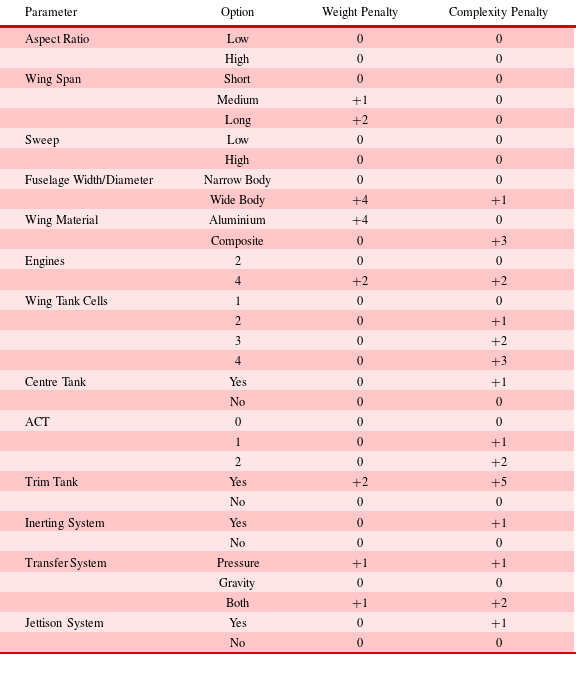
At this stage, two different penalties are considered: weight and complexity. Complexity includes difficulties in design, manufacturing, and maintenance. The penalties are assigned on a range from 0 to 10, with 10 being the most heavy/complex option. The lightest or simplest option of each design parameter always has a zero value for that penalty; for example, a short span wing has a zero weight penalty since it is the lightest of the three options (Short, Medium, Long). When all the configurations have been generated, their total weight and complexity penalties can be calculated; this is done by summing up the penalties of the options that form the configuration. Using this approach provides a fast way to introduce an additional metric with which the configurations can be further assessed.
6 Results
The system in consideration consists of 13 design parameters (not considering the common ones such as the taper ratio), and each design parameter has a number of possible options. To get the total number of possible combinations the number of options of each parameter need to be multiplied between them as shown in Table 6.
Table 6. Calculation of all possible configurations
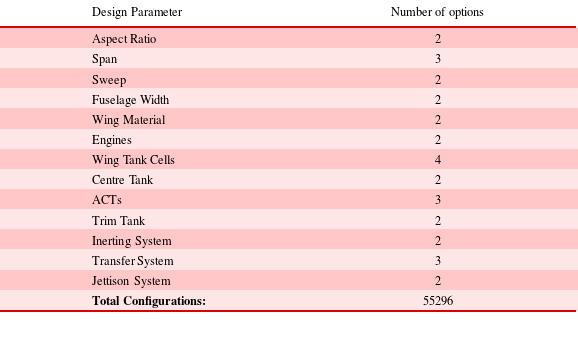
From Table 6 it becomes apparent that even for a small number of design parameters, each with just a few options, the resulting number of possible configurations is very high. Evaluating and optimising 55296 configurations would, in many cases, require a prohibitive amount of time. Even if they could be evaluated in an acceptable time frame, a lot of that time would be wasted as a large number of configurations would be undesirable or infeasible. That wasted time can instead be better utilised by evaluating the feasible configurations in more detail. Furthermore, assessing 55000 configurations would generate a large amount of data that would be difficult to manage.
For this reason, infeasibility and undesirability constraints were imposed to reduce the number of configurations to be evaluated. The sequential reduction in configurations is shown in Table 7 in terms of number of configurations that were filtered out at each step and the reduction percentage of desirable configurations remaining; compared to the previous step.
Table 7. Reduction of configurations due to constraints

Imposing the infeasibility constraints at each level separately (before the configurations of each level are combined), eliminates 41472 configurations bringing the total number down to 13824. The second set of infeasibility constraints, after the configurations of each level have merged, eliminates a further 5280, bringing the number down to 8544. Finally, imposing the undesirability constraints, 5092 configurations are made inactive, leaving 3452 feasible, desirable configurations to be further evaluated. With all constraints taken into consideration, the number of configurations was decreased by 93.7%.
After the first stage of the workflow is completed, the feasible and desirable configurations are retained for further evaluation. The configurations are first checked for active and dormant parameters based on the optimisation objectives, and get reduced to a consolidated list for optimisation.
Using the active parameters allows the desirable configurations to be reduced from 3452 down to just 48 configurations (optimisation clusters) to be optimised. The optimisation IDs that identify each optimisation cluster are the initials for each option of each active parameter. For example, LSLNY stands for (L)ow aspect ratio, (S)hort span, (L)ow Sweep Angle, (N)arrow Body and (Y)es to the presence of a centre tank. Any other configuration that shares those options will also share the same optimisation results.
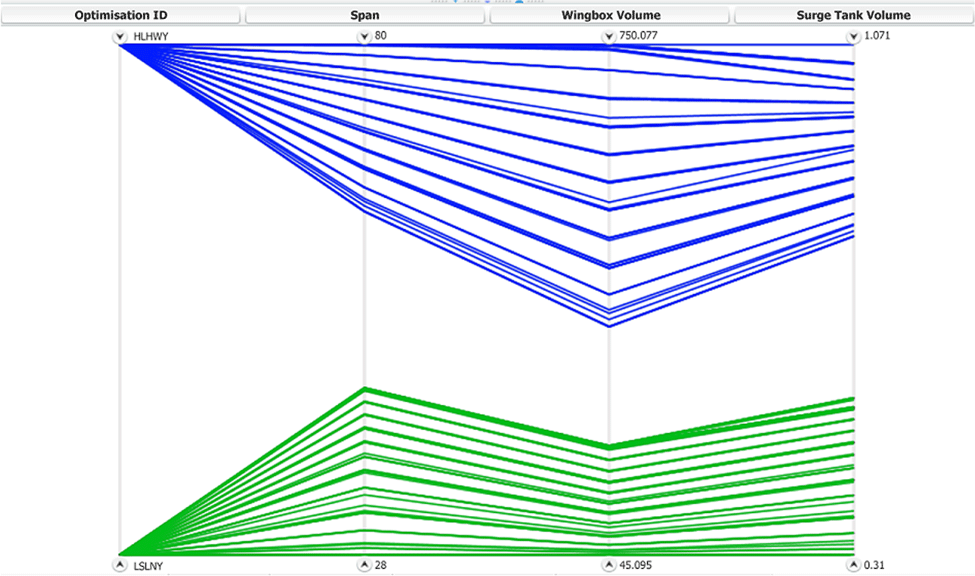
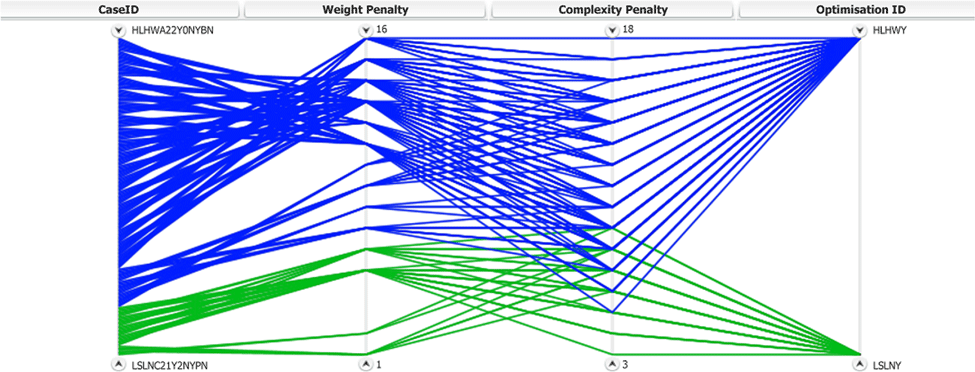
All of the optimisation clusters are processed through the optimisation step. When the process concludes, the results can be visualised using parallel coordinates. Initially, the two extreme optimisation clusters, with IDs LSLNY and HLHWY, are plotted as shown in Figure 14 with green and blue polylines, respectively.

Figure 14. Optimisation results for LSLNY (green) and HLHWY (blue).
Some observations can be made immediately. First, the aspect ratio for all solutions is always at the lowest bound for each configuration. This is logical because for a constant span, the lower the aspect ratio value, the larger the wing area. Therefore, this would result in a bigger wingbox volume and, since span is constant in this case, it does not affect the length of the vent line and consequently the surge tank volume.
In order to examine the relationship between span and the two objectives, the axes of the parallel coordinates graph can be rearranged as required. Figure 15 shows the relationship between span, wingbox volume, and surge tank volume.

Figure 15. Relationship between span and the two optimisation objectives.
The strong correlation between the span and the two objectives becomes quite obvious from Figure 15. Furthermore, it can be demonstrated using scatter plots, such as the one shown in Figure 16.
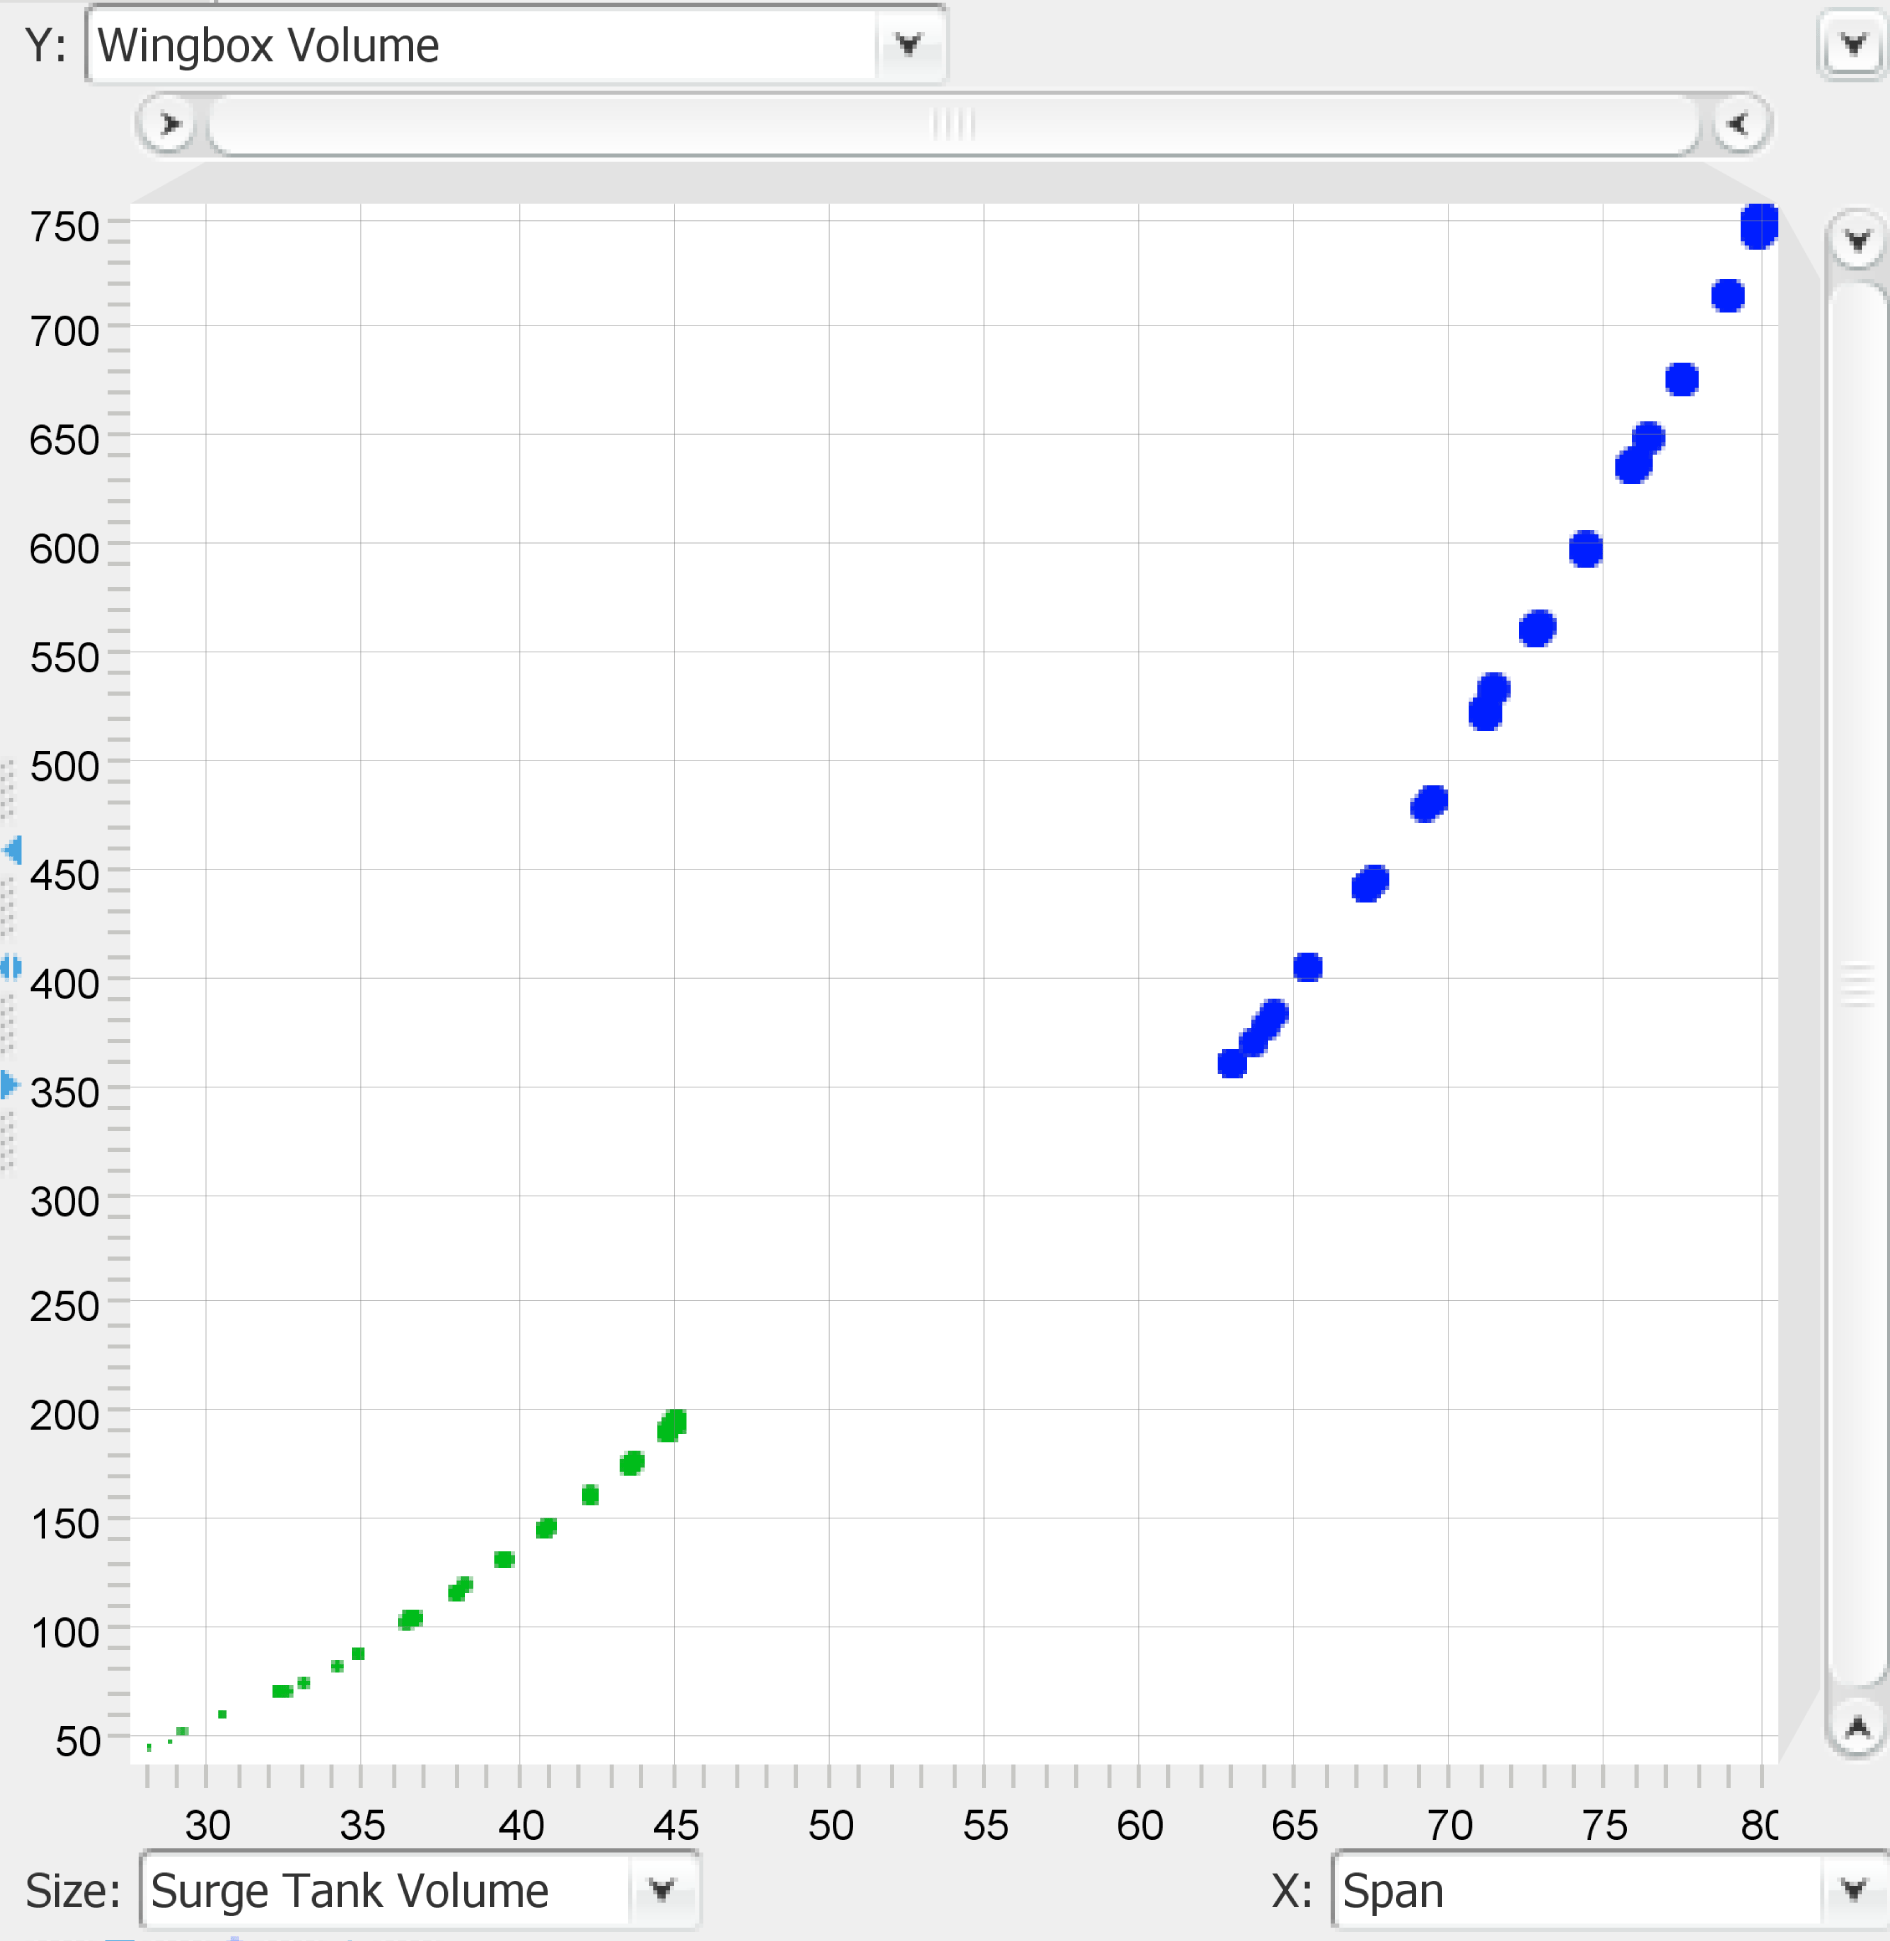
Figure 16. Scatter plot for span versus the wingbox volume (relative sizes of the points indicate relative volume of surge tank).
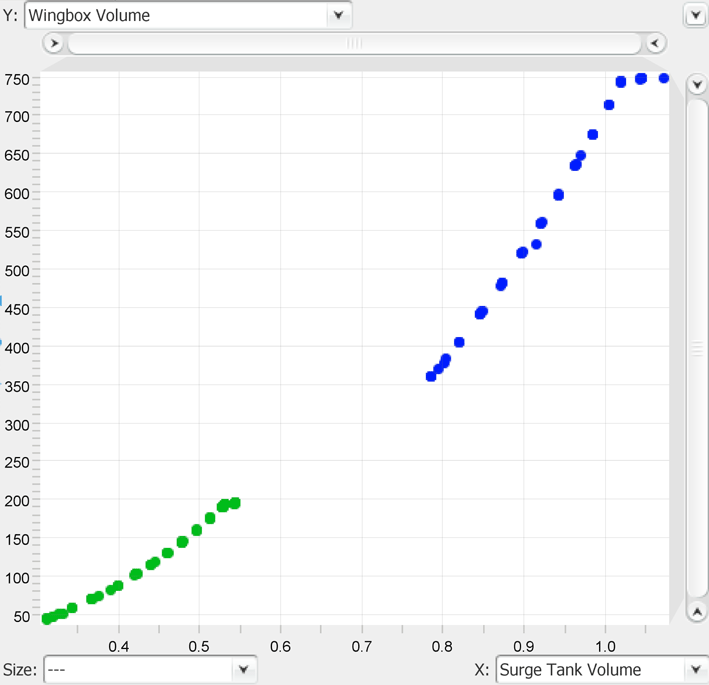
The size of the points in the above scatterplot is dependent on the size of the surge tank volume. Besides the wingbox volume, the surge tank volume also increases with span; this demonstrates the trade-off when dealing with competing objectives in multiobjective optimisation.
Plotting the optimisation objectives between them on a scatter plot allows the Pareto front to be visualised as shown in Figure 17. The trade-off between the two objectives becomes even more evident.
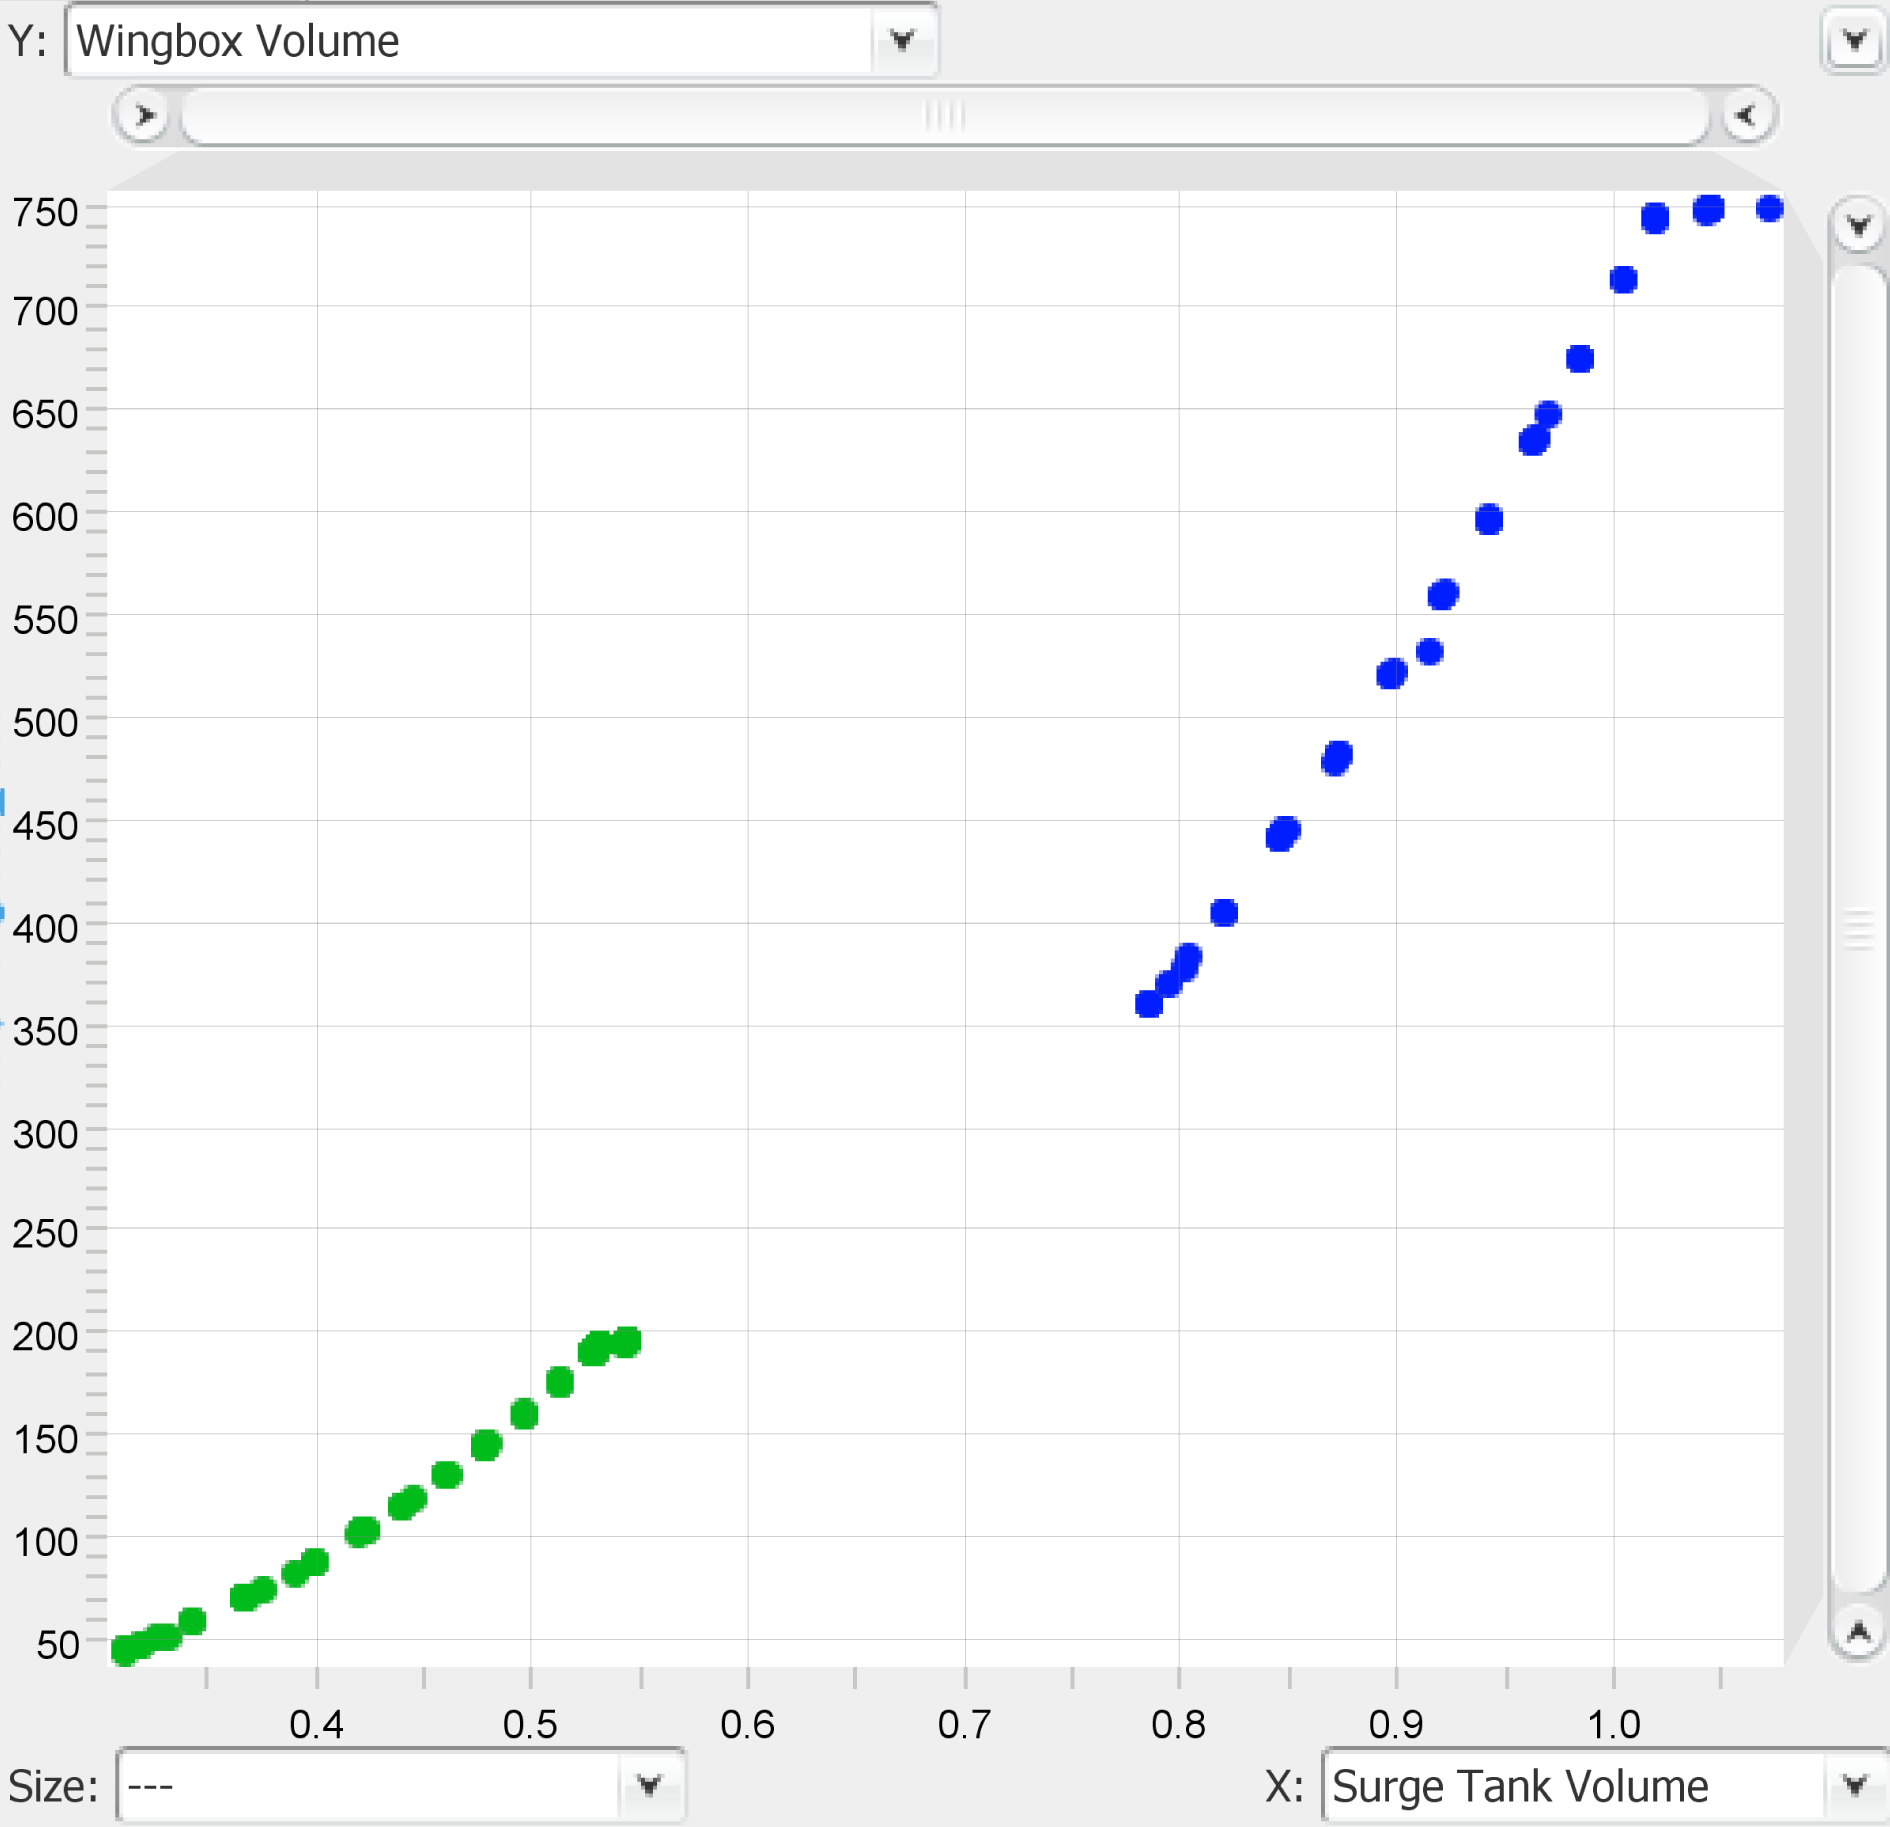
Figure 17. Pareto front for the two extreme optimisation clusters.
The way that the results have been presented for the two extreme optimisation clusters, can also be used for all configurations, as shown in Figure 18. Long span configurations are presented in blue, medium span in black, and short span in green. The strong correlation between the span and the two objective functions is once again evident. The configurations with a long span produce larger wingbox and surge tank volumes when compared to the medium and short span ones.

Figure 18. Parallel coordinates graph for all optimisation results.
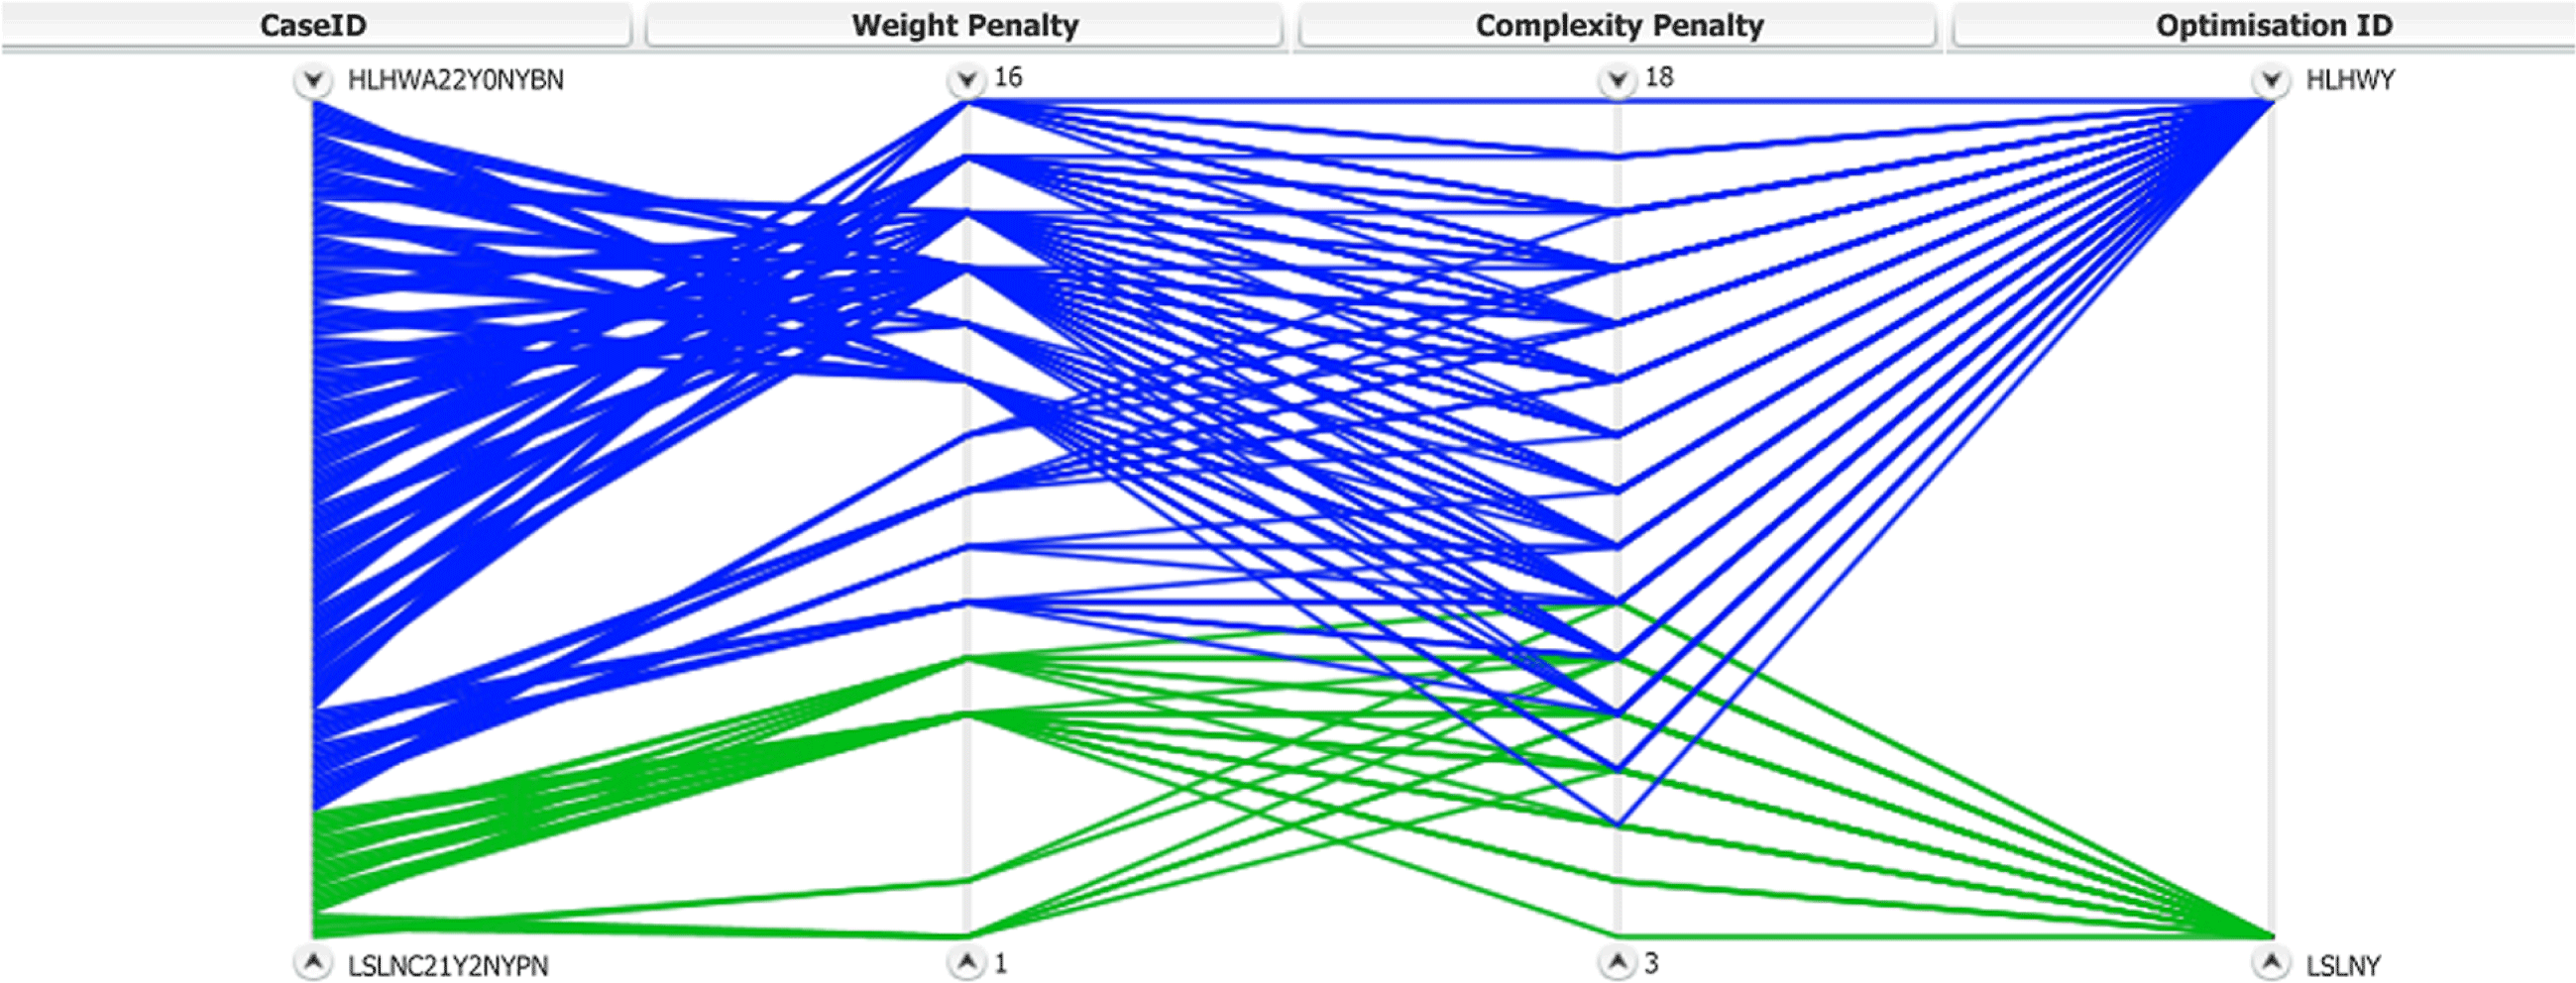
Figure 19. Parallel coordinates graph for complexity and weight penalties of all configurations sharing the LSLNY and HLHWY optimisation IDs.
With just the optimisation results, all the configurations that share the same optimisation ID (i.e. belong in the same optimisation cluster) would yield the same results. The results of the optimisation process alone are insufficient for decision-making. Further information is needed, therefore more metrics are introduced.
Complexity and weight penalties were introduced to assess and differentiate the competing configurations; especially in cases where configurations belonged in the same optimisation cluster. Summing up the penalties for each configuration, using Table 5, the results can be plotted again using parallel coordinates.
Initially, the two extreme optimisation clusters are used to demonstrate the range of different penalties for different configurations. Figure 19 presents the complexity and weight penalties of all configurations that share the optimisation IDs LSLNY (Green) and HLHWY (Blue). When compared to the optimisation results for the two clusters shown in Figure 14, it is evident that the configurations yielding large wingbox and surge tank volumes (blue polylines), are also the ones with the higher complexity and weight penalties.
Using the same approach, the penalties for all configurations can be plotted as shown in Figure 20. Visualising the penalties on their own might not offer substantial valuable insight, hence why they are used as additional metrics alongside the optimisation results. Configurations that belong in the same optimisation cluster share the same optimisation results but each one has different penalties; since dormant parameters are also considered for the penalties. A scatter plot shown in Figure 21 demonstrates the almost linear correlation between weight and cost penalties.

Figure 20. Parallel coordinates graph for complexity and weight penalties for all configurations.

Figure 21. Scatter plot for complexity penalties against weight penalties.
The penalties and the respective configuration IDs can now be appended to the results obtained from optimisation. Merging the two sets of data, generates the full results and non-dominated solutions for wingbox volume, surge tank volume, complexity penalties, and weight penalties for all desirable configurations. The complete results are presented in Figure 22.
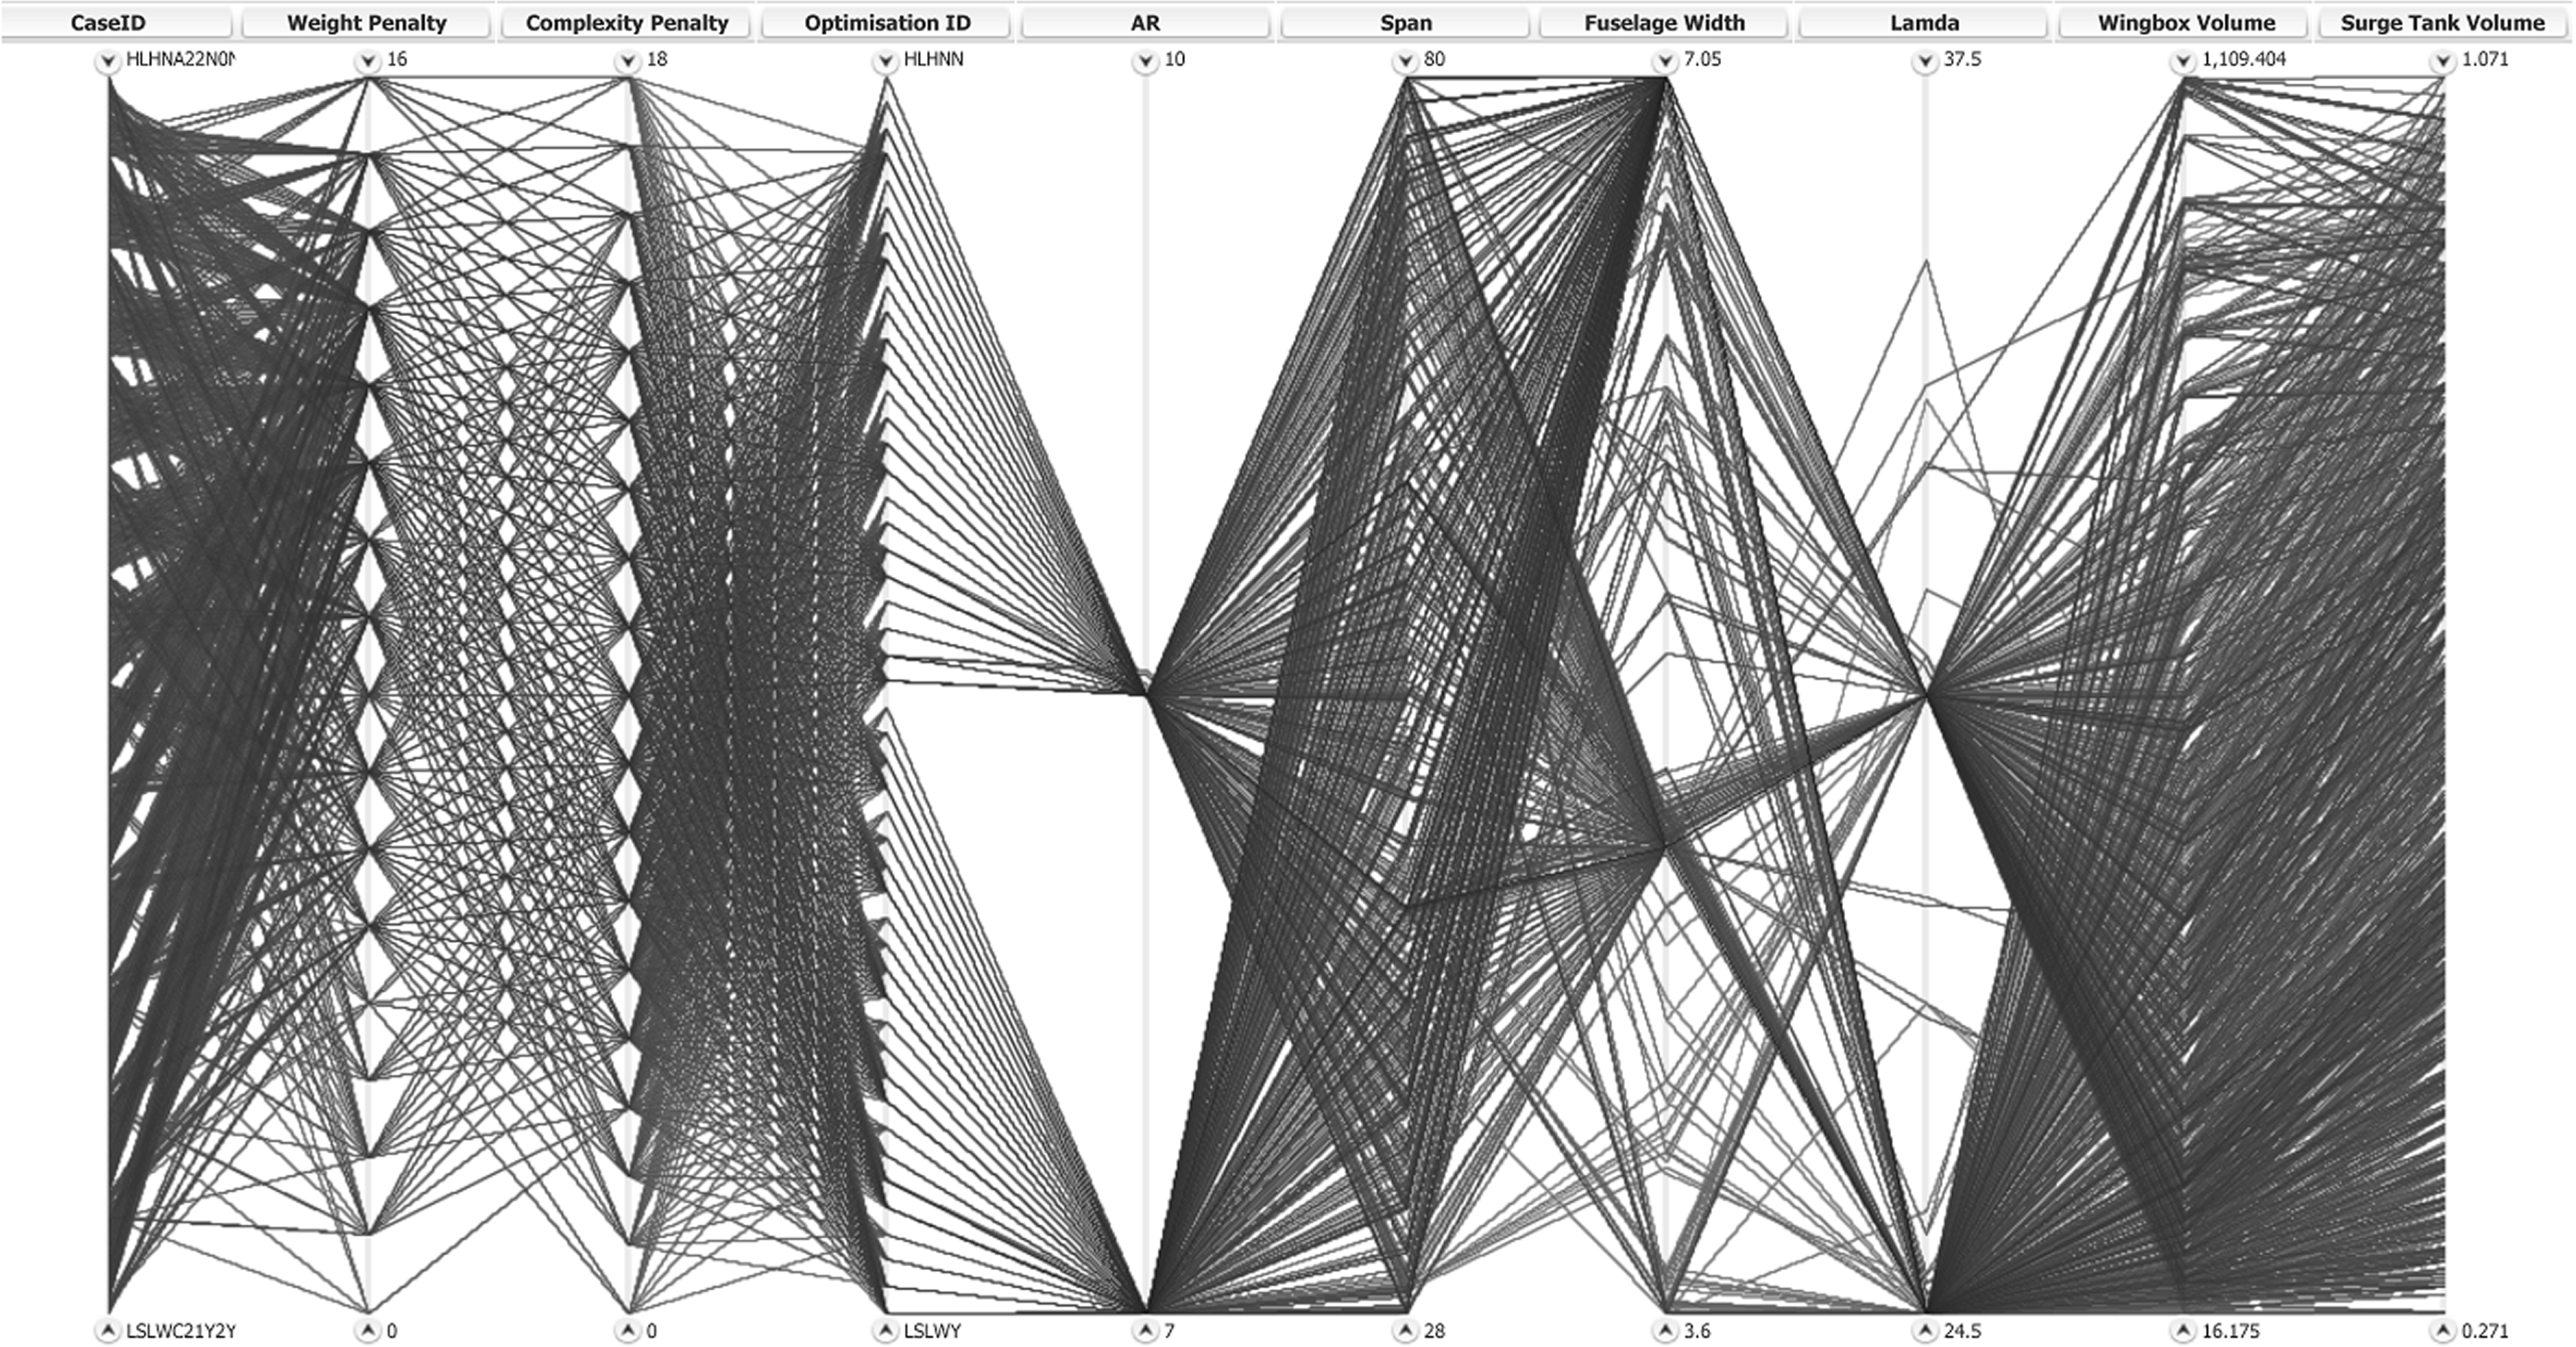
Figure 22. Parallel coordinates graph for all configurations including optimisation and penalties results.
Using the parallel coordinates plot to visualise the full set of results, a range of adjustments can be made to identify correlations, eliminate configurations, or highlight different sets. This is where the interactivity of parallel coordinates makes it a very powerful visualisation tool to assist in design decision-making.
A number of different filterings and selections that can be applied to the full set of results are presented in Figure 23. One of the most likely scenarios would be to eliminate configurations that have high penalties, whether it is weight or complexity. The eliminated configurations are presented in light grey colour. Another scenario would be to discard configurations that have both a low aspect ratio and a long span; as this would create an excessively large wing area. Finally, configurations that lie on the edges of the optimisation objectives can be eliminated. This is done to avoid extreme cases or risking the violation of constraints due to change in requirements and/or uncertainty in the data.
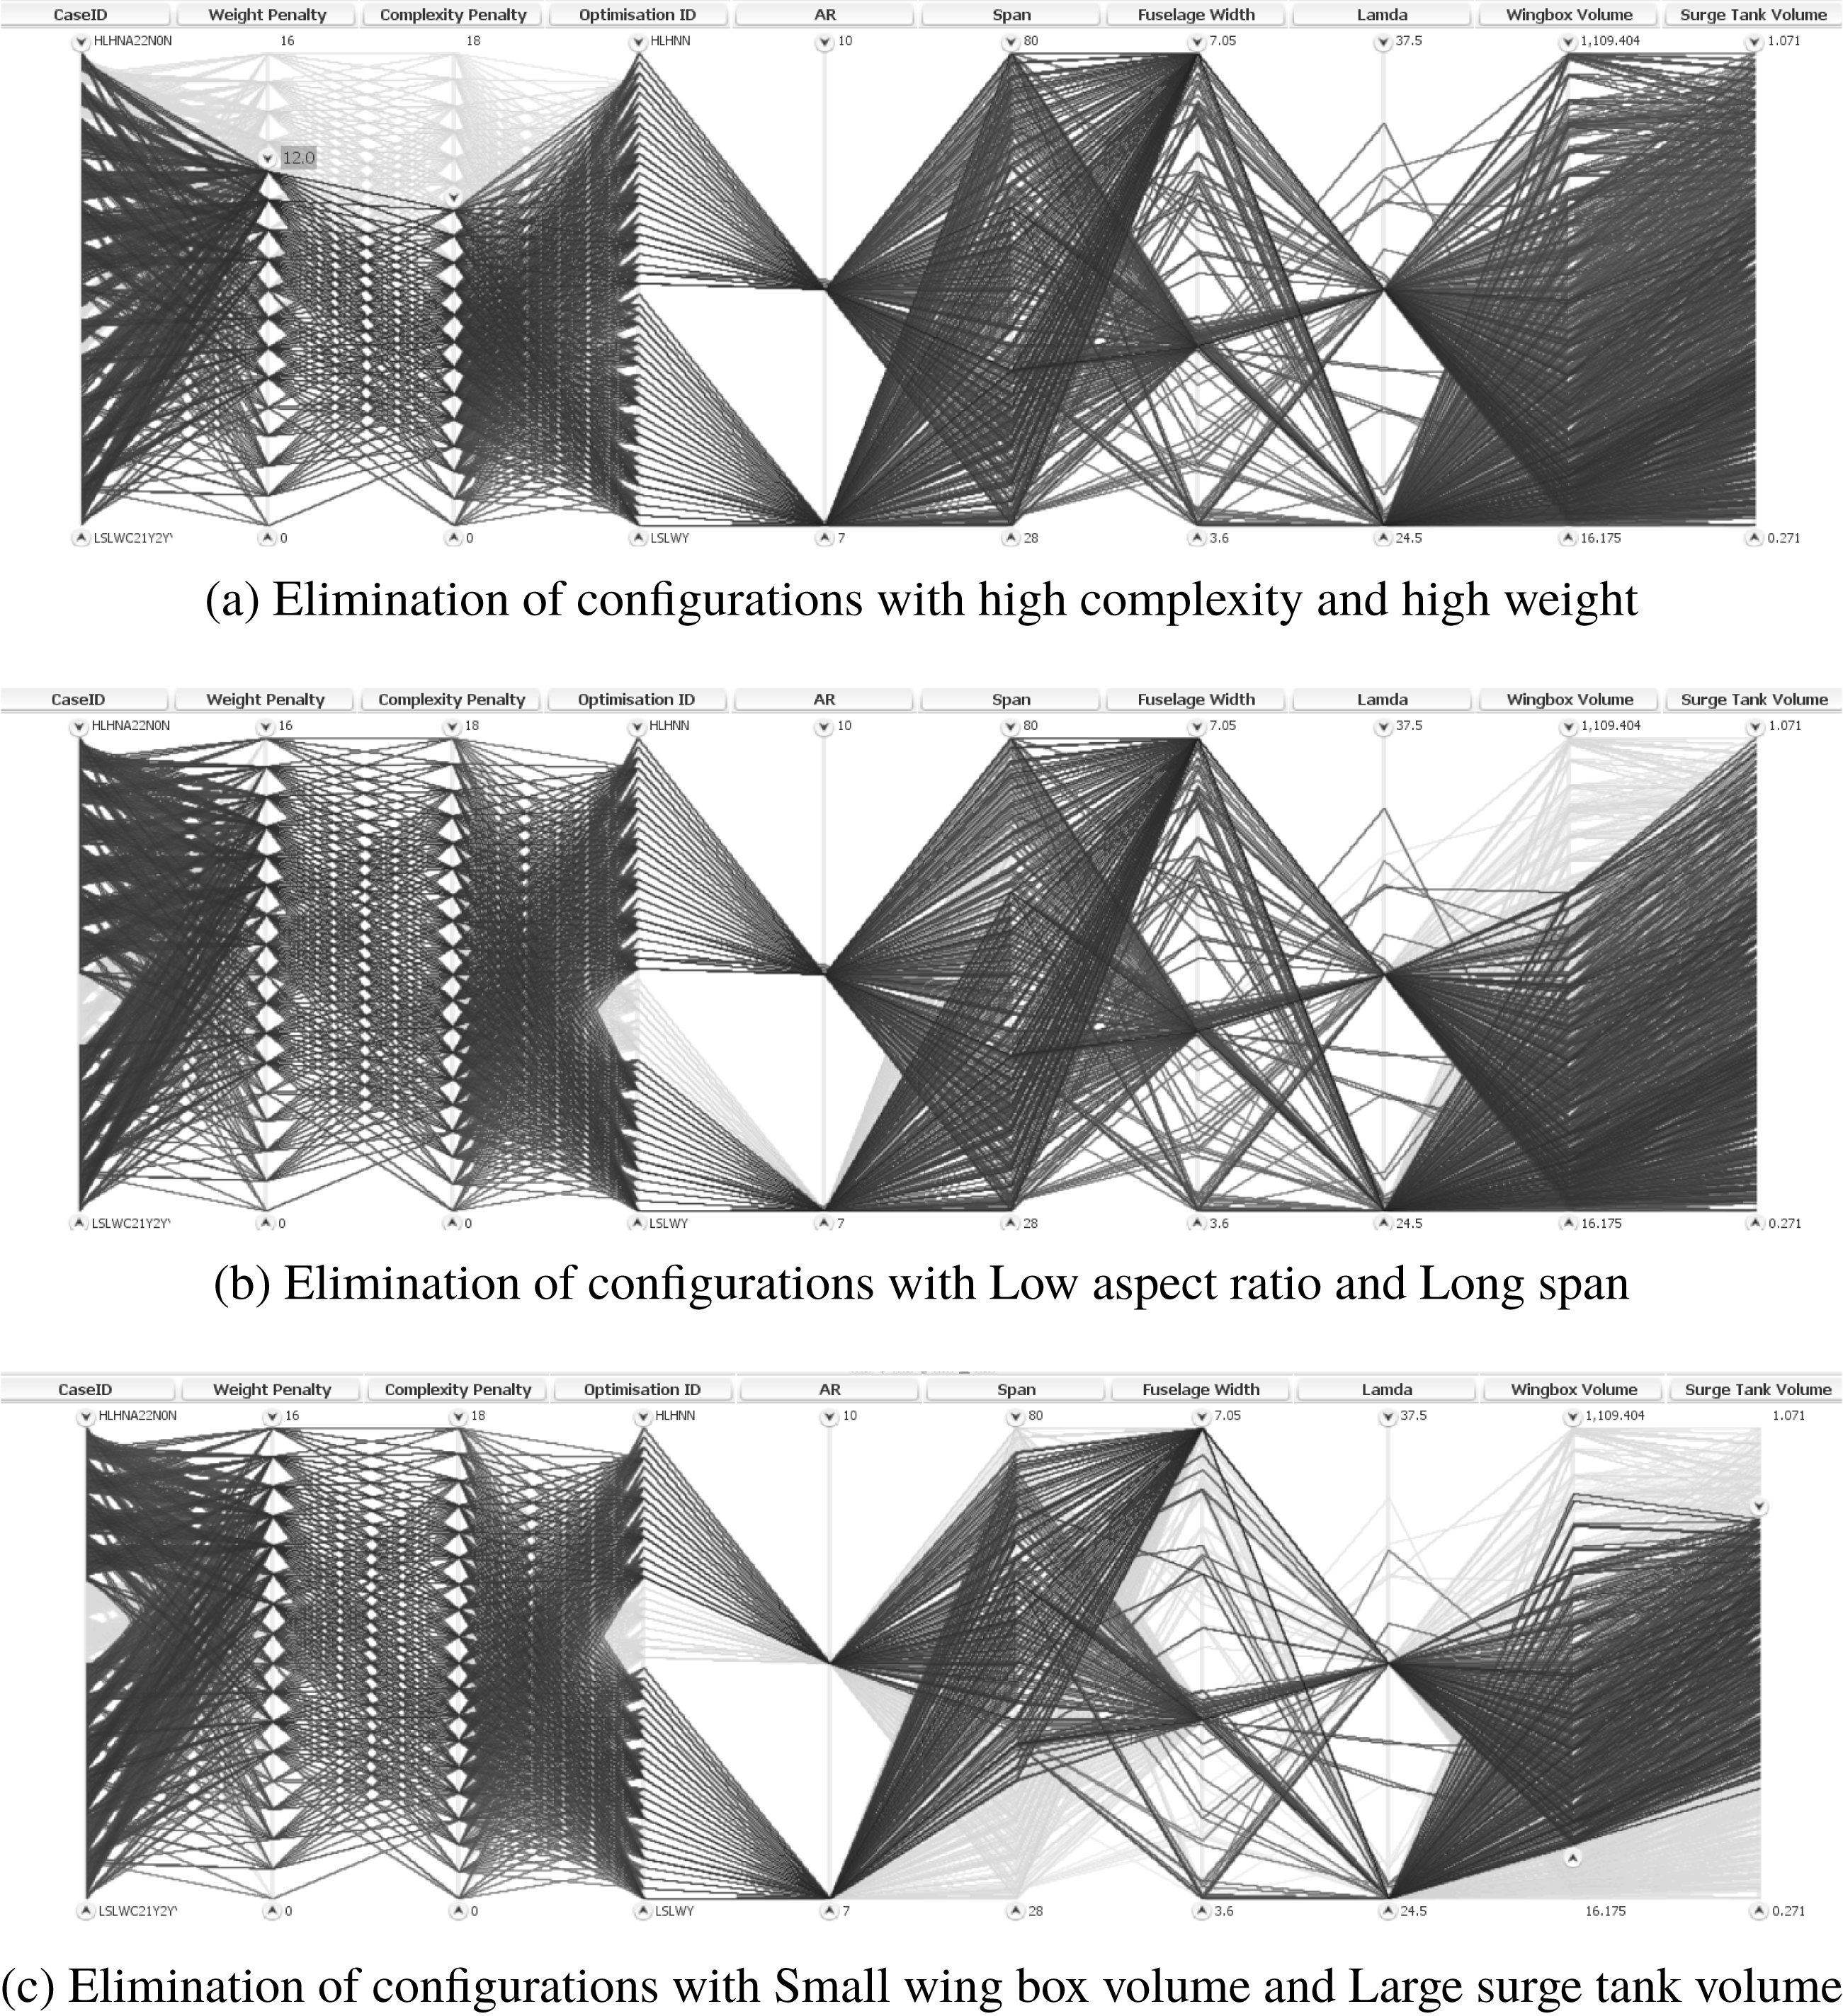
Figure 23. Different filterings applied to the full results.
The above three scenarios are just examples of the different ways the results can be interacted with. If constraints change later in the design process, configurations that violate those constraints can be easily identified and filtered out by using the parallel coordinates plot.
7 Discussion
The aim of this paper was to investigate how a thorough design-space exploration of complex systems with high dimensionality can be carried out in a fast and computationally efficient process. To address that, a new architectural framework for designing complex systems was developed. As the acronym suggests, Augmented set-based Design and OPTimisation, the ADOPT framework is built on a newly developed, modified, and improved SBD approach with an integrated optimisation process.
The SBD approach was enhanced by a number of ways. The conversion of continuous parameters to discrete, enables the generation of a finite number of possible configurations. Instead of selecting which configurations to be evaluated, ADOPT uses an elimination approach initially. The imposition of infeasibility and undesirability constraints, allows for discretised areas of the design space (i.e. the configurations) to be entirely discarded.
The optimisation process within ADOPT, assists in finding the optimum design of each configuration within their respective design-space area. In the case of competing objectives in multiobjective optimisation, it provides a number of non-dominated alternatives. One of the important steps that ADOPT uses, is the identification of active and dormant parameters. The process allows to identify which parameters have an effect on the optimisation objectives (active parameters) and which ones do not (dormant parameters). Therefore, not all the configurations have to be optimised, only the ones that will produce unique results. Optimising the configurations within the bounds of their respective design-space areas, ensures that the configurations that result from each area are the optimum, or non-dominated ones.
The introduction of penalties for metrics such as weight and complexity adds a further measurement of desirability of each configuration. They also assisted in differentiating the configurations that shared the same optimisation results.
The knowledge that has been generated during the design of a system, can be used in future projects in order to reduce the time of the design process. By avoiding previously explored areas, and making use of results that have already been generated, allows future projects to focus entirely on new areas. Furthermore, previous configurations that were deemed as undesirable due to manufacturing or other limitations, might be worth to be re-examined and explored in the future, when the required technological capability has been achieved.
The design of an aircraft fuel system was used as a case study to demonstrate how the ADOPT architectural framework can be configured and adapted to the design of a system. The process was able to generate a wealth of information for design decision-making in a short amount of time. However a number of potential limitations and drawbacks of the framework were identified:
(1) Even for a case study such as the one presented, with less than 20 design parameters, the number of possible combinations is quite large. Each option added, even for one design parameter, increases the number of possible configurations substantially. When dealing with multiple hierarchical levels of a system, and multiple disciplines, this can lead to an unmanageable number of configurations. The imposition of constraints would also be challenging due to the multidisciplinary and multilevel nature of such systems.
(2) The large generation of data might pose difficulties in storing and/or visualising them. Computational tools for parallel coordinates, struggled to plot the results generated from the case study that was presented.
(3) At this stage, ADOPT does not have an integrated requirements management process. When dealing with more complex multidisciplinary systems, such a process is critical in order to keep track of requirements. This becomes even more vital in long design processes where requirements might change with time. Furthermore there is no information exchange method defined between disciplines.
(4) The discretisation of continuous parameters poses an important trade-off. The more discrete values a range is divided into, the more thorough the exploration will be and the constraints can be more accurate. However this increases the complexity, due to the increase in the number of options, and would lead to the issues described in point number 1.
(5) Crisp sets in discretisation might lead to loss of potentially desirable configurations due to constraints. For example, generally a high aspect ratio and a short wing span would yield a relatively small wing area and that would be undesirable in most cases. However, the values closer to the lower bound of a high aspect ratio, and the values close to the upper bound of a short wing span, might yield desirable configurations.
(6) With larger systems that include substantially more design parameters, using the identification method that was outlined in this work would be counterproductive as it would generate excessively long IDs. Even if they would theoretically still be human-readable, they would not be practical. In such cases a machine-generated and machine-readable approach would be the most logical.
(7) Currently, the ADOPT framework does not consider uncertainties, whether aleatory or epistemic. The ability to quantify and manage the uncertainties, especially in the early stages of design, can help ensure that the feasibility and manufacturability of the final product will not be compromised; even if it has to undergo design changes.
(8) When dealing with simple systems both in terms of number of elements, and number of options for each design parameter, a point-based approach might be more suitable. This is also the case when dealing with systems that do not have a multidimensional design space, or if the design space is highly constrained. Using a set-based approach in such cases, would unnecessarily require more upfront resources, and would not be able to fully exploit the potential benefits of the approach.
All of the above limitations and drawbacks do not subtract from the novelty, usability, and adaptability of the ADOPT architectural framework and the work presented. Instead, they demonstrate that there are still a lot of areas that can be further developed and improved. The framework should be seen as the foundations, on top of which further research can be undertaken; not only just to improve the framework but also for adapting it for ad hoc purposes.
8 Conclusion and future work
One of the limitations of the current state of the framework is the lack of a requirements management process and a formal method of exchanging information between disciplines. The inclusion and implementation of a Model-Based Systems Engineering (MBSE) approach would resolve both those issues and drastically improve the scalability of the framework.
Currently, the configurations are being generated, optimised and assessed sequentially; which for analytical evaluations of this scale does not pose an issue. However as the framework is scaled for larger and more complex problems, it will be critical for it be parallelised. By having a number of configurations being evaluated concurrently, it will allow the workflow to be completed in a much shorter time and make better use of modern computational processing capabilities. Such a parallelisation could be implemented using both Graphics Processing Units (GPUs) and CPUs.
The ability to quantify and manage uncertainty, as well as its propagation, is something that also needs to be implemented in ADOPT. This will further ensure the robustness of configurations even if requirements change later in the product development process.
One of the framework processes that caused a number of limitations and drawbacks was the approach used for the discretisation of continuous parameters and the potential loss of configurations due to constraints. The reason behind this is the use of crisp sets for the ranges arising from the discretisation. Introducing fuzzy sets instead of crisp sets would remove this limitation and provide a number of further benefits; since fuzzy sets allow memberships in more than one range. By using fuzzy sets the uncertainty accompanying how each person perceives what is ‘short’ and what is ‘medium’ (in the case of wing span for example) is also captured. From there on, the constraints can also be adapted by using fuzzy logic and various membership functions.
The case study presented as part of this work was sufficient to demonstrate those aspects for this stage of the architectural framework. However, when the framework improvements mentioned above are implemented, a more detailed and extensive case study will be required. The most important area that needs to be validated is the scalability of the framework. In order to assess that, a larger, more complex, and more detailed case study is required.
A number of additional optimisation objectives and performance metrics will be introduced in order to provide a more detailed evaluation of the configurations. Additional disciplines will be introduced in the process such as the aerodynamic performance and structural analysis. However, simulations of those domains tend to be computationally very expensive; depending on the approach used. Therefore an appropriate management of computational power becomes crucial. Cheap and analytical simulations can be used in the early stages due to the large number of configurations considered, whereas more detailed numerical simulations can take place at later stages for a more detailed evaluation and assessment.
The framework should also be applied to the design of an entirely different system. Not just moving away from aerospace and aircraft systems, but from physical systems altogether. Applying ADOPT to the design of an organisational system, for example, will further solidify its adaptability to the design of any kind of system in consideration.
At this stage, ADOPT offers a very strong proven foundation for future research to be carried out. The areas that have been identified will enable the framework to overcome any kind of limitations or drawbacks currently present. Furthermore, the proposed improvements will make ADOPT faster, more efficient, more powerful, and more adaptable.
Acknowledgments
The work presented in this paper is part of a research project funded by the Engineering and Physical Sciences Research Council (EPSRC) and Airbus.


