


INTRODUCTION
Ice sheets play a major role in global climate change and sea-level rise. The mass balance of the Antarctic ice sheet is an important climatic variable since it has an important impact on global sea-level rise (Meier, Reference Meier and Peltier1993; Alley and others, Reference Alley, Clark, Huybrechts and Joughin2005), based on the fact that it is the largest freshwater ice reservoir on Earth. Mass balance and other glaciological studies require knowledge of ice velocity, surface elevation, ice thickness and snow accumulation, either from direct field measurements or via remote-sensing methods (Paterson, Reference Paterson1994; Rignot and others, Reference Rignot, Mouginot and Scheuchl2011). Considering the difficulties of accessibility, the hostile environment and the logistic problems in Antarctica, the use of the GPS receivers has become a standard tool for field measurement of ice kinematics and surface topography in Antarctica (Tabacco and others, Reference Tabacco, Passerini, Corbelli and Gorman1998; Capra and others, Reference Capra2000; Gudmundsson, Reference Gudmundsson2006; King and others, Reference King, Coleman, Morgan and Hurd2007; Zhang and others, Reference Zhang, E, Wang, Zhou and Shen2007; Cheng and others, Reference Cheng, Gong, Zhang, Sun and Wei2009; Yang and others, Reference Yang2014).
Since the first Chinese National Antarctic Research Expeditions (CHINARE) along the traverse route from Zhongshan station to Dome Argus (Dome A) in 1996 (shown in Fig. 1a and Table 2), the studies of mass balance, ice temperature, meteorological measurements, glacio-chemical of surface snow and shallow ice cores, and stratigraphy in snow pits and snow/firn cores have been carried out (Qin and others, Reference Qin2004; Ren and others, Reference Ren, Sun and Qin2004; Xiao and others, Reference Xiao2008; Zhang and others, Reference Zhang2008). Since the 21st CHINARE in 2005, meteorological measurements from automatic weather stations, ice-sheet thickness and bed topography, surface mass balance (SMB)/snow accumulation, surface topography and velocity field have been studied (Hou and others, Reference Hou, Li, Xiao and Ren2007; Zhang and others, Reference Zhang, E, Wang, Zhou and Shen2007; Xiao and others, Reference Xiao2008; Cheng and others, Reference Cheng, Gong, Zhang, Sun and Wei2009; Sun and others, Reference Sun2009; Cui and others, Reference Cui2010; Ma and others, Reference Ma, Bian, Xiao, Allison and Zhou2010; Bell and others, Reference Bell2011; Ding and others, Reference Ding2011, Reference Ding2016; Yang and others, Reference Yang2014).
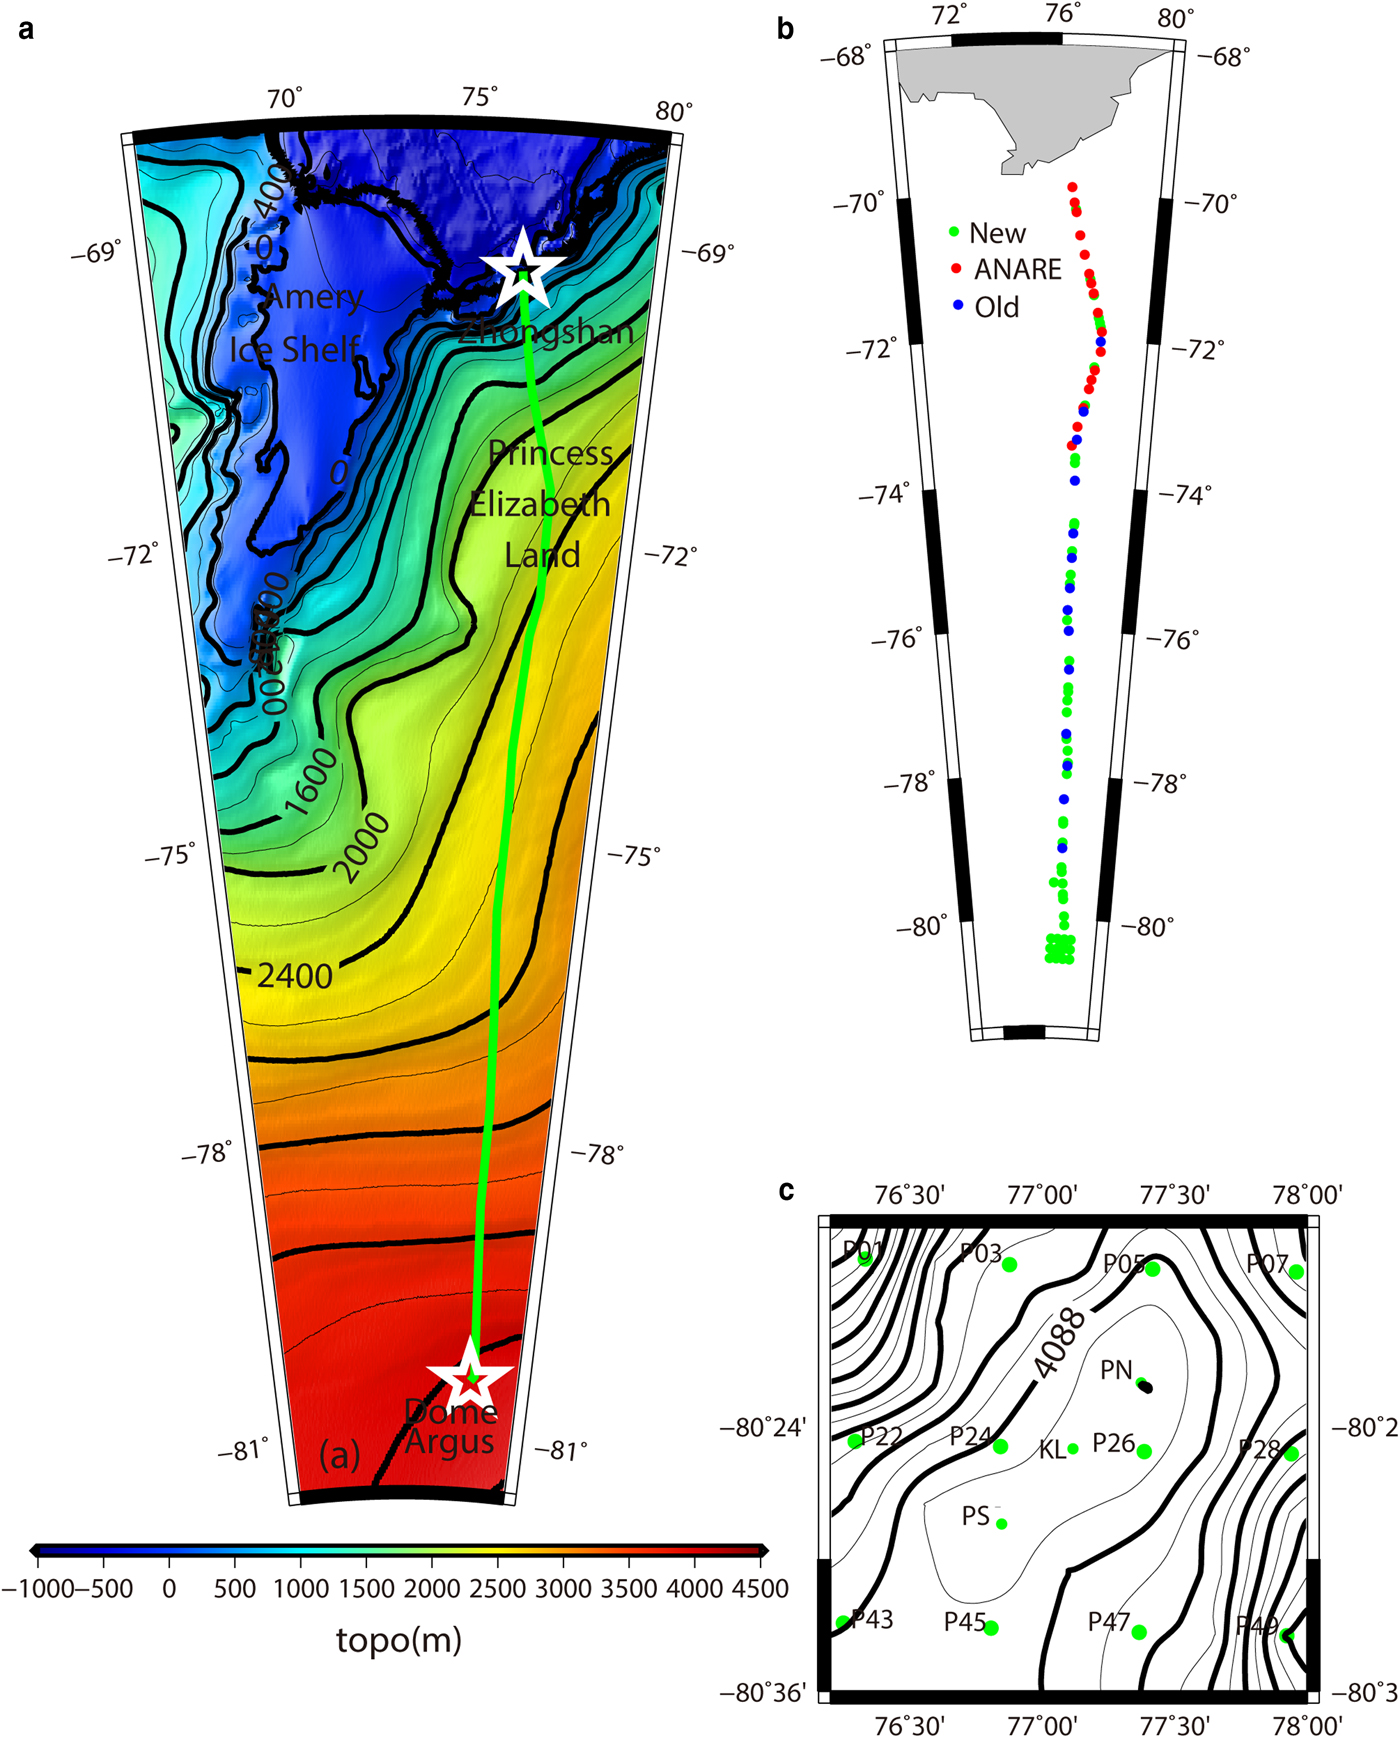
Fig. 1. (a) Sketch map showing the locations of along the transect, and (b) poles for GPS measurements along the transect, and (c) poles for GPS measurements around Dome A.
Along the traverse route (shown in Fig. 1a and from LGB72 to KL in Table 2), GPS poles were established at ~2 km intervals. From 1997/98 to 2004/05, GPS measurements were carried out at 42 poles, with 19 GPS sites reoccupied for more than 2 times along the traverse route. With these repeat GPS measurements, horizontal surface ice velocities were calculated and listed in Table 2 (Zhang and others, Reference Zhang2008). Since 2005, 60 poles around Dome A were set up to estimate SMB and map the ice surface topography in a 30 × 30 km area centered at Kunlun station. Among the 60 poles, 12 poles were measured with repeat GPS in 2008, and GPS data were collected at 47 poles in 2013. With these 12 repeat GPS measurements, the surface velocities around Dome A were derived and listed in Table 2 (Yang and others, Reference Yang2014).
The key objective of this paper is to update the new result of the GPS data collected in the CHINARE after 2005. With these repeat GPS measurements, the horizontal surface ice velocities are computed. Combined with the early results, we present the horizontal surface ice velocities at a higher resolution along the transect and around Dome A (the other sites in Table 2), East Antarctica. The GPS results are then compared with the interferometric synthetic aperture radar (InSAR) results reported by Mouginot and others (Reference Mouginot, Rignot, Scheuchl and Millan2017).
FIELD GPS SURVEY AND DATA PROCESSING
Along the traverse route, GPS poles were established at ~2 km intervals in 2007. Poles are random selected when the vehicle stopped (Zhang and others, Reference Zhang2008; Cheng and others, Reference Cheng, Gong, Zhang, Sun and Wei2009), and GPS measurements carried out in different years. GPS measurements varied in different years along the transect from Zhongshan Station to and around Dome A. Before 2005, GPS measurements in different years were described in Zhang and others (Reference Zhang2008). In 2005/06, GPS surveys at 26 and 19 poles were measured along the transect from Zhongshan Station to and around Dome A, respectively. Three dual-frequency GPS receivers were used to collect GPS data at an interval of 15 s in all the GPS surveys. Along the same transect, GPS surveys at 5, 20, 10, 19 and 45 poles were measured in 2007/08, 2008/09, 2009/10, 2010/11 and 2015/16, respectively. Moreover, GPS surveys of 9, 19, 47 and 53 poles were measured around Dome A in 2008, 2010, 2011 and 2016, respectively. Two dual-frequency GPS receivers were used to collect GPS data. As we just focus on the ice velocities along the same transect and around Dome A, we only use the repeat GPS data here. Among these measurements, 52 repeat poles were measured lasting more than 1 h along the transect and 50 repeats measured lasting more than 25 min over Dome A (Fig. 1 and Table 2), respectively. In this paper, we only focus on the new results of 15 poles (Fig. 1), with 12 poles of Yang and others (Reference Yang2014) and three new lasting more than 1 h (Kunlun station (KL), south peak (PS) and north peak (PN)).
For the 52 repeat poles along the transect and three poles (PN, PS and KL) around the Dome A, the GPS measurements were processed using the GAMIT/GLOBK software suite, Version 10.50 (King, Reference King2002), developed at MIT. Seven International GNSS Service (IGS) stations around Antarctica, including MAW1, CAS1, DAV1, DUM1, MCM4, OHI2 and SYOG, were used in the processing. During the data processing, the following options were selected: (1) International GNSS Service (IGS) SP3 precise ephemerides were used; (2) the IGS stations were tightly constrained (within 1 cm) to their ITRF 2008 values, while the six reference stations at Dome A were loosely constrained (within 100 m); (3) an elevation cut-off angle of 15° was adopted; (4) antenna-phase center variation corrections were applied; (5) the ionospheric-free linear combination of the L1 and L2 frequencies was used; (6) corrections due the solid-Earth and pole tides were applied; (7) the dry component of the zenith tropospheric delay was implemented using the Saastamoinen model with global mapping function; and (8) the wet component of the zenith tropospheric delay was estimated every 2 h using the mapping function. The GAMIT solutions were then combined using the GLOBK software.
Two steps were used for 12 poles of Yang and others (Reference Yang2014) over Dome A, and the details shown in Yang and others (Reference Yang2014). GPS measurements in the reference station were first processed using the GAMIT/GLOBK software. Then Version 2.50 Trimble Business Center (TBC) was used to obtain the baseline between a roving station and a reference station. During the data processing, IGS SP3 precise ephemerides were used and an elevation cut-off angle of 15° was adopted.
To account for the effect of tectonic motion, we corrected for the east-west component and north-south component of velocities at MAW1, CAS1, DAV1, DUM1, MCM4, OHI2 and SYOG using the result of Jiang and others (Reference Jiang, E, Zhan and Liu2009). To reduce the impact of plate motion, we fix the coordinates of seven IGS stations to the same epoch 2016.0 when the data were processed with GAMIT.
RESULTS AND DISCUSSION
Surface velocity comparison before and after 2005
Horizontal surface velocities at 19 GPS sites along the traverse route were calculated by Zhang and others (Reference Zhang2008) from 1997/98 to 2004/05. Since 2005, 52 poles along the transect repeat measured (Table 2). There were 14 overlap poles shown in Figure 1 before and after 2005, and the results shown in Table 1. The largest velocity speed difference located at site DT063 was 0.9 m a−1, where the difference was ~10% of the velocity speed 9 m a−1. The mean difference and the Std dev. along the traverse route were 0.1 m a−1 and 0.3 m a−1, respectively. Moreover, the largest directional difference of 9.7° is noted at site DT063, with the mean difference and Std dev. at 0.5° and 3.1°, respectively. The large difference may indicate the terrain change in the location. Compared with the mean surface velocity speed of 12.0 m a−1 along the traverse route, the small mean difference value of 0.1 m a−1 indicates that the velocity estimate is robust.
Table 1. Horizontal velocities at GPS sites (unit: degrees, minutes, seconds) before and after 2005

* After 2005.
Table 2. Horizontal velocities at GPS sites (unit: degrees, minutes, seconds) along the traverse route and around the Dome Argus

* Measured by ANARE.
† Repeat measured.
Around the Dome A, new horizontal surface results in 12 poles were calculated from 2008 and 2016 GPS data. The largest difference before and after 2013 appeared in P43, with the speed difference 2.3 cm a−1 and directional difference 27.6°, respectively. Compared with the results along the traverse route, the larger directional difference indicates that the smaller accuracy in coordinates leads to the relative larger error in Dome A. This is consistent with the larger uncertainty at P43 in Table 2 (Yang and others, Reference Yang2014). The mean difference and the Std dev. around the Dome A are 0.6 and 1.0 cm a−1, respectively, while the corresponding directional difference and the Std dev. are at 5.6° and 8.8°, respectively. Moreover, the mean velocity and the mean difference are at 12.0 and 0.1 m a−1 along the traverse route, compared with the same estimated values of 11.0 and 1.0 cm a−1 around Dome A, respectively. Therefore, we concluded that higher accuracy and/or spatially dense sampled GPS measurements are required around Dome A to account for the high spatial velocity variabilities.
Surface velocity field along the transect and around Dome A
Using the repeated GPS results of 52 poles along the route and 15 poles over Dome A since 2005, the surface ice-velocities along the traverse route and around Dome A were derived. We also collect the surface ice-velocity at other sites during the traverse shown in Figure 1, including four sites in Zhang and others (Reference Zhang2008) and 15 sites in Kiernan (Reference Kiernan2001). Besides the results from 12 poles in Yang and others (Reference Yang2014), the velocity fields from KL, PS and PN around Dome A were also derived. Table 2 summarizes the velocity results.
The mean velocity speed over Dome A is ~8.8 cm a−1, with the maximum velocity speed reaching ~28.7 cm a−1 at P01 in the northwest corner around Dome A. The minimum surface velocity speed located at PS and PN, which was ~1.7 and 1.9 cm a−1, respectively. The measured velocity speed at KL was ~2.9 cm a−1. The velocity speed over Dome A, which is near the summit of East Antarctica Ice Sheet, is larger than the velocity speed over Dome C because the latter has many gentle slopes than at the summit (Vittuari and others, Reference Vittuari2004), 2.8% versus 12.0%.
The 2D surface ice-velocity vectors map is shown in Figure 2. The flow directions at these sites are roughly consistent with the downslope motion of the ice sheet. The horizontal surface velocity values increase with distance from the summit. From Dome A to DT416 (150 km from the summit of Dome A), the velocity increases to 1.0 m a−1, with the increasing rate ~0.3 m a−1 50 km−1. Moreover, the velocity increases to 10 m a−1 at site DT333 (300 km from the summit of Dome A), with the increasing rate 3 m a−1 50 km−1, and this indicates a much steeper terrain for such region. Furthermore, the velocity increases to larger than 18 m a−1 at site DT313 and extends ~100 km distance to site DT263. Then, the slower velocity is <18 m a−1 between DT263 and LGB62, which indicates that the terrain is relatively flat. The velocity becomes larger than 20 m a−1 until it reaches site LGB66, and increases to 98.2 m a−1 at site LT980.
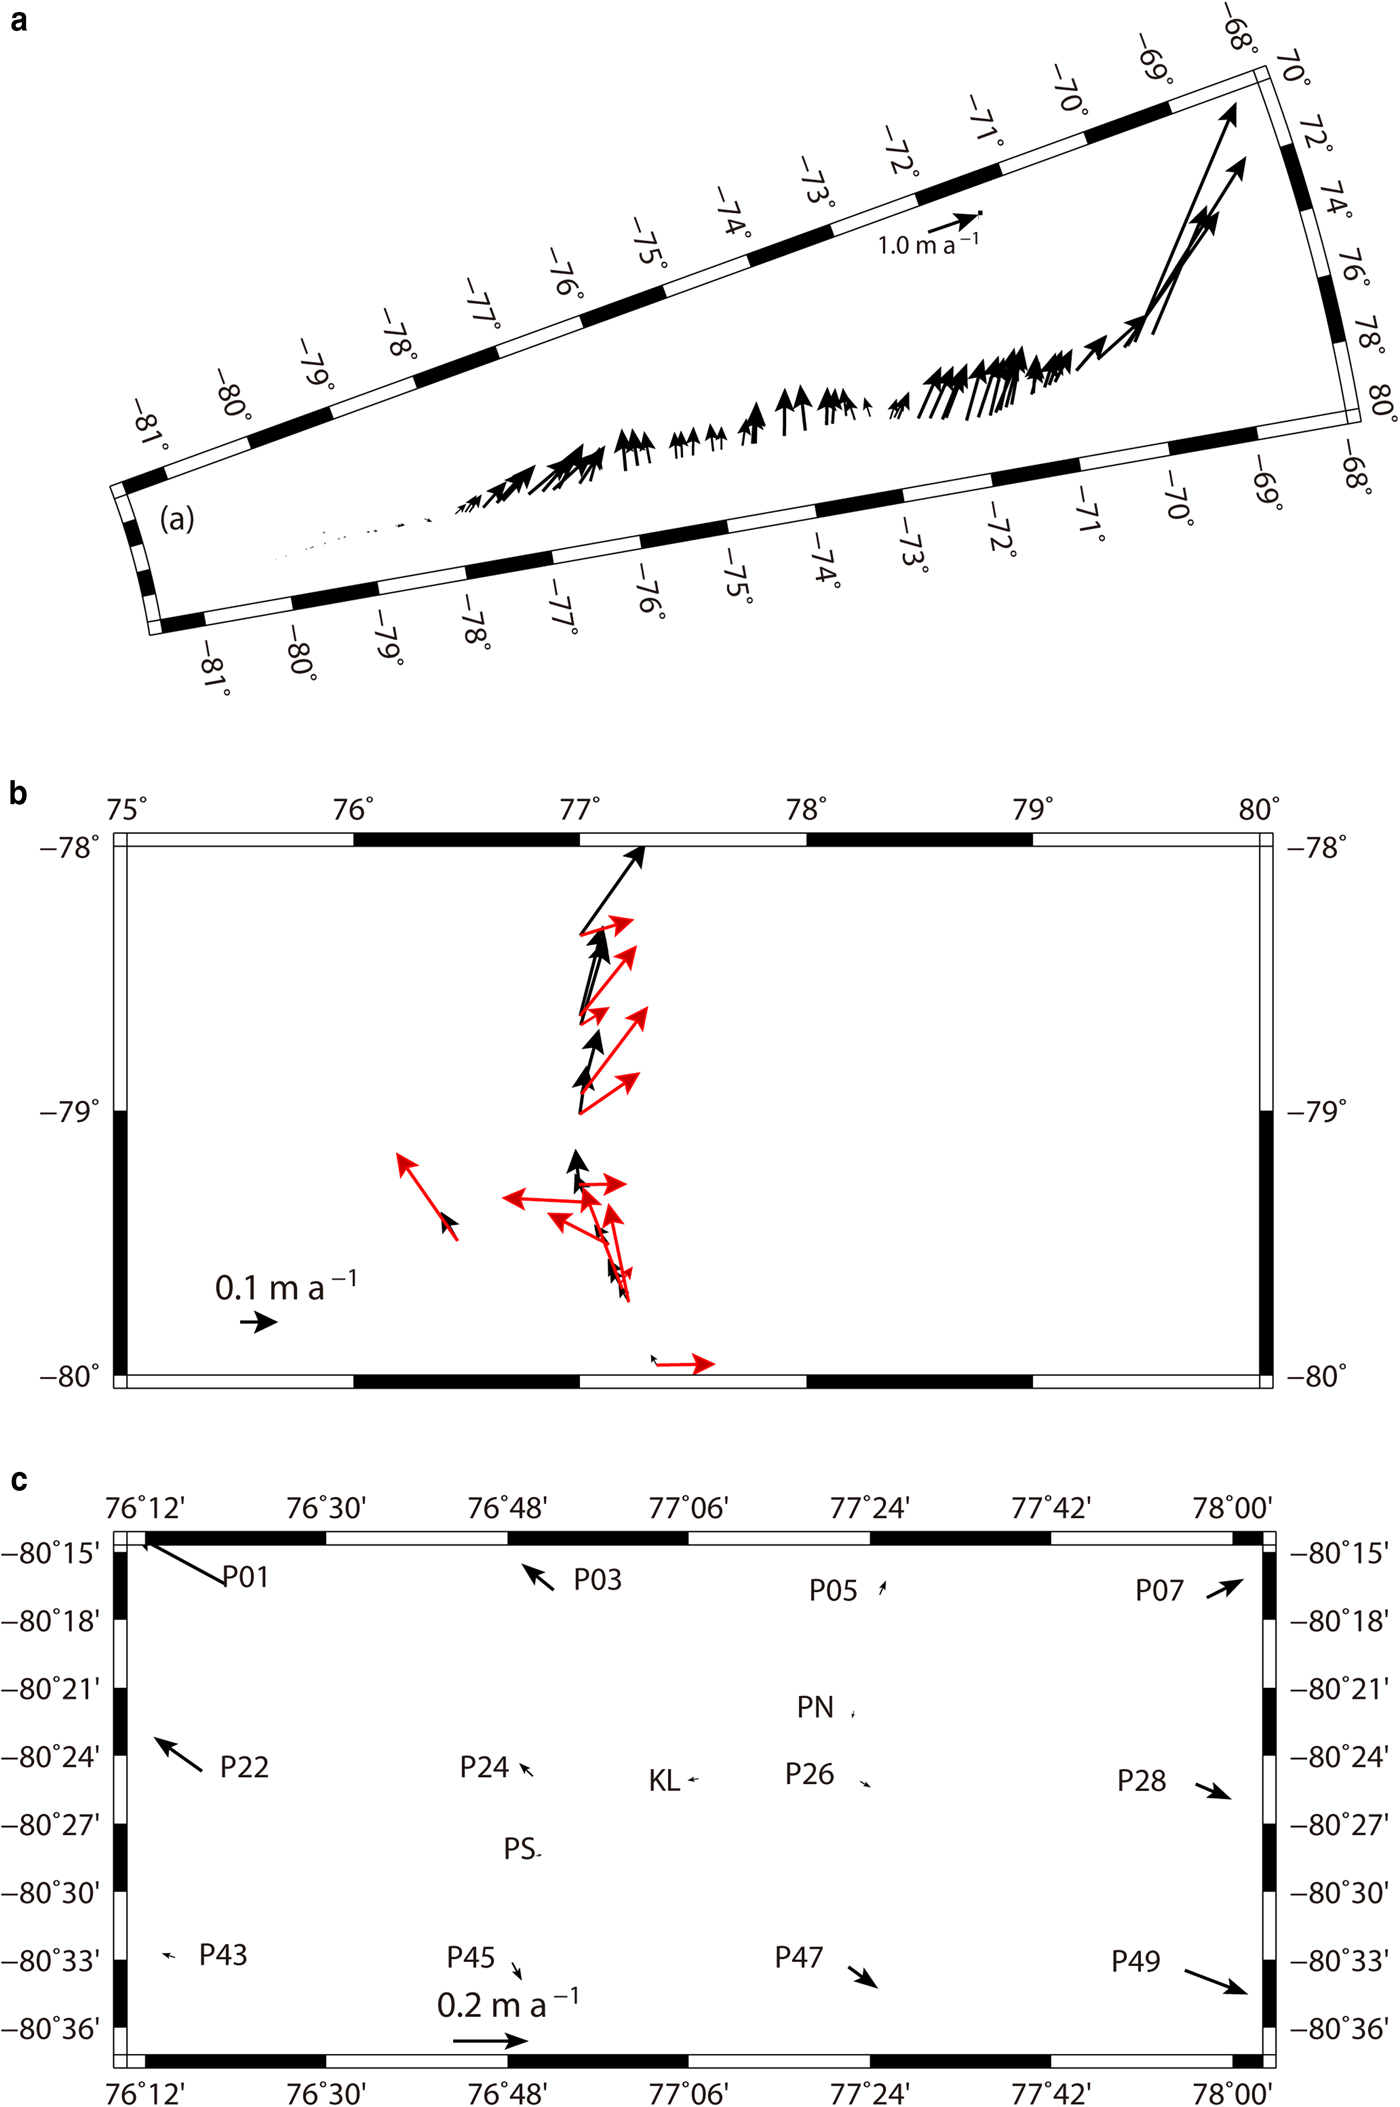
Fig. 2. Horizontal ice surface velocity estimates from (a) GPS along the transect, (b) GPS and InSAR along parts of the transect with magnitude <5 m a−1. Red is InSAR, and Black is GPS estimates, respectively, and (c) GPS around Dome A.
Accuracy evaluation of InSAR derived surface velocity
The accuracy of surface velocity field from InSAR over the Dome A (Rignot and others, Reference Rignot, Mouginot and Scheuchl2011) is assessed using the GPS-derived surface velocity (Yang and others, Reference Yang2014) updated in this study. The InSAR surface velocity field in our area of interest is version 2.0 given by Mouginot and others (Reference Mouginot, Rignot, Scheuchl and Millan2017) and posted on a 450 m grid. This dataset is an update to a previous version and contains post-2011 SAR data and Landsat-8 satellite imagery, combined using an updated mosaicking method.
The surface ice-velocity along the traverse route is shown in Figure 3a. From Figure 3a, it is clear that GPS results are larger than those of InSAR within the 500 km from the coast. Between 500 and 1000 km, they are consistent. From 1000 to 1250 km, InSAR results are larger than those of GPS. To show this more clearly, we derived the scale value between InSAR and GPS and shown in Figure 3b. Within the 500 km, the mean scale value is 0.82 and increases to 0.91 between 500 and 1000 km. From 1000 to 1250 km, the mean scale value is 7.71 with the largest 41.72. Meanwhile, the mean scale over Dome A is 8.77, which is close to that from 1000 to 1250 km. Hence, when surface velocities are larger than 5.0 m a−1 (from coast to 1000 km), GPS results are larger than InSAR, and InSAR result is only 87% of that of GPS. When surface velocities are <5.0 m a−1, InSAR results are larger than GPS, with the magnitude of InSAR velocities up to 8.24 times of the GPS values.
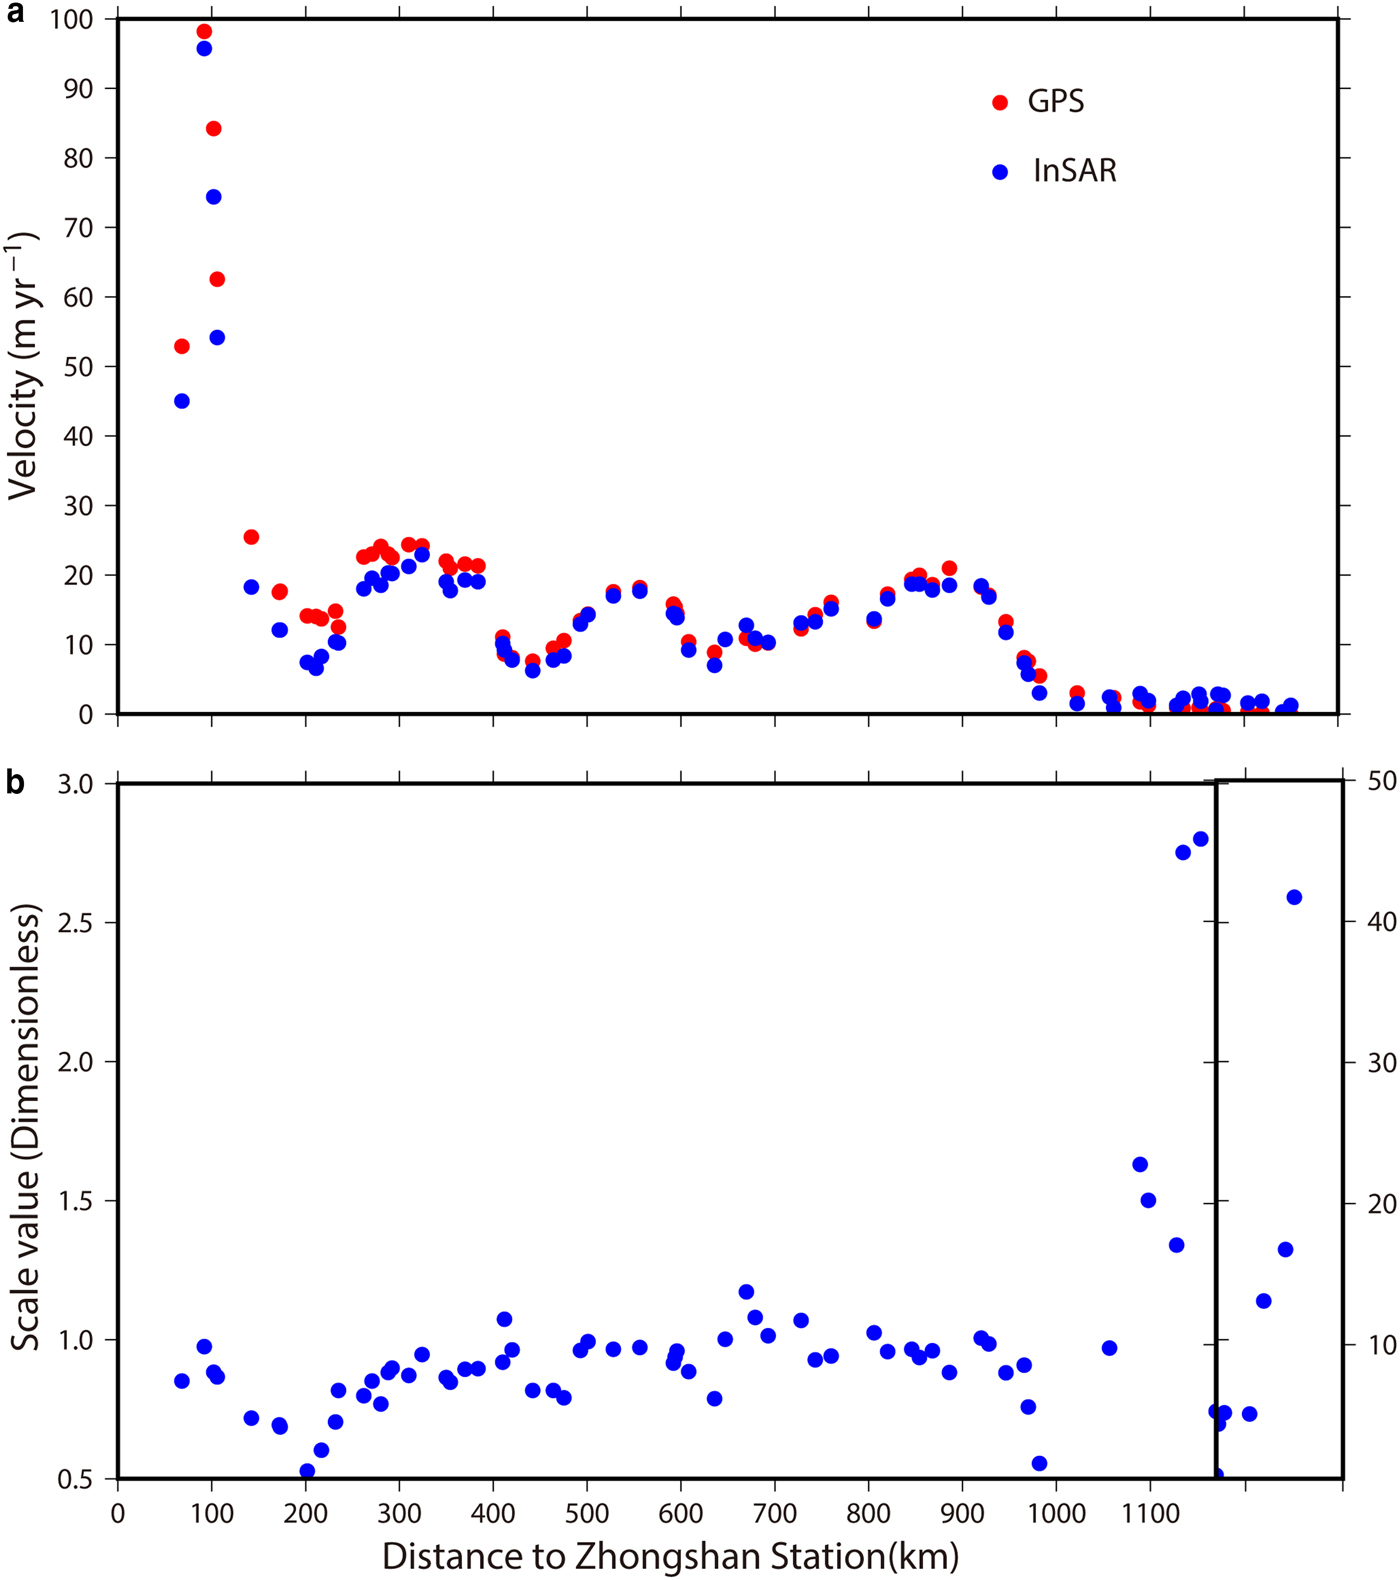
Fig. 3. (a) GPS and InSAR surface velocity along the transect, (b) the factor value derived as the ratio between InSAR surface velocity and corresponding GPS surface velocity.
The GPS velocities are generally larger than those from InSAR, with a mean difference ~1.31 m a−1 and a Std dev. of 2.55 m a−1, respectively. The largest difference between GPS and InSAR velocity is at a site ~100 m a−1 close to coastal regions. Meanwhile, the average InSAR velocity reported error provided Mouginot and others (Reference Mouginot, Rignot, Scheuchl and Millan2017) is 3.52 m a−1, which is 1.38 times of the Std dev. of the difference, which indicates that the InSAR reported error is different from the actual error. The mean difference, Std dev. of the velocity difference and the InSAR average reported error are ~2.23, 2.51 and 4.27 m a−1 with velocities larger than 5.0 m a−1, and they change to −0.81, 0.66 and 1.78 m a−1 with velocities <5.0 m a−1.
The velocity directions estimated from GPS and InSAR are roughly consistent, with the mean and the Std dev. of the directional differences are 4.4° and 37.7°, respectively. Meanwhile, the average error of velocity direction derived from InSAR is 27.4°, which is 0.74 of the Std dev. of the difference. The mean difference, Std dev. of the velocity direction difference and the InSAR error are ~0.9°, 12.9° and 11.6° with velocities larger than 5.0 m a−1, indicating that the velocity directions from InSAR are consistent with GPS. However, they increase to 16.5°, 65.0° and 63.8° with velocities <5.0 m a−1, therefore the accuracy of the InSAR velocity in these regions is limited. As shown in Figure 2b, large direction differences in GPS and InSAR exist.
We attribute the discrepancies between InSAR and GPS to errors in InSAR observations (shown in Table 3), or its insensitivity at low ice surface velocity estimates. Our assessment results here suggested that one may want to be cautious about InSAR surface velocity estimates in this East Antarctica study region, when their magnitude is <5 m a−1.
Table 3. Comparison between GPS velocity and Azimuth (unit: m a−1, °, respectively) and InSAR velocity components along the route

CONCLUSION
Using the repeat GPS measurements after 2005, we updated the new surface velocity estimates along the traverse route from Zhongshan station to and around Dome A. The horizontal ice surface velocities increase from near zero at the summit to near 100 m a−1 close to the coast. From Dome A, velocity speed increases to 1, 10 and 20 m a−1 at the sites DT416, DT333 and DT263, respectively.
The comparison between GPS and InSAR indicates that the InSAR velocity reported error is overestimated, with actual error 2.55 m a−1 and reported error 3.52 m a−1, respectively. Within the 1000 km from the coast, GPS is larger than InSAR, and becomes less than that of InSAR after 1000 km. To be consistent with estimates of ice velocity obtained with GPS measurements, a scale value can be applied to InSAR results. When the surface velocity is larger than 5 m a−1, the scale value is ~1.15, and it decreases to 0.12 with the surface velocity <5 m a−1.
The GPS-derived surface velocity field over a decade, 2005–16, provides a critical glaciological measurement and quality control for InSAR results in Antarctica. We find that the InSAR surface velocity estimates with magnitude <5 m a−1, may be in error due to the insensitivity of InSAR to low-velocity estimates and/or InSAR data processing errors. In order to capture correct signatures of ice dynamics and mass balance in an area such as Dome A, it is important to combine various data types such as surface velocity, surface topography, ice thickness and snow accumulation, towards studies addressing Dome A long-term stability in a warming climate.
ACKNOWLEDGEMENTS
We thank the Chinese Arctic and Antarctic Administration, State Oceanic Administration, for sponsoring the field surveying and research works. This study is funded by NSFC (41531069, 41476163, 41476162, 41106163), MOST (2013CBA01804) and SOA (CHINARE 2016, 2017). We thank the anonymous reviewers for helpful comments.


 Open access