


Evidence-based dietary recommendations have a significant role in reducing the risk of lifestyle-related diseases as well as in promoting optimal growth and development in children. In particular, a good diet quality and a high nutrient density are of major importance for health promotion and the prevention of lifestyle-related conditions, like CVD(Reference Schwingshackl, Bogensberger and Hoffmann1), type 2 diabetes(Reference Schwingshackl, Bogensberger and Hoffmann1) and obesity(Reference Asghari, Mirmiran and Yuzbashian2,Reference Troesch, Biesalski and Bos3) . Adherence to a health-promoting diet is crucial for overall health and well-being especially during childhood, since dietary patterns established in childhood tend to continue into the adult years(Reference Mikkila, Rasanen and Raitakari4). A health-promoting diet focuses on a high consumption of vegetables, fruit and berries, whole grain foods, vegetable oil-based spread and low-fat dairy products as well as a low consumption of sugary beverages and foods high in saturated fats(5,6) . A high-quality diet ensures that the individual consumes a nutrient-rich diet which contains plenty of bioactive compounds(6). In addition to nutritional quality, an emphasis is placed on a regular eating frequency, i.e. eating at intervals of 3–4 h, which means four to six meal times a day(5). From the point-of-view of nutrition counselling and health care in children, it is vital to identify individuals with a poor diet quality, allowing health care staff to target those most in need to improve their diet quality.
Food education and child-centred nutrition counselling are based on assessing the child’s current eating habits(7). Often this is done by the 24-h recall method, which is time-consuming, relies on the child’s memory and may not represent the usual food intake(Reference Hammond, Mahan, Mahan and Raymond8). Therefore, there is a clear need to devise a feasible and valid tool with which to assess the diet quality of elementary school-aged children. However, the current international indices of diet quality, like the Australian Child and Adolescent Recommended Food Score (ACARFS)(Reference Marshall, Watson and Burrows9), Healthy Eating Index (HEI)(Reference Guenther, Reedy and Krebs-Smith10) and Diet Quality Index-International (DQI-I)(Reference Kim, Haines and Siega-Riz11) are not suitable for assessing diet quality of Finnish elementary school-aged children due to different food cultures. Furthermore, they are too laborious and impractical to be used in schools or child health care due to their scoring system which is based on the calculation of nutrient intake from another method of food intake, like a 24-h recall(Reference Guenther, Reedy and Krebs-Smith10,Reference Kim, Haines and Siega-Riz11) or a food frequency questionnaire (FFQ)(Reference Marshall, Watson and Burrows9).
We have previously developed and validated stand-alone indices for the assessment of diet quality in Finnish adults(Reference Leppala, Lagstrom and Kaljonen12) and preschool-aged children (the Children’s Index of Diet Quality, CIDQ)(Reference Roytio, Jaakkola and Hoppu13). Our aim here was to develop and evaluate a short, stand-alone index appropriate for elementary school-aged children, called the Elementary School-aged Children’s Index of Diet Quality (ES-CIDQ). For this purpose, it was necessary to recognise the foods typically being included in the elementary school-aged children’s diet and further to identify the foods that best depict the quality of the diet. It was postulated that the ES-CIDQ would represent a feasible and cost-effective tool to support child-centred nutrition counselling of elementary school-aged children as well as having applications in nutrition research.
Methods
Study design and participants
In this cross-sectional study, a diet quality index for elementary school-aged children was developed based on the food consumption evaluated by a FFQ and nutrient intakes calculated from a 5-d food diary. Elementary school-aged children living in the Turku area (Southwest Finland) or the Kuopio area (Eastern Finland) were invited to participate in the study between March 2017 and February 2018. Children were recruited from both areas to take into account potential differences in the dietary intake in the eastern and western parts of the country as previously observed in Finnish adults(Reference Valsta, Kaartinen and Tapanainen14). In Finland, the elementary schooling represents grades 1 through 6, and children start the elementary school in the year when they turn 7 years. We aimed for a sample of seventy children per school grade, comprising a total of 420 children, i.e. a similar number of cases as in our previous diet quality index validation study(Reference Roytio, Jaakkola and Hoppu13). A random sample of 5000 families (name and address of the child and a parent) with children from the target age groups living in Turku or Kuopio or in neighbouring towns within a reasonable distance was drawn from the Finnish Population Information system. Invitation letters to participate in the study were sent to their homes. As the response rate appeared to be low, additional routes for recruitment were adopted: an electronic communication system used in home–school communication and e-mails to children’s hobby organisations were used to inform the families about the study in both study areas. Children and/or parents having inadequate Finnish skills to fill in the questionnaires or who were otherwise unable to give their informed consent, children with a severe disease such as cancer, and children with a special diet or food allergy which exerted a major impact on their dietary intake, e.g. gluten-free diet, milk allergy or multiple food allergies, were excluded. In addition, in case of more than one eligible child in a family, only one child was taken into the study and the choice was made by the family. The study flow is depicted in Fig. 1.

Fig. 1 Study flowchart
Families interested in participating in the study contacted the researchers who provided further information about it over the phone and scheduled a study visit. A food diary with portion picture booklet(Reference Nissinen, Korkalo and Vepsalainen15) to help with the estimation of portion sizes, a questionnaire inquiring about background information such as parents’ education and income, and a study information leaflet describing the aims, the content of the questionnaires and the ethical aspects of the study were mailed to the participating families before the study visit.
During the study visit, the families filled in a FFQ and the children’s weights and heights were measured by the researchers. Height and weight were measured with an electronic measuring station (Seca inspecta 285, Seca, Germany) in Eastern Finland, and height with a wall-mounted stadiometer (Person-check, Medizintechnik KaWe, Kirchner & Wilhelm, Germany) and weight with an electronic scale (BOD POD, COSMED USA, Inc.) in Southwest Finland. Height and weight were measured with the children wearing only underwear to the nearest 0·1 cm and 0·1 kg according to standard procedures. The weight status of the children was defined by using a BMI sd score based on Finnish growth reference curves(Reference Saari, Sankilampi and Hannila16).
Dietary intake
Children’s dietary intakes were assessed by a 5-d food diary and a FFQ. Prior to the study visit, the children had filled in a 5-d food diary with the help of their parents. Families were given oral and written instructions on how to fill in the food diary as accurately as possible by using household measures to quantify the portion sizes. In addition, portion picture booklets(Reference Nissinen, Korkalo and Vepsalainen15) were provided to help the families to estimate the portion sizes of consumed foods and drinks. They were asked to fill in the food diary for five consecutive days, of which at least one would be a weekend day. Children were also instructed to fill in the food diary right after eating or drinking and they were encouraged to take pictures of the food portions during school lunch. During the study visit, the food diaries were checked for completeness and accuracy with the participants with the help of the portion picture booklet. Furthermore, the school meal providers were contacted to obtain information on the school lunch menu and typical foods served, including type of milk and spread. Daily intakes of nutrients and food groups were calculated from the food diaries with food intake calculation software Micro-Nutrica version 2·5 (Research Centre of the Social Insurance Institution, Turku, Finland).
During the study visit, the children and the parents filled in a FFQ with twenty-nine multiple-item questions which inquired about the consumption of food items, portion sizes and eating frequency over the previous week. The questions were based on typical foods consumed by this age group and also chosen to reflect the criteria of health-promoting diet set in the Finnish and Nordic nutrition recommendations(5,6) (Table 1). Examples of food items and their portion sizes were given in the questionnaire to help estimate the amount of food portions consumed. Prior to the study visits, the FFQ was piloted in eight children and their families, after which, based on feedback from the families, nine questions were refined to be more accurate.
Table 1 Criteria for health promoting diet and children’s adherence to the criteria (n 266)

E%, percent of energy intake; MJ, megajoule.
Development of the diet quality index and statistical analyses
The data from the FFQ and the 5-d food diary were used to develop the ES-CIDQ. Firstly, ten criteria of a health-promoting diet were chosen on the basis of national dietary recommendations(5,6) for the target age group. The intakes of SFA (percent of energy intake, E%), sucrose (E%), fibre (g/MJ), vegetables, fruit and berries (g), vitamin C (mg), zinc (mg), calcium (mg), folic acid (µg), vitamin D (µg) and iron (mg) were calculated from the food diaries and the proportions of children with intakes in accordance with the recommendations were estimated. Secondly, Pearson and Spearman correlations were calculated by comparing the intakes of all of these ten nutrients and foods with each other, as obtained from the food diaries. Based on the moderate or strong correlations (r = 0·52–0·79) with the other nutrients or foods, folic acid, vitamin D and iron were excluded from the criteria list as the food sources containing these nutrients were overlapping, and the remaining seven criteria (Table 1) were considered to be the best sources for measuring health-promoting diet in children.
Forming the model
Associations between the number of fulfilled health-promoting diet criteria as a continuous outcome and categorised ordinal variables from the FFQ, inquiring about the frequency of consumed food items, were studied with Spearman correlation coefficients. Variables from the FFQ were categorised based on the extent to which they fulfilled the dietary recommendations and the distribution of frequencies of consumed foods in the study population, e.g. the portions of vegetables, fruit and/or berries consumed per day was categorised as follows: 0–1·9, 2–4·9 and 5 or more portions a day, the recommended consumption being at least five portions of vegetables, fruit and/or berries a day. Moreover, combined variables, including ‘sugary beverages’ (number of days per week consuming sugary juice and/or soft drinks), ‘vegetables, fruit and berries’ (portions of vegetables, fruit and/or berries consumed per day) ‘cheese’ (type of cheese consumed according to its fat percent and the number of days per week of consuming cheese), ‘fast foods’ (number of days per week of consuming pizza, hamburgers, tortillas, meat pasties and/or nuggets), ‘savoury snacks’ (number of days per week consuming potato chips and/or popcorn), ‘sweets’ (number of days per week consuming sweets and/or chocolate), as well as ‘sweet snacks’ (number of days per week consuming ice cream, pudding, pastry, cookies and/or snack bars) were created and used in the analyses instead of the original variables. All the categorised ordinal variables, inquiring about the frequency of consumed food items, with significant correlations with the number of fulfilled health-promoting diet criteria as a continuous outcome were chosen for further analyses. Despite non-significant correlations with the criteria, variables regarding the consumption of sugary beverages, fast foods, savoury snacks, sweets, sweet snacks as well as eating snacks between the main meals in weekdays and whether the dietary habits differed between weekdays and weekends were also included in the next step as they were considered to be potentially important when measuring the quality of the child’s diet. After the correlations, the categorised ordinal variables were treated as categorical variables. Thereafter, all the categorised ordinal variables from the FFQ, inquiring about the frequency and portion sizes of consumed food items, as well as nominal variables (for example inquiring about the type of milk consumed by fat percent) were chosen for stepwise logistic regression analysis by using descriptive statistics. At this point, the continuous variable on the number of fulfilled health-promoting diet criteria was categorised into three categories. Variables from the FFQ with any association with the health-promoting diet criteria (P-value of 0·3 or less) in the stepwise logistic regression analysis (12 variables) and variables considered as important for diet quality and presented in the scientific literature, i.e. the number of days per week consuming berries(Reference Bere and Brug17), porridge and/or whole grain cereal(Reference O’Neil, Nicklas and Zanovec18), nuts(Reference Mead, Hill and Carter19), fish(Reference Kranz, Jones and Monsivais20), and sugary beverages(Reference Leung, DiMatteo and Gosliner21), the portions of vegetables, fruit and/or berries consumed per day(Reference Ramsay, Shriver and Taylor22), and whether the eating habits differed between weekdays and weekends(Reference Rothausen, Matthiessen and Andersen23) (altogether seven variables), were chosen to be included in the multinomial logistic regression.
Modelling
After testing multiple approaches (univariable, multivariable and stepwise), univariable multinomial logistic regression analyses were used to identify the final questions from the FFQ which best depicted the diet quality of the children. Four variables were excluded from the final index questions as they represented food groups with nutrients connected with several criteria groups and thus did not fit the scoring system. Moreover, several classifications for the health-promoting diet criteria were tested at this point, with the following categorisation being chosen for further examination: poor (0–2 criteria fulfilled), moderate (3–5 criteria fulfilled) and good diet quality (6–7 criteria fulfilled). The answer options of the questions from the FFQ were scored with 0, 0·5, 1 or 2 points based on the parameter estimates of the logistic regression models and the degree of fulfilling the dietary recommendations. For example, not consuming sugary beverages yielded two points, while 0·5 point was given for consuming sugary beverages 1–2 d/week and 0 points for consuming sugary beverages three or more days a week. The total range of the index scores was 0 to 16·5 points in which the highest scores reflected a better diet quality. Additional rules were also made to obtain the index score: at least 70 % of the questions chosen for the index had to be answered, and if some of the questions were not answered, the missing values (2·0 %, 80 out of 3945 total responses to index questions) were replaced with the mean of all the other answers. Receiver-operating characteristic (ROC) curves were used to choose the suitable cut-off point for a good diet quality. Sensitivity and specificity were both equally important, and the optimal cut-off point was defined as a value nearest to the upper left corner (minimising the Euclidean distance). Hence, based on the statistical experiments, the index scores were categorised into either a poor (0–2 criteria fulfilled) and a good diet quality (3–7 criteria fulfilled). The diet quality index development process has been summarised in Fig. 2.

Fig. 2 Summary of the diet quality index development process
Underreporting of the dietary intake was calculated for the children from food diaries by using the Goldberg cut-off method revised by Black(Reference Black24). The estimation of underreporting was based on the ratio of reported energy intake and calculated BMR, determined by the Schofield equation that takes into account the age, weight and height of the child(Reference Schofield25). Light physical activity level reported by age and gender(26) was used for all the children when calculating the BMR. The ratio of energy intake and BMR ranged from 0·87 to 1·04 depending on child’s age and gender. Of the children, 13 % (35 of 266) were defined as underreporters and 87 % (231 of 266) as plausible reporters. As the results of the logistic regression analyses did not change after excluding underreporters, it was decided that the underreporters could be included in the final analyses.
The normally distributed data are presented as means and SDs and the non-normally distributed data as medians and interquartile ranges. For categorical variables, the data are summarised as frequencies and percentages. Independent samples t-test or Mann–Whitney U test were used to compare the intakes of energy, energy-yielding nutrients and vitamins and minerals between the index categories. Pearson and Spearman correlation coefficients were used to study the correlation between the ES-CIDQ scores and the intake of energy and absolute and energy-adjusted intakes of nutrients. Fisher’s exact test and χ2 test were used to evaluate the association between the categorised ES-CIDQ and gender, school grade and weight status. Association between ES-CIDQ scores and gender, school grade and weight status were studied with Independent samples t-test, ANOVA and Pearson correlation coefficient. All tests were two-tailed and a P-value below 0·05 was considered significant with the analyses being performed using SAS statistical software version 9·4 (SAS Institute, Cary, NC, USA) and IBM SPSS Statistics for Windows, version 27 (IBM Corp, Armonk, NY).
Results
Participant characteristics
A total of 270 children were recruited in the study. Food diary and/or FFQ were missing from four children, thus leaving 266 children with the complete data for the analyses. Of the participants, 66 % (176 of 266) lived in Southwest Finland and 34 % (90 of 266) in Eastern Finland, representing the population densities of these areas. The descriptive characteristics of the children and the parents are presented in Table 2. Of the participants, 48 % (127 of 266) were girls and 21 % (56 of 266) had overweight or obesity. Seventy-eight percent (202 of 259) of the mothers and 60 % (148 of 246) of the fathers had a college or university education.
Table 2 Characteristics of elementary school-aged children and their parents participating in the study
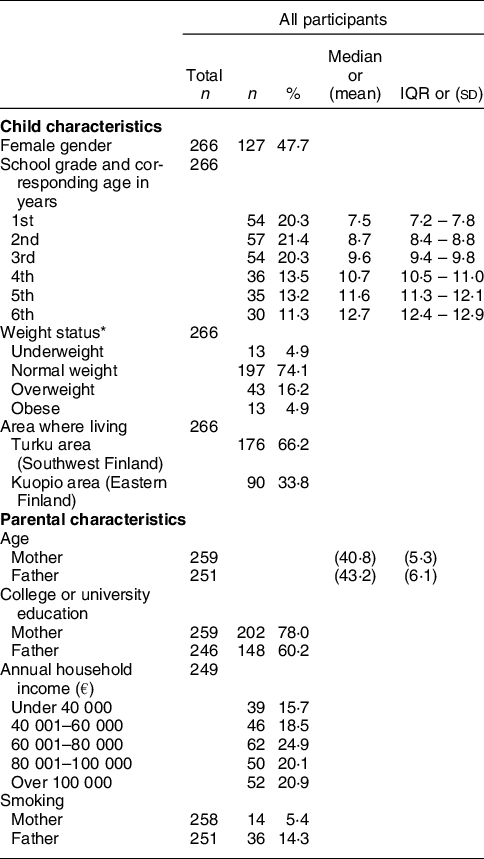
IQR, interquartile range.
* According to Finnish growth reference curves(Reference Saari, Sankilampi and Hannila16), underweight was defined as BMI SDS ≤−1·6482 for girls and BMI SDS ≤−1·8344 for boys, normal weight as BMI SDS −1·6481 to 1·1628 for girls and BMI SDS −1·8343 to 0·7783 for boys, overweight as BMI SDS 1·1629–2·1064 for girls and BMI SDS 0·7784–1·7015 for boys and obesity as BMI SDS ≥ 2·1065 for girls and BMI SDS ≥ 1·7016 for boys.
Diet quality scores and categories
Based on the multinomial logistic regression analyses, fifteen questions from the FFQ were identified as best describing the adherence to the criteria of a health-promoting diet, and thus were used to create the ES-CIDQ (Table 3). The total ES-CIDQ score ranged from 0 to 16·5 points. Using ROC curve analysis, a cut-off point of six points was determined as separating the children with a poor diet quality from those with a good diet quality. With the selected cut-off point, the sensitivity was 0·60 (95 % CI 0·53, 0·67) and the specificity was 0·78 (95 % CI 0·68, 0·87, Fig. 3). For the total ES-CIDQ scores, the area under the ROC curve was 0·74 (95 % CI 0·67, 0·80) for a good diet quality.
Table 3 Questions chosen for the final index and scoring of the questions

E%, percent of energy intake; MJ, megajoule.

Fig. 3 Receiver-operating characteristic curve presenting the ability of the diet quality index to assess a good diet quality among elementary school-aged children. The chosen cut-off point of ≥6 points for good diet quality minimises the Euclidean distance from the upper left corner (– – –, line of no discrimination)
Adherence to the health-promoting diet criteria, calculated from the food diaries, is reported in Table 1. The proportion of children adhering to the criteria ranged from 10·2% (27 of 266, criterion for SFA) to 85·3% (227 of 266, criterion for vitamin C). According to the number of fulfilled criteria, the diet quality was poor (zero to two fulfilled criteria) in 27·8 % (74 of 266) and good (three to seven fulfilled criteria) in 72·2% (192 of 266) of the children.
Nutrient intakes and background factors according to diet quality categories
Based on the categorised ES-CIDQ scores, the overall diet quality was defined as poor (score<6 points) in 50·2 % (132 of 263), and good (score ≥ 6 points) in 49·8 % (131 of 263) of the children. In the comparison of nutrient intakes between the groups based on good and poor diet quality, the energy intake was found to differ and thus the nutrient intakes are presented as energy-adjusted values (energy non-adjusted values are presented in Supplementary table 1). Significant differences in energy-adjusted nutrient intakes were found between the diet quality categories (Table 4); these were attributable to the higher proportions of energy from protein and the lower proportions of energy from sucrose, total fat and SFA in the good diet quality group. No differences between the diet quality categories were found in the intakes of carbohydrates, MUFA and PUFA. Higher intakes of dietary fibre and several vitamins and minerals as well as a lower intake of dietary cholesterol were also associated with a good diet quality. Furthermore, intakes of most nutrients correlated with the ES-CIDQ score (Supplementary Table 2).
Table 4 Associations between the diet quality categories and energy-adjusted nutrient intakes calculated from the 5-d food diaries

E%, percent of energy intake; IQR, interquartile range; MJ, megajoule; RE, retinol equivalent; NE, niacin equivalent.
* Independent samples t-test.
† Mann–Whitney U test.
‡ Altogether three cases had answered under 70 % of the questions chosen for the index.
No associations were detected between the diet quality scores or diet quality categories and the child’s gender or weight status (Supplementary Table 3). Furthermore, the children’s BMI sd score did not correlate with their ES-CIDQ scores (r = −0·03, P = 0·64). The diet quality scores and categorised diet quality were significantly associated with the child’s grade in school (Supplementary Table 3); the proportion of children with good diet quality was higher in younger children (children in grades 1 to 2) in comparison with the older children (children in grades 5 to 6).
Discussion
We describe the development and evaluation of a stand-alone diet quality index for elementary school-aged Finnish children. The ES-CIDQ includes fifteen multiple-item questions inquiring about food intake reflecting food items commonly consumed by children in this age group and an assessment of the diet quality as indicated in the Nordic and Finnish dietary recommendations. The index is a continuous score but it may also be divided into good and poor diet qualities. These categories clearly reflected the dietary intakes of nutrients i.e. the good diet quality category contained more favourable nutrient intakes as compared to the poor quality diet.
Fifteen questions reflecting the diet quality were identified in the study. These questions inquired about the consumption of foods commonly considered as components of a health-promoting diet including vegetables, fruit and berries, low-fat dairy products, whole-grain products, fish and nuts(Reference Bere and Brug17,Reference Steingrimsdottir, Ovesen and Moreiras27,Reference Adamsson, Reumark and Cederholm28) , and also those depicting an unhealthy diet (e.g. sugary beverages). From each category, foods that best reflected the diet quality as indicated in the dietary recommendations were included in the index based on the statistical analyses. As noted in previous studies(Reference Ramsay, Shriver and Taylor22,Reference Ledikwe, Blanck and Khan29,Reference Keim, Forester and Lyly30) , also here the consumption of vegetables, fruit and berries was found to be particularly important in depicting a good diet quality. Additionally, previous studies have indicated that a regular eating frequency and the consumption of healthy snacks between the meals are important parts of a health-promoting diet in children(Reference Evans, Jacques and Dallal31,Reference Llaurado, Albar and Giralt32) and further that the children’s dietary habits may be less healthy during weekends when compared to weekdays(Reference Rothausen, Matthiessen and Andersen23,Reference Bjelland, Lien and Grydeland33) . Hence, questions on eating snacks between main meals and whether the dietary habits differ between weekdays and weekends were included in the analyses. Indeed, these variables were significant contributors to the good diet quality in the logistic regression model, although their contribution was smaller in the index than that of vegetables, fruit and berries. It is well known that the intake of SFA in childhood is an important determinant of different aspects of health, for example, cardiovascular health(Reference Pahkala, Laitinen and Niinikoski34,Reference Juonala, Viikari and Kahonen35) . In our study, the food sources of SFA were also found to relate to adherence to a health-promoting diet; several questions, including those assessing the type of milk, cheese and spread consumed, were found to be relevant with regard to the SFA intake. This was also seen in the diet quality categories as the SFA intake was significantly higher in children with a poor diet quality compared to those with a good diet quality. A reasonable intake of unsaturated fatty acids is vitally important for the child’s health, but since many food items with unsaturated fatty acids contain also SFA, it is challenging to differentiate certain foods as determinants of good and poor diet quality if one tries to base the distinction solely on MUFA and PUFA intakes. This was seen in the statistical explorations of our previous study with preschool-aged children(Reference Roytio, Jaakkola and Hoppu13), as well as in this study, and thus the intakes of MUFA and PUFA were omitted from the criteria of a health-promoting diet.
When assessing the validity of the categorised ES-CIDQ, the sensitivity and specificity of the index in separating the children with a poor and good diet quality were evaluated by a ROC analysis. The estimated values for sensitivity and specificity of 0·60 and 0·78, respectively, are comparable with other studies reporting the validity of dietary assessment tools(Reference Leppala, Lagstrom and Kaljonen12,Reference Roytio, Jaakkola and Hoppu13,Reference Palacios, Segarra and Trak36,Reference Moursi, Arimond and Dewey37) . In addition, the area under the ROC curve, used to measure the accuracy of the index, was 0·74 for the good diet quality, which is considered as acceptable(Reference Mandrekar38). Furthermore, the intakes of protein, dietary fibre and most vitamins and minerals were significantly higher and the intakes of sucrose, total fat, SFA and cholesterol significantly lower in children consuming a good quality diet as compared to the respective intakes in children with a poor diet quality. These results suggest that the index is a feasible tool for assessing diet quality, both poor and good, with reference to the national dietary recommendations. In the statistical explorations, we also sought to divide the diet quality into three categories on the basis that it could provide more detailed information on adherence to the dietary recommendations. However, it was not possible to create this kind of tripartite categorisation in a satisfactory manner due to overlap of the categories, and as three group approach diminishes statistical power. Instead, the two-category index was particularly specific in identifying children with a poor diet quality, which we considered especially important in clinical practice and school health care as it could be beneficial in screening those children most in need of nutrition counselling. For research purposes, the continuous index score provides a valid means for the assessment of the overall diet quality, although obviously the use of other categorisations, including the division of the data into quartiles, would be possible in studies with sufficiently large sample numbers.
In addition to developing the ES-CIDQ, our study provides important information on the diet quality of elementary school-aged children. While over half of the children fulfilled the dietary recommendation-based criteria for sucrose, vitamin C, calcium and zinc, only one-third or less of the children consumed vegetables, fruit and berries, dietary fibre and SFA as recommended. These results are in line with an earlier study which examined Finnish children aged 6–8 years in which a low adherence was detected to the dietary recommendations regarding the intakes of vegetables, fruit and berries, dietary fibre and SFA (5, 7–11 and 24 % of the children, respectively)(Reference Eloranta, Lindi and Schwab39). In addition, recent surveys on schoolchildren’s well-being have found evidence of a lower than recommended frequency in the consumption of vegetables, fruit and/or berries as self-reported by the children(Reference Inchley, Currie and Young40,41) . When evaluated by the ES-CIDQ, half of the children in this study were consuming a good diet quality, which is a rather similar or even somewhat higher proportion than reported in previous studies with elementary school-aged children from other parts of Europe. Spanish investigators(Reference Mariscal-Arcas, Rivas and Velasco42,Reference Buja, Grotto and Brocadello43) found that 26–49 % of elementary school-aged children had a good diet quality measured by the Mediterranean Diet Quality Index for children and adolescents (KIDMED), used to evaluate the adherence to the Mediterranean diet, while in Crete(Reference Angelopoulos, Kourlaba and Kondaki44) and Italy(Reference Roccaldo, Censi and D’Addezio45) only 3·5–5 % of the children, respectively, had a good diet quality as measured by the same KIDMED index or the HEI that describes adherence to American dietary recommendations. Moreover, only every fifth Canadian 11–12-year-old child had a good diet quality as measured by the revised Canadian Healthy Eating Index (HEIC-2009)(Reference Woodruff and Hanning46). However, comparison of the results is complicated by the differences in the indices used and the different dietary recommendations. Interestingly, in our study, the diet quality categories did not differ by gender and weight status, instead the proportion of children with good diet quality was higher in younger children than their older peers. This result is supported by previous studies showing that diet quality becomes poorer with age(Reference Banfield, Liu and Davis47–Reference Thomson, Tussing-Humphreys and Goodman49), possibly due to the increasing independency in eating and the higher consumption of nutrient-poor foods such as fast foods and sugary beverages.
Along with the index developed in this study, as far as we are aware, there are only a few other diet quality indices developed for children that do not necessitate complicated nutrient intake calculations from some other (dietary intake) tool. We have previously developed and validated a stand-alone index for the assessment of diet quality in preschool-aged children(Reference Roytio, Jaakkola and Hoppu13), and another self-standing index, KIDMED, has been developed and validated for children and adolescents to assess adherence to a Mediterranean diet(Reference Serra-Majem, Ribas and Ngo50). Although developed in Spain, the KIDMED index has been used in many countries especially in the Mediterranean area, but it is unclear whether the index would be valid for use in all countries. The ES-CIDQ developed in this study is suitable for the Finnish food culture, but it should also be applicable for diet quality assessment in other Northern European countries with relatively similar dietary cultures. Although this aspect needs further evaluation, clearly there is a potential for expanding the use of ES-CIDQ to other countries in a similar way as has been done with the KIDMED index.
The strengths of the study include the fact that we examined a representative sample of Finnish elementary school-aged children with regard to gender and weight. The proportion of girls and boys (48 and 52 %, respectively) corresponds to the national distribution (49 and 51 %, respectively)(Reference Kiuru, Gissler and Heino51). Fourteen percent of the girls and 27 % of the boys had overweight or obesity, i.e. very close to the average proportion in Finnish elementary school-aged children, 18 and 28 %, respectively(Reference Jääskeläinen, Mäki and Mölläri52). Moreover, to increase the representativeness of the study population, we recruited children from both Southwest and Eastern Finland to better reflect the diet of the Finnish children, as it is known that there are differences in the dietary intake of adults in the eastern and western parts of the country(Reference Valsta, Kaartinen and Tapanainen14). As a potential limitation, the proportion of parents with a university level education was higher than the national average of 33 % of adults(53), and about two-thirds of the families had a high income level; these features are typically encountered in practically all types of research involving human volunteer participants. Since a high socio-economic status of children has been linked with a higher consumption of healthy foods than in children with a low socio-economic status(Reference Eloranta, Lindi and Schwab39,Reference Manyanga, Tremblay and Chaput54) , the index might not be fully applicable for measuring the diet quality of children whose parents have a lower education and income level. Furthermore, it can be debated what are the number of days needed in a food diary to best reflect actual nutrient intakes. As a compromise, we chose a 5-d food diary instead of 3- or 7-d food diaries, which have also been used in developing diet quality indices, since this 5-day period is not unreasonably time-consuming for busy families, but accurate enough to assess the dietary intake reliably at a group level(Reference Ortega, Perez-Rodrigo and Lopez-Sobaler55,Reference Willett56) . Nonetheless, it is evident that it can be a nuisance to fill in even a 5-d food diary for a family with children at elementary school, and therefore, the responses may be susceptible to some misreporting(Reference Willett56). We also cannot exclude the possibility of social desirability or recall bias related to FFQ and food diary methods; overestimating the consumption of recommended, health-promoting food choices or underestimating the consumption of foods known to be detrimental for health(Reference Lovegrove, Sharma and Hodson57–Reference Di Noia, Cullen and Monica59). However, underreporting was considered in the analyses and found not to influence the results when determining the final questions for the ES-CIDQ. Furthermore, several precautions were taken to ensure accurate recording of food intake, namely a validated portion picture booklet was provided to the families to help them to estimate the portion sizes, families were given oral and written instructions on how to fill in the food diary, and the food diaries were thoroughly checked with the families as a part of the study visit. Lastly, the appropriate sample size for the study may be debated as there was no statistically relevant way to calculate the optimal sample size prior to initiating the study. Thus, according to our previous index development study(Reference Roytio, Jaakkola and Hoppu13), we planned that the sample size should be 420 participants, but eventually the number of participants was somewhat lower than planned. However, in some previous investigations developing and validating other diet quality indices, the number of participants has been even lower, ranging from 65 to 127(Reference Leppala, Lagstrom and Kaljonen12,Reference Newby, Hu and Rimm60–Reference Chamoli, Jain and Tyagi62) .
Conclusions
The diet quality index, ES-CIDQ, developed in the study represented children’s diet quality as defined in the dietary recommendations. The ES-CIDQ can be used for assessing diet quality in Finnish elementary school-aged children in clinical practice; it is especially beneficial for screening purposes in identifying those children most in need of nutrition counselling but it can also be utilised in school health care, as well as in nutrition research.
Acknowledgements
We thank all the families and researcher assistants for making this study possible. We also thank Ewen MacDonald for the English language revision.
Financial support
This research was partly funded by the OLVI Foundation (grant number 201520690) and the Finnish Food Research Foundation (no grant number). EK received personal funding from the Juho Vainio Foundation (grant number 202100303). The funding source had no role in the design, execution, analyses, interpretation of the data or the decision to submit these results.
Conflict of interest
There are no conflicts of interest.
Authorship
ON and KL formulated the research question. ON, KL and EK designed the study. EK contributed to the data collection. MR and TV analysed the data. MR, TV, EK and KL interpreted the results. EK and KL wrote the manuscript. KL has the primary responsibility for the final content. All authors have reviewed and revised the final manuscript.
Ethics of human subject participation
The study was conducted according to the guidelines of the Declaration of Helsinki and its later amendments, and the protocol was approved by the Ethics committee for Human Sciences at the University of Turku. All parents and children provided written informed consent prior to participation.
Supplementary material
For supplementary material accompanying this paper visit https://doi.org/10.1017/S1368980021003657


